Introduction
Red meat, in contrast to white meat (including poultry and fishes), is of mammalian origin and includes beef, pork, lamb, and goat [1]. For centuries, red meat has been an important source of dietary protein for human beings. It was scarce until modern techniques for the livestock industry facilitated increasing consumption of red meat in all economic classes among most countries [2]. On a global scale, meat consumption per capita has increased by nearly 20 kg since 1961, and the average meat intake reached 43 kg in 2014 while red and processed meat contributed to approximately two-thirds of meat consumption (about 540 g/week of red and processed meat) [3].
Accumulated evidence suggests that a diet high in red meat rather than white meat is linked to a series of health problems [4–6], including increased risks of cancer, type 2 diabetes, ischemic heart disease, and early death [3, 7–14]. The red meat-related health consequences cost an estimated 285 billion U.S. dollars globally in 2020, which accounted for 0.3% of the whole health expenditure estimated for that year [15]. In 2015, the International Agency for Research on Cancer (IARC) of the World Health Organization (WHO) labeled red meat as a Group 2A carcinogen, meaning an agent that probably causes cancer in humans [16]. Recent guidelines recommend a restricted daily intake of red meat in the general population [17]. Moreover, the overdeveloped livestock industry meeting the increasing need for red meat may contribute to greenhouse gas emissions with a potential environmental impact [18].
With both positive and negative health, economic, social, and environmental impacts from red meat consumption, the literature knows little about the exposure strength or burden that may be attributed to a diet high in red meat. Such uncertainty makes it a controversial topic how health policymakers and stakeholders can respond to the increasing consumption of red meat in the aspect of public health. Based on the 2019 Global Burden Disease (GBD) data [19], the current study evaluates the worldwide health burden attributable to a diet high in red meat in 204 countries and territories to facilitate understanding how daily intake of red meat impacts global health.
Material and methods
Data source
Data on the burden attributable to a diet high in red meat, including deaths, disability-adjusted life of years (DALYs), summary exposure value (SEV) and their respective age-standardized rates (ASRs) in 21 regions and 204 countries from 1990 to 2019, were obtained from the Global Burden of Disease Collaborative Network [20]. Detailed methods used for the GBD 2019 have been described elsewhere [19]. Since the current study was based on the GBD database using de-identified and aggregated data, the requirement of informed consent was reviewed and waived by the University of Washington institutional review board [19]. This study adhered to the Guidelines for Accurate and Transparent Health Estimates Reporting (GATHER), and the checklist is attached (Supplementary Material 1) [21].
Definitions
Diet high in red meat was defined as mean daily red meat (beef, pork, lamb, and goat, but not poultry, fish, eggs, and all processed meats) intake more than the optional level of 23 g (18–27) per day [1]. Detailed information about the inclusion and exclusion criteria was described previously [19]. Deaths and DALYs related to diet high in red meat were retrieved by age, sex, regions, and countries/territories from 1990 to 2019. The age and sociodemographic index (SDI) stratifications along with other definitions are summarized in Supplementary Material 2.
Statistical analysis
All estimates were reported as absolute numbers, ASRs per 100,000 person-years and percentage changes. Estimated annual percentage changes (EAPCs) with 95% uncertainty intervals (UI) were used to estimate the changing patterns of age-standardized death, DALY, and SEV rates (Supplementary Material 2). The association between the SDI and ASRs of DALY, death, and SEV for 30 years was investigated with a non-linear regression model via the locally estimated scatterplot smoothing (LOESS) method. A two-sided p-value < 0.05 or the 95% UI not crossing 0 suggests statistical significance. All statistical analyses were conducted by R software (Version 4.0.3).
Results
Summary exposure values of diet high in red meat worldwide
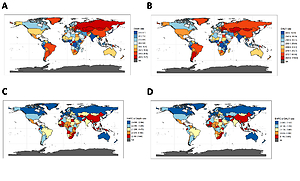
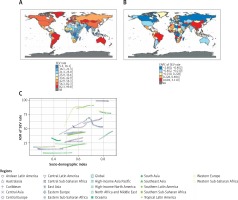
As shown in Table I, the age-standardized SEV rate attributable to a diet high in red meat increased by 8.5% (95% UI: 4.3% to 14.5%) globally, from 40.5 (95% UI: 33.7 to 47.1) in 1990 to 43.9 (95% UI: 38.0 to 49.6) in 2019. In 2019, the region with the highest age-standardized SEV rate was Australasia, followed by Southern Latin America and Tropical Latin America (age-standardized SEV rate: 98.5, 91.3 and 86.5, respectively). From 1990 to 2019, the age-standardized SEV rates increased in most of the 21 GBD regions (including East Asia and Southeast Asia) except for four – Eastern Europe, Oceania, Western Europe and High-income North America – with EAPCs of SEV being –1.0%, –0.5%, –0.2% and –0.1%, respectively. The age-standardized SEV rate increased most rapidly in East Asia, followed by Southeast Asia and High-income Asia Pacific, with EAPCs of SEV being 1.9%, 1.4% and 1.2%, respectively. At the country/territory level, the age-standardized SEV rate increased the most rapidly in Myanmar, followed by Maldives and Viet Nam with EAPCs of SEV being 3.1%, 2.4% and 2.3%, respectively (Figures 1 A–C).
Table I
Age-standardized summary exposure values for diet high in red meat in different geographic regions, with percentage change and EAPC from 1990 to 2019
Figure 1
Age-standardized SEV rates of red meat in 2019, and the EAPC of age-standardized SEV rates from 1990 to 2019 in 204 countries and territories. A – Age-standardized SEV rates of red meat in 2019; B – EAPC of age-standardized SEV rates from 1990 to 2019; C – Age-standardized SEV rates of red meat across 21 GBD regions for both sexes from 1990 to 2019
ASR – age-standardized rate, EAPC – estimated annual percentage change, NA – not available, SEV – summary exposure value.
Deaths and DALY attributable to diet high in red meat
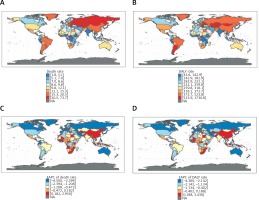
Table II shows the overall and sex-specific trends of global deaths attributable to a diet high in red meat from 1990 to 2019, and Table III shows those of global DALYs. Over the 30 years, global absolute numbers of deaths and DALYs attributable to a diet high in red meat increased by over 50%. In 2019, a diet high in red meat was responsible for 0.9 million (95% UI: 0.5 to 1.3 million) deaths and 23.9 million (95% UI: 15.6 to 32.0 million) DALYs globally. Nevertheless, the worldwide age-standardized death rates and age-standardized DALY rates attributable to a diet high in red meat decreased by 30.3% (95% UI: –35.8% to –22.8%) and 23.5% (95% UI: –30.0% to –13.3%), respectively (Figures 2 A–D). Among the GBD level 2 risk factors, diet high in red meat ranked higher for DALY in 2019 (23rd place) than it did in 1990 (27th). It ranked stably in the 20th place for death from 1990 to 2019. Also, diet high in red meat ranked 5th in the GBD dietary risk factors for attributable DALYs in 1990 and 2019 [22].
Table II
Trends of deaths and corresponding age-standardized rates attributable to diet high in red meat in 1990 and 2019
Table III
Trends of DALYs and corresponding age-standardized rates attributable to diet high in red meat in 1990 and 2019
Figure 2
ASR of diet high in red meat-related deaths and DALYs in 2019, and the EAPC of age-standardized death and DALY rates from 1990 to 2019 in 204 countries and territories. A – ASR of diet high in red meat-related deaths in 2019; B – ASR of diet high in red meat-related DALYs in 2019; C – EAPC of age-standardized death rates from 1990 to 2019; D – EAPC of age-standardized DALY rates from 1990 to 2019
ASR – age-standardized rate, DALY – disability-adjusted life year, EAPC – estimated annual percentage change, NA – not available.
Figures 3 A and B suggest that the age-specific rates of death and DALY attributable to a diet high in red meat increased over age. Death and DALY rates were higher in males than in females among all age groups. Absolute death numbers peaked in the age group ≥ 80 years in both sexes. The DALY numbers peaked at the 60–64 age group in males, whereas it peaked in the age group ≥ 80 years in females. Decreasing trends were detected in age-standardized death and DALY rates’ EAPCs for males and females (death: –1.1% and –1.7%; DALY: –0.8% and –1.3%, respectively) (Tables II and III). Age-specific absolute deaths and DALYs along with corresponding rates in different SDI levels are shown in Supplementary Figures 1 A–J.
Figure 3
Age-specific numbers and rates of diet high in red meat-related deaths and DALYs in males and females worldwide. A – Age-specific numbers and rates of diet high in red meat-related deaths in males and females worldwide; B – Age-specific numbers and rates of diet high in red meat-related DALYs in males and females worldwide
DALY – disability-adjusted life year.

Among the 21 regions, East Asia showed the highest numbers of deaths (0.1 million in 1990 and 0.3 million in 2019) and DALYs (3.6 million in 1990 and 9.0 million in 2019) attributable to a diet high in red meat, followed by Western Europe, East Europe and High-income North America. The region with the highest age-standardized death and DALY rates changed from Eastern Europe in 1990 to Central Asia in 2019. From 1990 to 2019, the region with the largest percentage decline in the age-standardized death and DALY rates was Australasia (death: –59.7% and DALY: –55.3%), whereas Southeast Asia saw the biggest percentage increase in the age-standardized rates by 35.3% for death and by 41.4% for DALYs (Tables II and III). We also summarized the top three countries/territories by different estimates (Table IV and Supplementary Table SI).
Table IV
Top 3 countries/territories of death, DALYs and summary exposure values in different scales (absolute number, percentage changes of age-standardized rates from 1990 to 2019, changes in EAPC of age-standardized rates from 1990 to 2019)
Impact of diet high in red meat on diseases
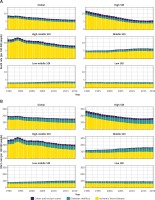
In 2019, ischemic heart disease, diabetes, and colorectal cancer were the three leading diseases attributable to a diet high in red meat, which accounted for 54.3% of diet high in red meat-related deaths (39.2%, 9.2%, and 5.9% respectively) in total. A similar pattern was found for DALYs. In 2019, diet high in red meat-related age-standardized death rates of ischemic heart disease, diabetes and colorectal cancer were 4.5, 1.0 and 0.7 per 100,000 people, respectively, and DALY rates were 94.6, 49.8 and 14.9 per 100,000 people, respectively (Supplementary Tables SII–SIV). Worldwide, the age-standardized death and DALY rates for ischemic heart disease associated with diet high in red meat decreased from 1990 to 2019, while those for diabetes increased and those for colorectal cancer kept stable (Figure 4, Supplementary Tables SII–SIV). However, disparities still existed in different SDI quintiles for the age-standardized death and DALY rates for ischemic heart disease and colorectal cancer (Figures 4 A, B). The age-standardized death and DALY rates of ischemic heart disease and colorectal cancer showed a decreasing trend in the high and high-middle SDI quintiles, while those for the middle and low-middle SDI were increasing. Notably, the age-standardized DALY rates of diabetes were rising in all SDI quantiles.
Figure 4
Fraction of ischemic heart disease, diabetes mellitus and colorectal cancer age-standardized death and DALY rates attributable to diet high in red meat by SDI over 30 years. A – Fraction of age-standardized death rates of each disease by SDI over 30 years; B – Fraction of age-standardized DALY rates of each disease by SDI over 30 years
DALY – disability-adjusted life year, SDI – socio-demographic index.
Burden attributable to diet high in red meat in countries or territories with different SDI
Figure 5 illustrates the trend of age-standardized SEV, death, and DALY rates of diet high in red meat in countries or territories with different SDI. The high SDI quintile has always held the highest age-standardized SEV rate attributable to a diet high in red meat, while the age-standardized SEV rate remained the lowest in the low SDI quintile. The age-standardized SEV rates of middle and low-middle SDI quintiles increased the most rapidly (EAPC 1.0%, 95% UI: 0.9% to 1.1.%) and went up by more than 30% over the 30 years (Figure 5 A, Table I). From 1990 to 2019, diet high in red meat-related death and DALY numbers increased in all SDI quintiles except for the high SDI quintile (Tables II and III). The high-middle SDI quintile had the highest number of deaths attributable to a diet high in red meat (0.2 million in 1990 and 0.3 million in 2019) (Table II). The district with the highest DALYs changed from the high-middle SDI quintile in 1990 to the middle SDI quintile in 2019 (Table III). The age-standardized death and DALY rates decreased significantly in the high and high-middle SDI quintiles, whereas the changes leveled off in other SDI quintiles during the past 30 years (Figures 5 B and C, Tables II and III).
Figure 5
Changes in diet high in red meat-related age-standardized SEV, death and DALY rate trends of 5 SDI levels over 30 years. A – Changes in age-standardized SEV rate trends of 5 SDI levels over 30 years; B – Changes in age-standardized death rate trends of 5 SDI levels over 30 years; C – Changes in age-standardized DALY rate trends of 5 SDI levels over 30 years; D – Age-standardized death rates attributable to diet high in red meat across 21 GBD regions for both sexes from 1990 to 2019; E – Age-standardized DALY rates attributable to diet high in red meat across 21 GBD regions for both sexes from 1990 to 2019
ASR – age-standardized rate, DALY – disability-adjusted life year, SDI – socio-demographic index, SEV – summary exposure value.
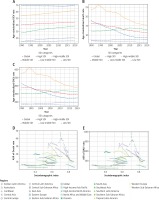
The age-standardized death and DALY rates showed a similar correlation with SDI during the study period. Of the 6 regions with the highest SDI, five showed an obvious decrease in age-standardized death and DALY rates, whereas those in Eastern Europe first saw an obvious increase then a sharp drop between 1990 and 2019. In addition, compared with the six regions with the highest SDI, all the other regions with lower SDI exhibited a mild-to-moderate decline or remained stable in the age-standardized death and DALY rates except for East Asia and Southeast Asia, where the age-standardized death and DALY rates gradually increased from 1990 to 2019 (Figures 5 D, E).
Discussion
This study comprehensively summarized the patterns and trends of epidemiology and burden of diet high in red meat and identified an 8.3% increase of the age-standardized SEV rate of diet high in red meat from 1990 to 2019, and it is among the highest burdensome dietary factors worldwide. The total deaths and DALYs attributable to a diet high in red meat grew by 50% globally from 1990 to 2019, while the age-standardized death and DALY rates decreased by 30.3% and 23.5%, respectively. The main factor contributing to the decrease of age-standardized burden was ischemic heart disease in high or high-middle SDI countries. It calls for advanced healthcare services for risk factors of ischemic heart diseases including blood pressure, cholesterol, glucose and obesity based on recent guidelines [23–31].
Some countries, especially those with middle or low-middle SDI, however, have been facing increasing age-standardized death and DALY rates in the past 30 years. Economic growth, undoubtedly, brought more affordable red meat and shifted the pattern of disease burden in low to middle-income countries from communicable, maternal, neonatal, and nutritional diseases to noncommunicable chronic diseases [32, 33]. Both the burden from ischemic heart disease and colorectal cancer increased in these countries. Since 2002, the age-standardized death and DALY rates in countries with middle SDI have surpassed those with high SDI.
The disparities across countries with different SDIs reflected the effectiveness of proper public health policies in controlling the disease burden attributable to a diet high in red meat and call for attention from stakeholders in countries which may face such policy reformation. Over the past few decades, the decreasing trend of red meat consumption in those high-income countries/territories is largely due to a growing awareness of the negative health effects of red meat and greater compliance with the dietary recommendations [34–36]. People in the high SDI regions are more willing to pay for healthier food such as white meat, poultry or plant-based alternatives replacing red meat [37, 38]. Meanwhile, systemic primary care facilities and medical insurance in these countries support effective prevention and treatment of diseases associated with excessive red meat consumption (especially ischemic heart disease), diminishing deaths and DALY attributable to a diet high in red meat. In addition, other factors such as skilled care services, extensive health education, and low-cost healthcare benefits further contribute to the decrease of burden [39, 40]. With the rising burden attributable to a diet high in red meat, countries in the middle or low-middle SDI quantile warrant urgent reformation and regulation of their current health care systems.
Of note, both the consumption of red meat and attributed disease burden kept stably low in countries with low SDI over the past 30 years. It does not mean that people in these countries will not face such challenges. With persistent economic development but not health policy reformation, overconsumption of red meat will one day bring a burden in these countries, as has happened in other countries in the past few decades. Stakeholders from countries with currently low SDI should always keep this dietary risk factor and others in mind together with the algorithm to develop the economics.
Ischemic heart disease, diabetes and colorectal cancer are major causes of death and disability that are related to overconsumption of red meat [4]. Although the disease burden of ischemic heart disease has been well controlled in countries with high SDI, the age-standardized DALY rates of diabetes attributable to a diet high in red meat continue to increase in most countries or territories. It calls for novel advanced strategies to prevent diabetes as well as its complications without affecting living conditions in other aspects [41].
When interpreting the results in practice, stakeholders should understand the limitations of this study, which was based on the country/region-level data from the GBD website. The lack of individual patient data does not allow us to perform analyses in detail and further explore the factors as well as the dose-response manner. Also, the retrospective ecological design restricted any causal inference, and we are unable to test the effectiveness of a particular health policy.
In conclusion, the increasing consumption of red meat remains a challenge for the world health system, especially in the low-middle or middle SDI countries. Stakeholders should urgently take action in controlling the burden attributable to a diet high in red meat, especially those at risk.


