Introduction
Systemic lupus erythematosus (SLE) is a chronic, autoimmune disease [1]. The key element of the pathogenesis of SLE is the presence of various autoantibodies, including antinuclear antibodies [2]. These autoantibodies are part of circulating immune complexes (CIC) that contribute to the damage of tissues, resulting in a wide range of symptoms observed in the patients [3]. SLE is much more prevalent in women than men, and it is usually diagnosed in women of childbearing age [4]. This fact has to be taken under consideration in women suffering from SLE and planning pregnancy [5]. The risk of SLE development is linked to sex hormones as women with SLE exhibit higher oestradiol and prolactin levels, and lower testosterone and dehydroepiandrosterone levels [4, 6]. It is well known that testosterone has immunosuppressive properties [7]. Additionally, the relationship between the risk of SLE and factors such as early menarche, early menopause, surgical menopause, and exogenous hormone administration has been studied too [4].
The initial cause of loss of self-tolerance to autoantigens in SLE is unknown. Genetic susceptibility and environmental factors have been studied. Presumably, mutations of genes responsible for immunological response, histocompatibility, and nucleic acid metabolism [8, 9] act synergistically with damage caused by environmental factors, such as tobacco smoke [10]. As a result, intracellular antigens may be exposed to the immune system [9], and neoepitopes may be formed, triggering the immunological response [11, 12].
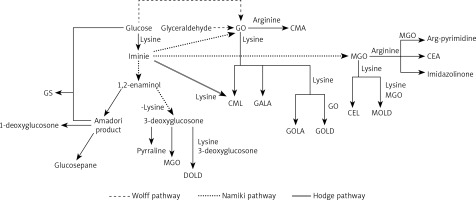
The reaction of glycoxidation, also known as glycation or Maillard reaction, is a series of intertwined reaction pathways that may give rise to neoepitopes [11, 13]. Glycoxidation occurs under physiological and pathological conditions. The reaction begins with a nucleophilic addition of an amino acid to a carbonyl compound, such as monosaccharide (e.g. glucose, fructose), glyoxal (GO), or methylglyoxal (MGO) [14]. Resulting plethora of compounds (Figure 1) have different chemical properties and different effects on the organism. Pentosidine, glucosepane, vesperlysine, glyoxal lysine dimer (GOLD), methylglyoxal lysine dimer (MOLD), and 3-deoxyglucosone lysine dimer (DOLD) are examples of advanced glycation end-products (AGEs) able to crosslink peptide chains. Extracellular matrix long-lived proteins are susceptible to this modification. It is known that crosslinking affects mechanical properties of the extracellular matrix, increases stiffness of tissue, and increases resistance of collagen to its specific proteinases. Importantly, SLE is a connective tissue disease, and crosslinks play a role in pathogenesis of its typical comorbidities, such as accelerated atherosclerosis [14–19]. Presence of glycolaldehyde-derived AGEs induces endoplasmic reticulum stress and apoptosis of chondrocytes, leading to arthritis [19]. Glycation may hinder chaperone activity, proteasomal degradation and turnover of proteins [19–21]. Glyceraldehyde-derived AGEs are considered highly cytotoxic [21, 22]. Glucosone (GS) exhibits cytotoxic properties through intensified H2O2 formation (Figure 1) [15, 23, 24].
Figure 1
Complex relationships between AGEs and α-DCs detected in humans
CEA – N7-carboxyethyl arginine, CEL – Nε-carboxyethyllysine, CMA – N7-carboxymethyl arginine, CML – Nε-carboxymethyllysine, GALA – glycolic acid lysine amide, GOLA – glyoxal lysine amide [16, 25]

Many of the glycation reactions favour oxidising conditions (hence its other name glycoxidation) [15, 25]. Oxidative stress accompanies chronic autoimmune diseases, and SLE is no exception [26, 27]. Additionally, oestrogen increases cells’ susceptibility to oxidative stress [28]. Environmental factors may contribute greatly to oxidative stress too [29]. Importantly, glycation products interact with receptor for advanced glycation end-products (RAGE). RAGE is a transmembrane protein; when activated, it sets off proinflammatory signalling [30, 31].
It is known that SLE patients have an elevated total AGE blood level, and it is hypothesised that the AGEs-RAGE axis plays an important role in the etiopathogenesis of SLE. However, none of the separately analysed AGEs have proven to be reliable biomarkers of glycation intensity in SLE patients. In the several available studies, blood concentrations of CML, CEL, and unidentified product of the reaction of protein and ribose did not differ significantly between SLE patients and control groups. A slight increase in the serum level of fructosamine was observed, and contradictory results regarding pentosidine were obtained [32–37].
It is not known which AGEs contribute to the increase of total AGE concentration in the blood of SLE patients. Therefore, the study aimed to evaluate concentrations of chosen carbonyl compounds partaking in the glycoxidation in a pre-established group of women suffering from SLE. The patients were characterised by increased blood levels of AGEs, but CML, CEL, and pentosidine concentrations were comparable to the control group [38]. The selected substances, GS, GO, and MGO, belong to α-dicarbonyl compounds (α-DCs).
Material and methods
Human subjects
The study is a continuation of a previously published paper [38]. The Local Bioethics Committee of the Medical University of Silesia gave permission to perform the study. The SLE patients and healthy subjects gave written consent before participating in the study. SLE patients were recruited during routine cardiological checks at the 2nd Department of Cardiology, Faculty of Medical Sciences in Zabrze, Medical University of Silesia. Thirty-one adult women fulfilling the 1997 American College of Rheumatology (ACR) SLE classification criteria were included in a SLE group. Twenty-six healthy adult women volunteers were recruited to a healthy control group. Subjects with glucose levels above normal were excluded from the study due to the impact of diabetes on AGEs formation.
Fasting blood samples were drawn from the subjects. Blood serum was obtained by clotting at room temperature and subsequent centrifugation. Samples had been stored at –80°C until being used.
Reagents
The following reagents were used in the study:
– From Sigma-Aldrich/Merck (Darmstadt, Germany): evaluated compounds: glucosone (GS), glyoxal (GO), methylglyoxal (MGO); internal standard ethylmethylglyoxal (EMGO); derivatizing agent 4-carbomethoxy-benzaldehyde (CMBAL); mobile phase formic acid, methanol.
– From Supelco/Merck (Darmstadt, Germany): deproteinization agent and solvent acetonitrile; derivatizing agent ammonium acetate.
– From Chempur (Piekary Śląskie, Poland): solvent glacial acetic acid.
High-performance liquid chromatography with fluorescence detector (HPLC-FLD)
The method proposed by El-Maghrabey et al. was used to evaluate the concentrations of α-DCs in the blood serum samples [39]. The following equipment and elution conditions were applied to separate analysed compounds: liquid chromatograph Ultimate 3000 TSL with WPS-3000 TSL autosampler, TCC–3200 thermostat and Chromeleon 6.8 software (Dionex Softron, Germering, Germany); column LiChrospher® 60 RP-select B (250 mm × 4 mm, 5 µm) with LiChroCART® 250-4 cartridge (Merck, Darmstadt, Germany); injection volume 20 µl; separation temperature 30°C; mobile phase methanol : water (15 : 85, v/v) with 0.2% formic acid; isocratic elution; flow rate 0–26 min: 0.6 ml/min, 27–35 min: 2.0 ml/min, 36–63 min: 2.5 ml/min; fluorescence detector Shimadzu RF-2000 (Shimadzu, Kyoto, Japan); excitation wavelength λex = 310 nm; emission wavelength λem = 410 nm.
The non-fluorescent α-DCs were derivatized to enable HPLC-FLD analysis, according to the method described by El-Maghrabey et al. [39].
The stock solutions were used to prepare solutions for calibration curves. External standards were used for quantitative determination of GS, GO, and MGO concentrations. The calibration curves consisted of 7 points corresponding to the following concentrations of the analysed compounds: 12 500.0 nmol/l; 6250.0 nmol/l; 3125.0 nmol/l; 1562.5 nmol/l; 781.3 nmol/l; 390.6 nmol/l, and 195.3 nmol/l. The method of least squares was used to prepare the curves. The concentrations of analysed samples were calculated based on the surface area of peaks. The limit of detection (LOD) was calculated as signal to noise ratio 3 : 1. The limit of quantification (LOQ) was calculated as a threefold value of LOD. Retention times, regression equations, correlation coefficients, LODs, and LOQs of analysed α-DCs are presented in Table I.
Table I
Retention times, regression equations, correlation coefficients, LODs, and LOQs of GS, GO, and MGO
To calculate recovery rates, the serum samples were spiked with α-DCs at three different concentration levels: 781.3 nmol/l; 390.6 nmol/l, and 195.3 nmol/l. Results were compared with non-spiked samples, and recovery was calculated with use of the equation depicted below:
W = × 100% W = × 100% where W – recovery (%); c1 – concentration of the compound in a spiked sample (nmol/l); c2 – concentration of the compound in a non-spiked sample (nmol/l); c – concentration of standard added to a spiked sample (nmol/l). The recovery rates are presented in Table II. Intra-day precision of results was calculated based on standard deviations of series (n = 6) of standard samples on three different concentration levels: 781.3 nmol/l; 390.6 nmol/l, and 195.3 nmol/l. Inter-day precision was calculated based on analysis of previously mentioned samples, but over the time of 6 consecutive days. Precision is presented in Table II as relative standard deviation (RSD).
Table II
Recovery, intra-day precision, and inter-day precision of GS, GO, and MGO
Statistical analysis
Statistica for Windows, version 13 (StatSoft Polska, Cracow, Poland) software was used to perform the statistical analysis. Shapiro-Wilk test was used to explore the distribution of data. Non-parametric Kolmogorov-Smirnov and Mann-Whitney U tests were used to compare independent data between the SLE patients group and the healthy control group. Spearman’s rank correlation coefficients were calculated to explore the statistical dependence between two variables. p < 0.05 was considered the threshold of statistical significance.
Results
Characteristics of the human subjects
The characteristics of the SLE patient group and the healthy control group are shown in Table III. To reduce heterogeneity of the group (decrease the influence of sex and ethnic descent), only women of Caucasian descent participated in the study. 22.6% of the patients received antimalarial drugs, 35.5% received corticosteroids, and 45.2% received antimetabolites. Additional information about the participants of the study can be found in our previous paper [38].
Table III
Characteristics of the study and the control groups
HPLC-FLD results
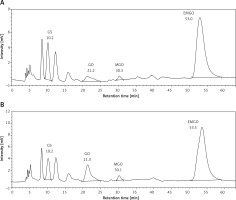
Results of the HPLC-FLD analysis are shown in Table IV and Figure 2. The blood serum concentrations of all evaluated α-DCs (GS, GO, MGO) were statistically significantly lower in the SLE patients when compared to the control group.
Table IV
Concentrations of GS, GO, and MGO in the groups and the statistical significance of differences between them
Figure 2
Representative chromatograms of the serum samples; A – the SLE patient group, B – the healthy control group

A statistical analysis was performed to compare α-DCs concentrations in groups of SLE patients treated with different medications. The analysis showed no dependence between mean concentrations of GO, MGO, and GS and used medication.
Correlation of the data
Data obtained in the present study as well as data obtained in our previous study [38] were used to explore possible correlations between the evaluated parameters.
In the SLE patient group there were statistically significant positive correlations between the following pairs of variables: GO and GS, MGO and GS, MGO and GO. In the healthy control group there was a statistically significant positive correlation between GO and MGO. There were also statistically significant negative correlations between GO and AGEs, and GO and CML in the control group. Statistically significant correlations of pairs of variables are presented in Table V. None of the analysed parameters correlated with disease duration time, age, GFR, SLEDAI-2K, and creatinine.
Table V
Statistically significant correlations between data obtained in the current study and in our previous study
Discussion
Despite the existence of many compounds participating in glycoxidation, there are few studies focused on evaluation of particular substrates and products of this reaction in SLE patients [32–37]. Therefore, we decided to broaden our knowledge about the concentrations of α-DCs in SLE as they are important substrates and intermediates of glycoxidation.
Metabolism of carbohydrates and their derivatives (such as ascorbic acid and polyols) is a major endogenous source of GO. Degradation of glycated proteins and autoxidation of lipids are sources of GO too [40]. It is worth noting that oxidation of lipids is intensified in SLE patients [41]. The exogenous sources of GO include various food products, beverages, cigarette smoke, and environmental pollution [40]. MGO is formed mainly during degradation of dihydroxyacetone phosphate and glyceraldehyde 3-phosphate, important intermediates of basic carbohydrate metabolism. Degradation of glycated proteins, catabolism of threonine, and ketone body metabolism are among the less important sources of endogenous MGO. Exogenous exposure to MGO is considered negligible. Importantly, MGO is the most reactive of all α-DCs present in the human body [42].
GS is formed under oxidative conditions, either from glucose or glucose’s Amadori product [16]. Cleavage of GS and similar six carbon chain length glycation intermediates results in formation of shorter dicarbonyl compounds, including GO and MGO [16, 43]. In contrast with MGO, GS is abundant in food [43].
Some chronic diseases are connected to so-called dicarbonyl stress, a state of increased concentrations of α-oxoaldehydes and their metabolites in the body, which may cause damage to proteins, phospholipids, and DNA [44]. The examples include diabetes and diabetes-induced complications (nephropathy, retinopathy, neuropathy, atherosclerosis), obesity, neurodegenerative diseases, cardiovascular disease, renal failure, and rheumatoid arthritis (RA) [44–46]. MGO-modified immunoglobulins are recognized as neoepitopes and cause immune response in RA patients [47]. Considering the known high level of AGEs, increased oxidative stress, and intensified peroxidation of lipids in SLE, it could be hypothesised that the patients might be at risk of elevated dicarbonyl stress. To our knowledge, our study is the first attempt of evaluation of α-DCs in SLE patients. Surprisingly, in our study, women suffering from SLE are characterised by lower mean serum concentrations of GS, GO, and MGO, when compared to the control group.
Unfortunately, not much is known about the impact of SLE on the metabolism of α-DCs. In a study performed by Rai et al. [48] it was noted that genes of MGO metabolism may be underexpressed in SLE patients who have antibodies against extractable nuclear antigens. Low concentration of circulating α-DCs may be caused by their decreased release from tissues. Modification of proteins with MGO impairs their proteasomal degradation (as previously mentioned, degradation of glycated proteins is a source of MGO) [21]. Therefore, AGEs-modified long-lived proteins pose a significant risk of loss of self-tolerance and loss of their physiological functions due to negatively affected protein turnover.
We hypothesise that pathways leading to formation of AGEs such as GALA, GOLA, GOLD, and MOLD [16] are intensified in SLE, which leads to greater consumption of GO and MGO. In our previous research [38] we concluded that mean CML and CEL concentrations in SLE patients are similar to the control group. In the current research we noted a lack of correlation between concentrations of GO and CML or MGO and CEL in SLE patients. These data support the hypothesis of α-DCs being used in glycation pathways other than formation of CML and CEL. The high level of oxidative stress in SLE patients may lead to fast use of MGO in reactions that require oxidative conditions (such as formation of arg-pyrimidine) [16]. These pathways need further investigation in SLE to fully understand the course of glycoxidation in the disease (Figure 1).
The observed statistically significant correlations are different in the examined groups. In the control group there is a negative correlation between the concentrations of GO and CML, indicating the use of GO in the formation of CML. Additionally, GO concentration correlates negatively with AGEs concentration, which again indicates the use of GO in the formation of various AGEs. The correlation of GO and MGO concentrations is the only significant positive correlation in the control group. Both compounds contribute to dicarbonyl stress and are partly derived from similar sources.
In the SLE patient group the correlations are different, indicating that SLE affects the course of glycoxidation. There are strong and positive correlations between all three analysed α-DCs. The correlation between GO and MGO is much stronger than in the control group. As it was mentioned previously, these two compounds arise from similar sources. GS, GO, and MGO are formed in oxidative conditions, and oxidative stress is intensified in the course of SLE [41].
In view of the above, it can be concluded that in women suffering from SLE, the course of glycoxidation is altered when compared to healthy individuals. Interestingly, the patients are characterised by low serum levels of α-DCs. We hypothesise that either hindered proteasomal degradation or fast consumption of α-DCs in oxidative conditions may cause the observed low concentration of α-DCs.
Unfortunately, it is still not clear which AGEs contribute to the overall increase of AGEs blood concentration in SLE. However, the results of our current and previous studies emphasise the impact of the disease on α-DCs metabolism. AGEs formation is a complex phenomenon worth further investigation due to the clear relationship between glycoxidation and pathophysiology of SLE. We are currently working on evaluation methods for complex AGEs such as GALA, GOLA, GOLD, and MOLD in human samples. However, the evaluation of such compounds in biological samples has proven to be challenging regardless of the method used [49, 50].


