Introduction
The accurate assessment of ventricular volume in children was always a challenge, especially in the case of complicated geometry of the right ventricle (RV). In that particular area feasible and low-cost two-dimensional echocardiography (2D-ECHO) may barely offer assumptions on right ventricular volume [1]. Cardiac magnetic resonance (CMR) imaging is the gold standard for volumetric analysis, unmatched so far by any other modality, especially for RV evaluation [2].
Published studies were able to prove three-dimensional echocardiography (3D-ECHO) to be an accessible, easy, and inexpensive tool for the assessment of cardiac morphology in everyday clinical practice [3, 4]. It combines accuracy close to CMR with the accessibility and cost effectiveness of 2D-ECHO. Furthermore, as the image acquisition requires much less time and cooperation than in the case of CMR, it seems to be the perfect modality for the paediatric population, especially in small or hyperactive children in whom magnetic resonance usually requires general anaesthesia with all its potential risks. Published studies have shown consistency between results of 3D-ECHO and CMR, especially in the case of ventricular systolic function [5, 6]. However, the results of volumetric comparison between 3D-ECHO and CMR in children are inconclusive. Also, no results have been published comparing the volumes of both ventricles assessed in the same individuals by 3D-ECHO validated by CMR.
The aim of our study was to address the problem of ventricular volumes’ quantification by 3D-ECHO in the paediatric population in search of potential modifications of the methodology to obtain the best consistency with CMR results.
Material and methods
Our prospective study enrolled 43 consecutive children hospitalised in the Pediatric Cardiology Department, in whom CMR was performed due to clinical indications and followed by 3D-ECHO within 12–24 h. The group was heterogeneous considering diagnostic criteria: 27 patients suffered from arrhythmia, including three patients fulfilling the criteria of arrhythmogenic right ventricular cardiomyopathy (ARVC). Seven patients of the studied cohort were diagnosed with left ventricular cardiomyopathies (3 with dilated, 2 hypertrophied, 1 restrictive cardiomyopathy, and 1 with non-compaction of the left ventricle). Nine patients proved to be healthy either in the course of diagnostics for suspected myocarditis or while being checked up after the healing process was completed. The characteristics of the studied group are presented in Table I.
Table I
Characteristics of the studied group
The postprocessing (offline analysis) of echocardiography data was obtained blinded to the results of CMR.
Cardiac magnetic resonance (CMR)
All CMR studies were performed with a Siemens Magnetom Skyra 3 Tesla scanner (Siemens, Erlangen, Germany). Five patients with whom cooperation during the procedure was impossible (small or hyperactive children) required general anaesthesia. The routine CMR protocol was used [7]. Imaging parameters were as follows: field of view 340 mm, matrix 208, repetition time approximately 39.24 ms, echo time 1.43 ms, flip angle 39°, slice thickness 6–8 mm (depending on the child’s age), gap 2 mm, in-plane image resolution 1.6 × 1.6 × 6–8 mm and temporal resolution 25 phases per cardiac cycle. Images were analysed using dedicated software, short-axis SSFP cine images were previewed and endocardial contours for end-diastole and end-systole of both ventricles (identified manually by the largest and the smallest lumen) were manually traced. Trabeculae and papillary muscles were included in ventricle cavities.
In one child the assessment of both ventricular volumes and in one only the right ventricular volume was impossible in CMR due to artefacts connected with excessive arrhythmia. Those patients were not included in the statistical analysis.
3-dimensional echocardiography (3D-ECHO)
Image acquisition
All children underwent standard echocardiography examination (Philips Epiq system, Netherlands) during which ECG-gated, 3D full-volume data sets were registered using a matrix X5-1/X7-2 transducer with special care to obtain the highest frame rate; in all patients above 20 Hz (mean: 29 Hz). In patients with sinus rhythm the mean recording time approached 3 min, although in patients with excessive arrhythmia it was considerably longer (average: 5 min) because recording four consecutive sinus beats with no extrasystole in real time was more challenging, especially in an effort to exclude the first sinus beat after the arrhythmic one from the recording. In 38 patients four consecutive sinus cardiac beats were recorded. In 5 cases, 2 with numerous extrasystole and 3 uncooperative children, in whom recording of 4 consecutive sinus beats was impossible, two-beat sets were obtained for analysis [8]. In those patients the optimal frame rate was obtained by decreasing the image size either laterally or in depth. At least three full-volume acquisitions for each ventricle were recorded in every patient, and the one with the best quality was assigned for later postprocessing. Although it was not entirely possible to avoid “stitching artefacts” in every case, especially for multi-beat acquisitions, we found their relevance to be minimal in further analysis.
Postprocessing
Full-volume digital 3D data sets for both ventricles were exported to an external server for offline analysis using dedicated software (TomTec Imaging Systems GMBH, Germany; Image Arena 4.6; for the left ventricle 4D LV-Analysis and for the right ventricle 4D RV-Function). The whole analysis was performed by two researchers experienced in 3D-ECHO and software use and then the intra- and inter-observer variability was assessed. For analysis of each ventricle the user identified specific landmarks in end-diastolic and end-systolic views: apex, mitral, and aortic annulus for the left ventricle and additionally tricuspid valve, ventricular diameter in short-axis view along with intraventricular septum perimeters for the right ventricle. The end-diastolic and end-systolic views were defined by the system based on ECG. Based on the landmarks, semiautomatic tracing of the endocardial border was performed and manually corrected by the software operator, both in the long and the short axis of the ventricle, with special care to trace the largest and the smallest lumen of the ventricle based on the moving picture of the cardiac cycle and controlling applied contours in motion, which served to avoid potential volumetric under- or overestimation in case of incompatibility with ECG-marked views. For optimal quality of full-volume data sets the analysis of both ventricles was completed in a mean time of 4 min, and up to 9 min for images of poorer quality requiring more manual tracing.
Left ventricle analysis
To avoid underestimation of ventricular volume the images were viewed in high contrast, which, as we observed, serves to shift the endocardial border externally and helps to define a clearer line to track, similarly to CMR methodology. In short-axis ventricular endocardial tracing all trabeculations and papillary muscles were included in the chamber cavity, again as in CMR data analysis. For deformed left ventricles, especially losing their ellipsoid quality, the majority of manual tracing had to be performed in short-axis views at different levels crossing the long axis of the ventricle.
Right ventricle analysis
At the beginning of the analysis the right ventricular spatial orientation was built upon left ventricular markers (apex and mitral annulus level in four-chamber view). If those markers were not included in a pyramidal data set, as often happens in the case of significant right ventricular enlargement or malformation, the apex of the left ventricle was manually placed outside the acquisition area to include the whole chamber of the right ventricle in the analysis. Also, because no right ventricular outflow tract (RVOT) markers were present within the initial processing (only aortic annulus perimeters), its volume was usually understated by automatic tracing and needed to be extended manually. For enlarged ventricles the most accurate results were derived from manual short-axis views tracking at different levels, which is similar to the method of disks used in CMR analytical software.
Ethics
The study was approved by the Ethics Committee of the Medical University. In all cases written, informed consent was obtained from parents and from children above 16 years old.
Statistical analysis
A Bland-Altman analysis and linear regression were used to compare the results of left and right ventricular end-diastolic and end-systolic volumes assessed with 3D-ECHO against CMR acknowledged as the method of reference. Paired Student’s t-test (normal distribution of the data verified by Shapiro-Wilk test) and 95% confidence intervals were used for mean differences between left and right ventricular volumes for each imaging modality, again using CMR as a method of reference. A p-value of less than 0.05 was considered statistically significant [9].
The intra- and inter-observer variability of 3D-ECHO results were tested after 12 weeks by the original software user and a further reader analyzing a random selection of 25% of the cases. Correlation coefficients together with 95% confidence intervals and p-values were calculated to rate both inter- and intra-observer variability in measurements of RV volumes followed by Student’s t-test for paired samples (normal distribution of the data verified by Shapiro-Wilk test) to assess their agreement between two readings performed by the same and another software user. The same protocol was used for assessment of CMR results’ variability.
All calculations and graphs were made using R software version 3.3.1 (distributed under the terms of the GNU General Public License).
Results
In studied children a wide range of left and right ventricular volumes were observed. The values of left and right ventricular end-diastolic and end-systolic volumes derived from 3D-ECHO and CMR, including ranges, means, and standard deviations, are presented in Table II.
Table II
Results of left and right ventricular end-diastolic and end-systolic volumes in three-dimensional echocardiography (3D-ECHO) and cardiac magnetic resonance (CMR) – ranges and mean values with standard deviations
Left ventricular volumes
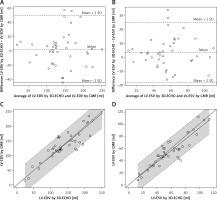
A Bland-Altman plot showed high consistency with narrow limits of agreement between the LV-EDV and LV-ESV obtained with 3D-ECHO and CMR (Figures 1 A and B). The correlation coefficient was high and significantly different from 0 (for LV-EDV r = 0.892, p < 0.00001 and for LV-ESV r = 0.896, p < 0.00001). The relation between the results derived from both methods was linear (for LV-EDV: estimated slope = 0.97, standard error = 0.025, p < 0.0001, R2 = 0.97, for LV-ESV: estimated slope = 0.94, standard error = 0.027, p < 0.0001, R2 = 0.97) and could be approximated by the identity function (Figures 1 C and D). The 95% confidence interval (CI) for the slope was 0.92–1.02 for LV-EDV and 0.88–0.99 for LV-ESV. In both cases, the slope was therefore not significantly different from the slope of the identity function equal to 1. Similarly, the intercept had a 95% CI of (–6.39; 36.64) for LV-EDV and (–6.08; 11.98) for LV-ESV, so the intercept was not significantly different from 0 in both cases.
Figure 1
Comparison of left ventricular volumetric results between three-dimensional echocardiography (3D-ECHO) and cardiac magnetic resonance (CMR). Bland-Altman plots for means and mean differences: LV-EDV (A) and LV-ESV (B). Identity function for: results of left ventricular end-diastolic volume (LV-EDV) (C) and left ventricular end-systolic volume (LV-ESV) (D). Regression of Y (CMR) on X (3D-ECHO), with prediction limits
Right ventricular volumes
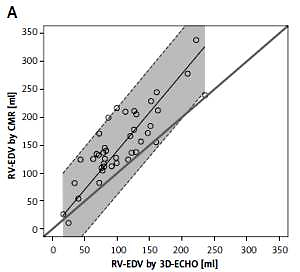
The correlation of 3D-ECHO results with CMR was still high (RV-EDV r = 0.848, p < 0.00001, RV-ESV r = 0.914, p < 0.00001), with a linear relation between the results derived from both methods (Figures 2 A and B). For RV-EDV the estimated slope was 1.38, standard error = 0.051, p < 0.0001, R2 = 0.95. For RV-ESV the estimated slope was 1.45, standard error = 0.048, p < 0.0001, R2 = 0.96. The 95% confidence interval (CI) for the slope was 1.28–1.47 for RV-EDV and 1.35–1.54 for RV-ESV. The slope was therefore significantly greater than 1. Similarly, the intercept had a 95% CI of (12.51; 63.83) for RV-EDV and was significantly greater than 0. For RV-ESV the 95% CI for the intercept was (–3.62; 18.35) and was not significantly different from 0. Moreover, from the clinical point of view, the limits of agreement on Bland-Altman plots were relatively wide and therefore did not allow us to conclude that the methods agree sufficiently (Figures 2 C and D). RV-EDV and RV-ESV measured in 3D-ECHO were significantly underestimated compared to CMR – by 38% in the case of RV-EDV and by 45% for RV-ESV (Table III) – for mean RV-EDV, respectively, 104.40 ±49.52 ml vs. 153.08 ±64.28 ml (p < 0.000001), for RV-ESV in 3D-ECHO 48.39 ±29.07 ml vs. 73.29 ±42.90 ml in CMR (p < 0.00001).
Figure 2
Comparison of right ventricular volumetric results between three-dimensional echocardiography (3D-ECHO) and cardiac magnetic resonance (CMR). Identity function for: results of right ventricular end-diastolic volume (RV-EDV) (A) and right ventricular end-systolic volume (RV-ESV) (B). Regression of Y (CMR) on X (3D-ECHO), with prediction limits. Bland-Altman plots for means and mean differences: RV-EDV (C) and RV-ESV (D)
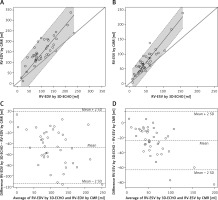
Table III
Comparison between right ventricular volumes derived from CMR and 3D-ECHO; both raw data and with modification by correction coefficients
[i] P-value < 0.05 was considered to indicate a statistically significant difference. CMR – cardiac magnetic resonance, 3D-ECHO – 3-dimensional echocardiography, RV-EDV – right ventricular end-diastolic volume, RV-ESV – right ventricular end-systolic volume, SD – standard deviation, CI – confidence interval, cc – correction coefficient.
Right ventricular volumes were also significantly lower than corresponding left ventricular volumes calculated in 3D-ECHO: mean RV-EDV of 104.40 ±49.52 ml vs. LV-EDV of 138.50 ±52.08 ml (mean difference of 35.10 ±30.93 ml, p < 0.00001) and for RV-ESV and LV-ESV 48.39 ±29.07 ml vs. 57.53 ±24.18 ml, respectively (mean difference of 9.14 ±23.20 ml, p = 0.013), while in the pool of CMR results for the same population the mean values of right ventricular volumes were in fact slightly higher than corresponding results for the left ventricle – for EDV: RV 153.08 ±64.28 ml vs. LV 138.10 ±51.46 ml with a mean difference of 11.68 ±40.18 ml (p = 0.074) and for ESV: RV 73.29 ±42.90 ml vs. LV 55.03 ±24.28 (p = 0.008).
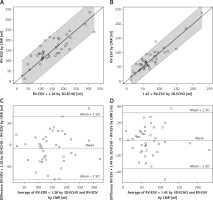
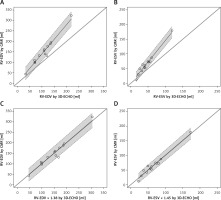
Correction of 3D-ECHO results using coefficients derived from linear regression slopes, 1.38 for RV-EDV and 1.45 for RV-ESV, significantly improved consistency of the results with those obtained with CMR: the mean difference between paired results of RV-EDV was reduced from –47.47 ±34.34 ml to –7.34 ±37.07 ml (p > 0.05) and for RV-ESV from –23.92 ±20.00 ml to –2.20 ±17.67 ml (p > 0.05). In both cases 3D-ECHO results modified by coefficients were not significantly different from corresponding CMR volumes (Figure 3).
Figure 3
Efficacy of correction coefficients calculated in the study for modification of right ventricular volumetric results in three-dimensional echocardiography (3D-ECHO). Identity function comparing modified 3D-ECHO results of right ventricular end-diastolic volume (RV-EDV) (A) and modified 3D-ECHO results of right ventricular end-systolic volume (RV-ESV) with cardiac magnetic resonance (CMR) (B). Regression of Y (CMR) on X (3D-ECHO), with prediction limits. Bland-Altman plots for means and mean differences: modified RV-EDV (C) and modified RV-ESV vs. CMR (D). Coefficients: 1.38 for RV-EDV and 1.45 for RV-ESV
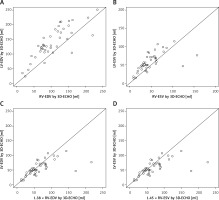
Furthermore, the use of estimated coefficients for RV-EDV and RV-ESV levelled the volumetric discrepancy between both ventricles (Table IV). The mean difference between left and right ventricular volumes (difference = RV volume – LV volume) was reduced: for end-diastolic volumes (EDV) to 5.58 ±39.63 ml (p = 0.362), which proved consistent with the proportion assessed for CMR results with a mean difference of 11.68 ±40.18 ml (p = 0.074). In both modalities mean RV-EDV was slightly higher than mean LV-EDV. For end-systolic volumes (ESV) the main difference between ventricles was reduced to 12.15 ±32.45 ml and was interpreted as significant (p = 0.018), which again proved the agreement with CMR with a corresponding mean difference of 14.91 ±33.91 ml, which was also statistically significant (p = 0.008). The linear regression function illustrating the discrepancy between left and right ventricular volumes in 3D-ECHO and improvement of the results by modification of RV volumes with developed coefficients is shown in Figure 4.
Table IV
Comparison between left and right ventricular volumes in end-diastole and end-systole for each modality, including use of 3D-ECHO correction coefficients
[i] P-value < 0.05 was considered to indicate a statistically significant difference. RV – right ventricle, LV – left ventricle, 3D-ECHO – 3-dimensional echocardiography, CMR – cardiac magnetic resonance, EDV – end-diastolic volume, ESV – end-systolic volume, SD – standard deviation, CI – confidence interval, cc – correction coefficient.
Figure 4
Interventricular discrepancy in three-dimensional echocardiography (3D-ECHO). Identity function illustrating volumetric discrepancy between left and right ventricle assessed by 3D-ECHO in end-diastole (A) and end-systole (B) paired with reduction of this disproportion by use of correction coefficients for: right ventricular end-diastolic volume (RV-EDV) (C) and right ventricular end-systolic volume (RV-ESV) (D). Coefficients: 1.38 for RVEDV and 1.45 for RV-ESV
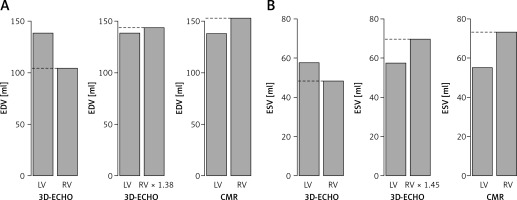
The proportions between left and right ventricular volumes and between imaging modalities including the use of 3D-ECHO coefficients for end-diastole and end-systole are presented in Figure 5.
Figure 5
Mean volumetric interventricular proportions. Bar plots illustrating mean volumetric proportions between left (yellow) and right (orange) ventricle in 3-dimensional echocardiography (3D-ECHO) before and after modifying right ventricular results with estimated coefficients and in cardiac magnetic resonance (CMR). Proportions for end-diastole (coefficient 1.38) (A) and end-systole (coefficient 1.45) (B)
We verified proposed correction coefficients outside the sample on which they were calculated. We tested them on a group of the next 13 consecutive children in whom CMR was performed due to clinical indications (5 girls, 8 boys; aged 9–17 years, mean 14 years old; 5 patients with arrhythmia, 3 with suspicion of myocarditis, 2 after tetralogy of Fallot repair and single patients with bicuspid aortic valve, pulmonary hypertension and hypertrophy of ventricular septum). In all the children CMR was followed by 3D-ECHO with RV volume analysis, again blinded to the results of CMR. We followed the protocol comparing RV volumes assessed in 3D-ECHO and CMR before and after applying correction coefficients and again we observed significant improvement in consistency of results between modalities, illustrated in Figure 6.
Figure 6
Efficacy of correction coefficients calculated in the study for modification of right ventricular volumetric results in three-dimensional echocardiography (3D-ECHO) tested on the group of children from outside the study population. Identity function illustrating discrepancy between right ventricular volumes assessed in 3D-ECHO and CMR in end-diastole (A) and end-systole (B) paired with reduction of this disproportion by use of correction coefficients for: right ventricular end-diastolic volume (RV-EDV) (C) and right ventricular end-systolic volume (RV-ESV) (D) Coefficients: 1.38 for RV-EDV and 1.45 for RV-ESV
The intra- and inter-observer variability of 3D-ECHO volumes was proved to be low, based on high correlation coefficients with narrow 95% confidence intervals and paired Student’s t-test. The results are presented in Tables V and VI.
Table V
Intra- and inter-observer variability for 3D-ECHO and CMR. Estimated correlation coefficients and 95% confidence intervals
Table VI
Intra- and inter-observer variability for 3D-ECHO and CMR. Student’s t-test for paired samples; mean differences between readings and p-values
Discussion
Accurate and regular assessment of ventricular volumes in children is crucial for diagnosis, risk stratification, predicting long-term outcome, and decision making in patients with heart defects, cardiomyopathies, and arrhythmias. Three-dimensional echocardiography (3D-ECHO) is already widely embraced in adult cardiology, and many studies have addressed its use in children [3, 4, 10–12]. However, although ventricular function assessment is highly praised in the literature, the accuracy of volumetric analysis inspires much less enthusiasm, especially in the paediatric population.
For our study population we gathered children representing a wide range of ventricular sizes and intraventricular proportions to meticulously check the potential usefulness of 3D-ECHO in volumetric assessment, choosing CMR as the method of reference for that purpose. Within the subgroup of arrhythmic patients the process of recording full-volume data sets was more difficult than in those with sinus rhythm. Nevertheless, we succeeded in every case. Furthermore, due to smaller body size, the visualization of the ventricles is easier in children than in adults, which helps to obtain lower intra- and inter-observer variability, as demonstrated in our and other studies [13–15]. In agreement with the goal of the study to prove the feasibility of the method for regular use in the wide population, we decided to adopt lax criteria for image quality, accepting for the analysis also suboptimal data, favouring in this case the strategy proposed by Crean et al. in their echocardiographic assessment of enlarged right ventricles in the adult population [13]. In our studied population of children we found high correlation and agreement between left ventricular volumes obtained in 3D-ECHO and CMR. Published studies either praise the consistency [14–18] or prove systematic underestimation of both left end-diastolic (LV-EDV) and end-systolic (LV-ESV) volumes by 3D-ECHO compared to CMR [8, 19–22]. This conclusion is also derived from both meta-analyses addressing the matter [19, 20]. According to Shimada et al., the underestimation of left ventricular volumes is at least partly corrected by use of matrix array transducers and semiautomatic tracking software for postprocessing, because the human eye tends to place the endocardial border at the line of milder contrast, closer to the centre of the ventricular cavity than would an automatic tracing algorithm [20]. In our study we had a matrix transducer at our disposal. As for the endocardial tracking process, we used semiautomatic software. Moreover, based on our experience, the results of 3D-ECHO analysis are further improved against CMR by working in high-contrast monitor settings and manual extraction of the left ventricular outflow tract in three-chamber view in the majority of patients. In 5 patients we were forced to analyse full-volume data obtained from two heart beats (instead of the standard four beats), which proved to be adequate for postprocessing, as already described in the literature [8].
The complicated morphology of the right ventricle successfully escapes any uniplanar imaging modality or geometric assumption, especially in the case of enlargement or deformation of the cavity. In our studied population the conditions of both left and right ventricular 3D data set acquisition were the same, within one echocardiogram, using the same probe, the same position, and the same apical window with only mild transducer readjustment for each ventricular focus. The postprocessing was also performed at the same time, by the same operator, with the same monitor settings, and using software from the same company. Nonetheless, right ventricular end-diastolic (RV-EDV) and end-systolic volume (RV-ESV), proved to be significantly underestimated by 3D-ECHO in comparison to CMR results. The mean value of underestimation was as high as 38% for RV-EDV and 45% for RV-ESV. Interestingly, the right ventricular volumes were also significantly lower than corresponding left ventricular volumes obtained in 3D-ECHO, even in patients with proportionate ventricles assessed by CMR. Additionally, the underestimation of EDV and ESV seemed to be proportional because the results still showed a high correlation (even if not agreement) with CMR. Finally, and most importantly, the right ventricular ejection fraction (RVEF) derived from assessed volumes (according to the formula: RVEF [%] = RV-EDV [ml] – RV-ESV [ml]/RV-EDV [ml] × 100%) retained excellent consistency with results of CMR.
Based on those observations, we used slope values obtained in regression analysis to calculate coefficients correcting 3D-ECHO-derived RV-EDV and RV-ESV, which improved their consistency with corresponding CMR results and reduced the discrepancy with left ventricular volumes assessed in 3D-ECHO. We were also able to preliminarily test those coefficients on an additional sample of children with promising results.
The tendency to underestimate right ventricular volumes by 3D-ECHO is widely mentioned in the literature, including the meta-analysis by Shimada et al. [23–26]. However, studies comparing 3D-ECHO with CMR in that aspect in children are again much less numerous [27–29]. In our experience, the larger the ventricle, the more of the whole analysis has to be performed in short-axis views and greater manual correction of semiautomatic tracing is needed, which is very similar to the disk summation technique universally used for CMR volume calculations. This approach has been voted as the most accurate by many authors; however, it still does not eliminate the right ventricular volumetric underestimation [24, 27, 28]. Furthermore, to our knowledge, no publication so far has proposed any solution for right ventricular volumetric underestimation in 3D-ECHO, as we have done in our study using mathematical assumptions, and being able to validate their correcting efficiency with CMR.
As previously mentioned, in our 3D-ECHO analysis we found right ventricular volumes to be significantly lower than corresponding left ventricular volumes, even in patients in whom they proved to be proportionate in CMR. To our knowledge only one paper has addressed this problem so far, and with results opposite to our study [30]. According to Seguela et al., right ventricular volumes assessed by 3D-ECHO proved to be greater in comparison to the left ventricle; however, the results were obtained only from healthy children and had not been validated by CMR as in our study. Also, yet again, no solution to this problem was proposed by the authors, contrary to our findings.
For our heterogeneous group we have made no attempt so far to test how much the grade of ventricular enlargement distorts 3D-ECHO results. Further studies are required to assess intermodality and interventricular volumetric correlation for patients differing in size, age, diagnosis, and severity of ventricular enlargement. At this point the value of correction coefficients proposed by our study to improve the accuracy of 3D-ECHO right ventricular volumetric results and their agreement with CMR has been tested on a sample of patients from outside the population on which the coefficients were calculated. The results are promising, although the problem certainly necessitates further study, which is planned for the near future. Also the assessment of the proposed coefficients’ accuracy in different populations of children is the subject of our further research.
In conclusion, three-dimensional echocardiography is a valuable tool for the assessment of left ventricular volume, which strongly correlates and agrees with cardiac magnetic resonance imaging.
The right ventricular volumes calculated in 3D-ECHO tend to be significantly underestimated in comparison to cardiac magnetic resonance and corresponding left ventricular volumes obtained from 3D-ECHO.
The use of coefficients developed by the study improves the consistency of right ventricular end-diastolic and end-systolic volume measured by 3D-echocardiography with results obtained by cardiac magnetic resonance and reduces the volumetric discrepancy between ventricles in 3D-ECHO.


