Introduction
Carotid atherosclerotic plaque (CAP), as a common disease, is a result of increased carotid artery intima media thickness due to fatty degeneration and cholesterol deposition in the arterial wall [1]. Commonly, carotid artery endarterectomy combined with medical therapy is the gold standard for CAP and CA stenosis treatment [2]. CAP is the occurrence of systemic atherosclerosis in the carotid artery, which can reflect the degree of systemic atherosclerosis. In general, the accumulating burden of CAP may induce the beginning of coronary artery disease, stroke, or cardiovascular disease [3, 4]. Reportedly, hypertension, diabetes, dyslipidemia, alcohol consumption, obesity, and smoking are the traditional independent risk factors for the progression of CAP [5]. In addition to the class risk factor, premature cardiovascular events are found to be related to increased atherosclerotic burden and carotid total plaque area, as well as CAP progression [6, 7]. Recently, the enhanced level of homocysteine, as a non-traditional factor of CAP development, has aroused greater attention. Homocysteine induced vascular endothelial injury and smooth muscle cell proliferation may promote the formation of atherosclerosis [8]. CAP can not only cause cerebral tissue ischemia, encephalatrophy, and blindness, but even induce disability and death of the patients. Thus, the elucidation of underlying molecular mechanisms and markers involved in CAP progression may have an important influence on early prevention of CAP.
Fibroblast growth factor 2 (FGF2), also named basic fibroblast growth factor (BFGF), has been reported to exhibit protective effects in early atherosclerosis [9]. The knockout of low molecular weight FGF2 may reduce atherogenesis and aortic plaques via reducing macrophage infiltration and suppressing oxidative stress in mice [10]. In addition, FGF2 is implicated in angiogenesis-dependent diseases via regulating angiogenic activity [11]. Reportedly, FGF2 overexpression is involved in CAP instability via engaging the nuclear factor-kappaB (NF-κB) pathway mediated inducible nitric oxide synthase (iNOS) and matrix metallopeptidase 9 (MMP-9) upregulation [12]. Also, CAP instability is associated with altered physiologic homeostasis influenced by MMP-2 and MMP-9 [13]. However, the role of FGF2 in CAP development is still incompletely understood.
In recent years, transcriptional expression profiling analysis has provided a useful technology for comprehensively and extensively investigating molecular pathologies of CAP progression [14]. In this study, we applied the expression data of the GSE43292 dataset which sequenced the mRNA expression profiles of 32 atheroma plaque (AP) and 32 paired distant macroscopically intact (DMI) tissues samples from 32 hypertensive patients who underwent carotid endarterectomy [15]. Following identification of differential expression genes (DEGs), the correlation of FGF2 and DEGs and their enriched pathways were analyzed. We hoped to identify the role of FGF2 in atherosclerosis and to anticipate its effects in human arteries.
Material and methods
Data source
The GSE43292 dataset downloaded from Gene Expression Omnibus (GEO) (http://www.ncbi.nlm.nih.gov/geo/) was used in this study, in which the mRNA expression profiles of 32 AP and 32 paired DMI tissues samples from 32 hypertensive patients who underwent carotid endarterectomy were applied and the raw gene expression matrix data of all samples were downloaded (Supplementary Table SI). The expression data were generated from the platform of GPL6244 [HuGene-1_0-st] Affymetrix Human Gene 1.0 ST Array [transcript (gene) version].
Data preprocessing and differential expression gene screening
Oligo software in R (version 1.34.0, http://bioconductor.org/help/search/index.html?q=oligo/) was used to conduct the background correction and normalization preprocessing of the raw CEL data [16]. The data preprocessing included the transformation of the original data format, filling the missing data and data normalization. Then, the probe IDs for corresponding genes were annotated, and the probe that did not match any given gene was removed. When multiple probes were mapped in the same gene symbol, the mean value of these multiple probes was considered as the expression value of this gene.
The gene expression matrix of AP and DMI samples was divided into CAP disease and control groups, respectively. Subsequently, the DEGs between the CAP disease and control groups were analyzed using the Bayes test in limma (Version 3.10.3, http://www.bioconductor.org/packages/2.9/bioc/html/limma.html) [17] under the thresholds of |log2 fold-change (FC)| > 1 and adjusted p-value < 0.05. Hierarchical clustering for DEGs was calculated based on the Euclidean distance method and drawn with the pheatmap package (version 1.0.10, https://cran.r-project.org/web/packages/pheatmap/index.html) in R software.
Gene set enrichment analysis
Gene set enrichment analysis (GSEA) (http://software.broadinstitute.org/gsea/index.jsp) [18] is a useful method for interpreting groups of genes that share common biological function, chromosomal location, or regulation. In this study, GSEA V3.0 (http://software.broadinstitute.org/gsea/index.jsp) was utilized to perform the FGF2 relative GSEA Kyoto Encyclopedia of Genes and Genomes (KEGG) pathway analysis. At first, the KEGG pathways gene set provided in the molecular signatures database (MSigDB) was used as the enrichment background (c2.cp.kegg.v6.1.symbol.gmt, Supplementary Table SII). The FGF2 expression value was used as the phenotype when setting the parameter of Phenotype labels. The gene expression matrices of all DEGs were inputted in GSEA V3.0 and were listed based on log2FC values. Then, Pearson’s correlation coefficient between any gene and FGF2 was calculated following setting the parameter of “Metric for ranking genes” as “Pearson”. Finally, according to Pearson’s correlation coefficient, the gene list was sorted in descending order mode and NOM p-value < 0.05 was the threshold of significant enrichment results.
Coexpression analysis and functional enrichment analysis
The matrix data of all DEGs and FGF2 were utilized to calculate the Pearson correlation coefficient between any DEG and FGF2. Then, the significant coexpression pairs of FGF2-DEGs were screened with the cutoff of correlation coefficient |r| > 0.8 and p-value < 0.05.
KEGG is an integrated database, which interprets the biological function of genomes by KEGG pathway mapping [19]. The Gene Ontology (GO) project is an important bioinformatics resource to analyze gene functional annotation classified into three categories [20]. In this study, based on above selected FGF2-DEGs pairs, the clusterprofiler package [21] in R software (Version 2.4.3, http://bioconductor.org/packages/3.2/bioc/html/clusterProfiler.html) was applied to conduct the KEGG pathway and GO-biological process (BP) enrichment analyses for the DEGs that showed a significant negative or positive correlation with FGF2. Significant enrichment results were obtained with the cutoff of count > 2 and p-value < 0.05.
Construction of protein-protein interaction network
Search Tool for the Retrieval of Interacting Genes/Proteins (STRING, http://string-db.org/) is a database providing the protein partnerships in more than 2000 organisms [22]. STRING (version 10.0) was utilized to explore the protein-protein interaction (PPI) pairs for all genes in above selected FGF2-DEG coexpression pairs while setting the PPI score as 0.15. After obtaining the PPI pairs, the PPI network was constructed by Cytoscape software (version 3.2.0, http://www.cytoscape.org/) [23]. Then, topological properties of network nodes were analyzed, and the genes with higher degree values were considered as hub genes.
Long noncoding RNA (lncRNA)-microRNA (miRNA)-FGF2 regulatory network construction
The Gene-miRNA Targets function of the predicted Target Module provided by the miRWalk2.0 (http://zmf.umm.uni-heidelberg.de/apps/zmf/mirwalk2/) [24] tool was used to predict the upstream miRNAs of FGF2, and species was selected as Human. Subsequently, the regulatory pairs appearing in at least 6 databases of miRWalk, miRanda, miRDB, miRMap, Pictar2, RNA22, and TargetScan were chosen. LncBase Predicted v.2 [25] (http://carolina.imis.athena-innovation.gr/diana_tools/web/index.php?r=lncbasev2%2Findex-predicted) was applied to predict relative lncRNAs for miRNA in above-obtained miRNA-FGF2 pairs, and the lncRNA-miRNA regulatory pairs conforming to tissue = blood vessel and Threshold = 1 were screened. Further, the regulatory pairs of lncRNA-miRNA and miRNA-FGF2 were integrated to construct the lncRNA-miRNA-FGF2 regulatory network by Cytoscape software.
Results
Statistical information of differential expression gene screening
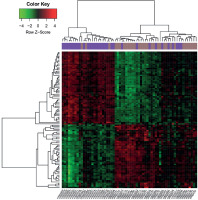
Based on the pre-set threshold, a total of 101 DEGs (e.g., MMP7 and MMP9) between AP and DMI samples were identified, including 47 up-regulated and 54 down-regulated DEGs. The heatmaps demonstrated that these DEGs could basically divide the samples into CAP disease and control groups (Figure 1).
Figure 1
Heat maps of differentially expressed genes (DEGs) identified from atheroma plaque and paired distant macroscopically intact samples. X-axis indicates the names of samples, and Y-axis indicates the DEGs. The distant macroscopically intact samples are shown in purple, and the atheroma plaque samples are shown in brown. The color from green to red represents the expression values of DEGs from low to high
Results of gene set enrichment analysis
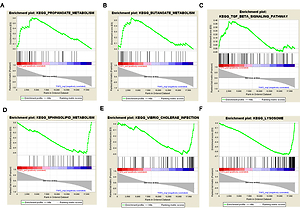
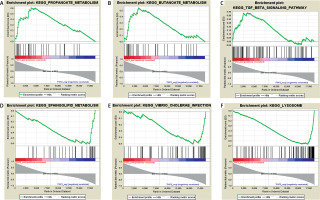
Based on the threshold value of NOM p-value < 0.05, only three FGF2 positively related pathways were enriched: “propanoate-metabolism”, “butanoate-metabolism” and “TGF-β signaling pathway”. In addition, a total of thirty FGF2 negatively related pathways were enriched, among which the top 3 significant pathways were “sphingolipid-metabolism”, “vibrio cholerae infection” and “lysosome” (Figure 2).
Figure 2
Results of gene set enrichment analysis (GSEA). A–C present the top three FGF2 positively relative pathways, while D–F present the top three FGF2 negatively relative pathways. There are three parts in each GSEA pathway figure. The first part is the line chart of enrichment score (ES). X-axis represents the enriched genes in this pathway, and Y-axis represents the running ES. The second part is hit, in which lines are used to mark the genes in the gene sets. The third part is the rank value distribution of genes. X-axis represents the rank values, while Y-axis represents the ranked list metric scores
Coexpression analysis
Under the threshold of |r| > 0.8 and p < 0.05, a total of 31 FGF2-DEGs coexpression pairs were searched, among which expression of 23 DEGs was positively correlated with FGF2, while expression of 8 DEGs was negatively correlated with FGF2 (Table I). Additionally, among these 31 coexpression pairs, the positively correlated DEGs (e.g., solute carrier family 2 member 12 (SLC2A12), melanocortin 2 receptor accessory protein 2 (MRAP2) and stimulator of chondrogenesis 1 (SCRG1)), as well as negatively correlated DEGs (e.g., Vav guanine nucleotide exchange factor 3 (VAV3), integrin subunit alpha X [ITGAX] and pleckstrin (PLEK)) had higher |r| values than others (Table I).
Table I
Results of 31 FGF2-DEG coexpression pairs
[i] Notes: The DEGs in coexpression pairs with correlation coefficient r > 0.8 and p-value < 0.05 are considered to be positively correlated with FGF2, while being negatively correlated with FGF2 in pairs with correlation coefficient r < –0.8 and p-value < 0.05. DEGs – differentially expressed genes.
Functional enrichment analysis
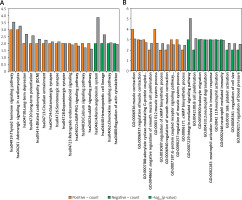
The enrichment analysis results revealed that the DEGs positively correlated with FGF2 were significantly enriched in 13 KEGG pathways, in which most DEGs were enriched in the pathways of “Thyroid hormone signaling pathway”, and “Adrenergic signaling in cardiomyocytes”, whereas the DEGs negatively correlated with FGF2 were only enriched in 4 KEGG pathways, among which the renin-angiotensin system was most significant (Figure 3 A). In addition, the DEGs positively correlated with FGF2 were closely associated with “negative regulation of smooth muscle cell proliferation” (e.g., natriuretic peptide receptor 3 (NPR3)) and “regulation of smooth muscle contraction” (e.g., natriuretic peptide receptor 3 (NPNT) and calponin 1 (CNN1)), whereas the DEGs negatively correlated with FGF2 were involved in the function of “integrin-mediated signaling pathway” and “platelet activation” (e.g., VAV3) (Figure 3 B).
Figure 3
Functional enrichment results of FGF2 significantly correlated DEGs. A – KEGG enrichment results of FGF2 positively correlated and negatively correlated DEGs. B – The top 10 enriched GO-biological process terms of FGF2 positively correlated and negatively correlated DEGs. The FGF2 positively correlated pathways are marked in orange, while FGF2 negatively correlated pathways are marked in green. X-axis shows the names of enriched pathways, while Y-axis represents the count of genes and –log10(p-value) of corresponding pathway
Protein-protein interaction network analysis
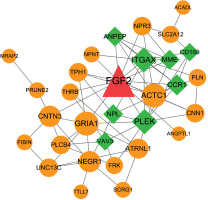
All genes in the significant FGF2-DEG coexpression pairs were used to construct the PPI network. As result, the constructed PPI network was consisted by 31 nodes and 69 interactions, in which the nodes such as FGF2, ITGAX, PLEK, ACTC1 and GRIA1 had higher degree values than other nodes (Figure 4, Table II).
Table II
Top 10 genes in PPI network listed by degree value
| Nodes | Description | Degree |
|---|---|---|
| FGF2 | Center | 14 |
| ITGAX | Negative | 9 |
| PLEK | Negative | 9 |
| ACTC1 | Positive | 8 |
| GRIA1 | Positive | 8 |
| NEGR1 | Positive | 6 |
| CNTN3 | Positive | 6 |
| CCR1 | Negative | 6 |
| MME | Negative | 5 |
| ANPEP | Negative | 5 |
| ATRNL1 | Positive | 5 |
Figure 4
Protein-protein interaction (PPI) network consisted by FGF2 significantly correlated DEGs. The circles in orange stand for FGF2 positively correlated genes, while squares in green stand for FGF2 negatively correlated genes. Node shows the name of gene and edge represents the interaction between any two connected nodes. The node size is proportionable to its degree value. DEGs: differentially expressed genes
lncRNA-miRNA-FGF2 regulatory network
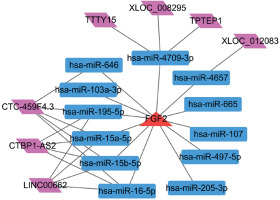
Using the miRWalk2.0 database, a set of 12 miRNAs that regulated FGF2 were predicted. In addition, 7 lncRNAs having relationships with these 12 miRNAs were predicted. Finally, the lncRNA-miRNA-FGF2 regulatory network comprised 12 miRNAs, 7 lncRNAs, 12 miRNAs-FGF2 relationship pairs and 17 lncRNA-miRNA relationship pairs (Figure 5). The nodes such as CTC-459F4.3, hsa-miR-15a-5p, hsa-miR-15b-5p and hsa-miR-16-5p were highlighted in this network.
Discussion
In this study, a total of 101 DEGs between AP and DMI samples were identified, among which 23 FGF2 positively correlated and 8 negatively correlated DEGs were searched. VAV3 had the lowest r value among 8 FGF2 negatively correlated DEGs. FGF2 positively correlated DEGs were closely involved in the “regulation of smooth muscle contraction” (e.g., CNN1), while FGF2 negatively correlated DEGs were significantly associated with “platelet activation” (e.g., VAV3). In addition, a set of 12 miRNAs that regulated FGF2 were predicted, and hsa-miR-15a-5p and hsa-miR-16-5p were highlighted in the lncRNA-miRNA-FGF2 regulatory network.
Abnormal contraction of vascular smooth muscle is a crucial cause of hypertension and vascular disease such as coronary artery vasospasm [26]. Similarly, aortic calcification as an independent predictor of atherosclerosis is commonly promoted, while accompanied by reduced contractility of aortic smooth muscle cells [27]. Perisic Matic et al. identified smooth muscle contraction as one of most down-regulated pathways for carotid plaques compared with healthy arteries [28]. Similarly, CNN1 was found to be one of the FGF2 positively correlated DEGs between AP and DMI samples, and was enriched in the GO term “regulation of smooth muscle contraction”. CNN1 as an actin filament-associated protein has a pivotal role in the regulation and modulation of smooth muscle contractility [29]. Reportedly, platelet deposition is a potent stimulus for local smooth muscle constriction [30]. Also, it shows that Auricularia auricula can suppress the phenotypic conversion of vascular smooth muscle cells from contracted type to synthesized type via inhibiting the secretion of bFGF, PDGF and other extracellular matrixes, which may reduce the formation of atherogenesis [31]. Moreover, although little is known about FGF2 regulating smooth muscle contraction for CAP, it has been proposed that FGF2 can suppress α-smooth muscle actin expression, resulting in reduced contractile activity [32]. Considering the evidence together, CNN1 might cooperate with FGF2 to regulate the smooth muscle contractility during CAP formation.
Atherosclerosis is a chronic inflammatory disease, in which macrophage accumulation in atherosclerotic arteries is responsible for the development and progression of atherosclerotic plaque [33, 34]. Platelets are important inflammatory mediators, and the platelet activation by inflammatory triggers as a critical component of atherothrombosis may contribute to the development and progression of atherosclerotic plaques [35]. VAV3, which encodes a kind of Rho family of GTPases, is responsible for vascular smooth muscle cell proliferation and migration [36]. In addition, VAV3 plays a role in regulating platelet activation mediated by collagen [37]. Similarly, we predicted that VAV3 was involved in function of platelet activation and it was most negatively significant correlated with FGF2. Interesting, Hayon et al. reported that platelet-derived microparticles shed from platelets upon activation participate in angiogenesis or neural stem cell proliferation mediated by FGF2, VEGF, or PDGF [38, 39], which indicates that FGF2 is involved in the downstream effect of platelet activation. Thus, our findings demonstrated that VAV3 might cooperate with FGF2 to be responsible for the development of CAP through participating in platelet activation.
miRNAs such as hsa-miR-15a-5p and hsa-miR-16-5p were predicted to be upstream regulator factors of FGF2, which were highlighted in the lncRNA-miRNA-FGF2 regulatory network. miR-16 has been recently revealed to inhibit nasopharyngeal carcinoma carcinogenesis and progression via regulating its target FGF2 [40]. Hsa-miR-16 is elevated in atherosclerotic plaques compared to healthy arteries [41]. Additionally, miR-16 is found to be enriched in mesenchymal stem cell derived exosomes and exerts an anti-angiogenic effect [42]. miR-15a was reported to exhibit anti-proliferative and anti-angiogenic actions in endothelial and vascular smooth muscle cells [43]. Notably, FGF2 is a factor driving smooth muscle cell proliferation in injured rat carotid arteries [44]. In addition, miR-15a can directly target FGF2 and VEGF to facilitate their anti-angiogenic effects in hindlimb ischemia [45]. However, there have been few reports about the regulatory mechanism of miR-16 and miR-15a on FGF2 suppression in the formation of CAP. Therefore, these results demonstrated that hsa-miR-15a-5p and hsa-miR-16-5p might facilitate their anti-proliferative or anti-angiogenic effects to participate in the development of CAP via regulating FGF2.
Although the deleterious roles of FGF2 in the development of atherosclerosis or carotid atherosclerotic plaques have been partially investigated in previous studies [12, 46], its underlying mechanisms in pathogenesis of carotid atherosclerotic plaques related to multiple genes are still largely unknown. The upstream regulators and co-expressed genes of FGF2 that both impact FGF2, which eventually contribute to progression of carotid atherosclerotic plaques, have still not been systematically and comprehensively studied. Transcriptional expression sequencing is a powerful and reliable technology for present and future research at the molecular level, which can reveal the transcript levels at the whole transcriptome. Thus, in this study, the alterations of mRNA expression levels across CAP and normal samples were systematically investigated, and upstream regulators or co-expressed DEGs of FGF2 were predicted by bioinformatics methods. Our findings may help to reveal the molecular foundation of FGF2 in atherosclerosis and provide potential targets for atherosclerosis treatment. However, the limitations of our study are worth mentioning. Firstly, the relationships of predicted upstream miRNAs and co-expressed DEGs with FGF2 were not validated by dual luciferase reporter assay and co-immunoprecipitation experiments, and the DEG levels were not detected in CAP and normal samples by WB experiments. Secondly, the functional roles of FGF2 and its upstream miRNAs and co-expressed DEGs that participated in predicted signal pathways were not deeply investigated by experiments. These aspects should be validated in future by our subsequent experiments.
In conclusion, CNN1 might cooperate with FGF2 to regulate the smooth muscle contractility during CAP formation. VAV3 might cooperate with FGF2 to be responsible for the development of CAP through participating in platelet activation. Hsa-miR-15a-5p and hsa-miR-16-5p might facilitate their anti-proliferative or anti-angiogenic effects to participate in the development of CAP via regulating FGF2.


