Introduction
Osteoarthritis is among the most common degenerative musculoskeletal conditions, with a significant worldwide socioeconomic impact attributed to the limited regeneration ability of articular cartilage [1, 2]. The number of years lived with disability due to knee osteoarthritis surged dramatically by roughly 30.8% between 2007 and 2017 [3]. In 2015, the prevalence of osteoarthritis in individuals aged 45–54 years increased gradually, reaching 15% in individuals aged 85 years and older [4]. However, currently available treatments, including surgical intervention, possess side effects such as invasive nature, high cost, and potential complications [5, 6], whereas pharmacological treatments suffer from gastrointestinal and cardiovascular toxicity [7, 8], which makes these treatments below expectations. Dental pulp stem cells (DPSCs) have shown promising outcomes in the treatment of several degenerative diseases, especially osteoarthritis [9–13]. DPSCs possess excellent cellular therapy and regenerative medicine applications due to their convenient, minimally invasive, and safe harvesting methods [12, 14, 15]. Interestingly, dental pulp offers an abundant source of stem cells that are commonly used in tissue engineering applications. Human DPSCs showed differentiation capacity: chondrogenic, angiogenic, osteogenic, adipogenic and dentinogenic. Moreover, DPSCs have high proliferation rates, and dental pulp tissue is among the most accessible sources. Collectively, these features make dental pulp tissue an attractive source for tissue regeneration applications [9, 16]. However, recent advances in regenerative medicine support the use of stem cell exosomes instead of stem cells due to their ability to offer therapeutic effects while avoiding stem cell implantation complications [17]. DPSCs derived exosomes are becoming a popular tool for regenerative medicine applications; they proved more effective than the exosomes of bone marrow derived MSCs in terms of reducing the levels of pro-inflammatory factors such as TNF-α and IL-17, increasing the level of anti-inflammatory agents such as TGF-β, and promoting CD4+T cells’ polarization into regulatory T cells [18].
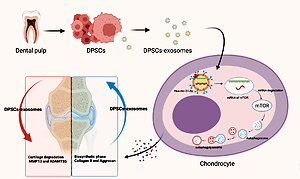
Wu et al. reported that exosomes can inhibit the mTOR signaling pathway, subsequently preventing cartilage damage and protecting mice from osteoarthritis by enhancing autophagy activity [19]. On the other hand, miRNAs exhibited a considerable potential for controlling gene expression in the last decade of research. MiR-31 plays a role as a negative mediator of apoptosis and calcification, showed an ability to enhance the viability of chondrocytes by targeting CXCL12, and enhances diabetic wound healing by promoting fibrogenesis, angiogenesis, and reepithelization [20–22]. Thus, the role of miR-31 in the regeneration of joint cartilage in an OA animal model is worthy of investigation.
Autophagy plays a protective role in regulating cartilage hemostasis, and loss of this protective role leads to accelerated osteoarthritis [23, 24]. mTOR is a key negative regulator of autophagy. mTOR signaling promotes cartilage degradation, whereas inhibition of mTOR alleviates the severity of osteoarthritis in vivo [25, 26].
Herein, we propose that miR-31 could inhibit mTOR by targeting the 3′-untranslated region (3′UTR) of mTOR. Thus, miR-31 was overexpressed in dental pulp mesenchymal stem cells, and exosomes were collected to investigate its mechanism of action.
Material and methods
A randomized controlled animal experiment was conducted on 9-week-old male C57BL/6 mice obtained from Charles River Laboratories. The study protocol was designed and performed according to university guidelines for the use and care of laboratory animals. The Huashan Hospital, Fudan University Institutional Animal Care Center, and the Biosafety Committee approved the experimental protocol.
Isolation and culture of DP-MSCs
Dental pulp tissue was obtained from a six-year-old male child’s exfoliated deciduous teeth after obtaining signed informed consent from his parents. The tooth was first rinsed using phosphate-buffered saline (PBS) and then incubated in L-15 (Leibovitz) medium with 2.5 μg/ml of amphotericin B (Biochrom), 2.5 μg/ml streptomycin (Biochrom), and 200 units/ml of penicillin (Biochrom) at 37°C for 1 h. After enzymatic digestion, the suspension was diluted using PBS. The sample was then centrifuged at 250 g for 5 min. Next, the supernatant was discarded, and the cells were resuspended in low-glucose (LG) (1000 mg/ml) Dulbecco’s modified Eagle’s medium (Biochrom) supplemented with glutamine, 10% fetal bovine serum (FBS) (Biochrom), and antibiotics. Cultures were then incubated in humidified air with 5% CO2 at 37°C. The medium was replaced with a serum-free medium after the first passage (P1).
Isolation and identification of exosomes
The separation and purification processes were performed using differential centrifugation at 4°C. The supernatant fluids were collected and sequentially centrifuged at an increasing centrifugal force (300 × g for 10 min, 2000 × g for 10 min, and 20, 000 × g for 30 min). Next, the resulting supernatant was ultra-centrifuged for 70 min at 100,000 × g using a Sorvall LYNX 6000 Superspeed Centrifuge with T29-8x50 rotor in sealed-cap centrifuge tubes. Next, the pellets were rinsed using 40 ml of PBS and re-ultracentrifuged for 70 min at 100,000 × g. The samples were then resuspended in PBS and stored at –70°C. The exosomes were labeled with the green fluorescent lipophilic dye Vybrant-DiO (Invitrogen, USA). The detection of the fluorescent signal was performed using ImageStreamX. The particle size distribution and concentration were measured using a NanoSight LM10 unit. Moreover, the surface markers of exosomes, including CD9, CD63, and CD81, were examined by western blotting.
Model preparation
The mice were anesthetized using isoflurane (RWD Life Science, Shenzhen, Guangdong, China) through inhalation. A concentration of 2–3% isoflurane was used to induce anesthesia, while 1.5–2% isoflurane was used to maintain anesthesia.
All the mice experienced destabilization of the medial meniscus (DMM) or sham surgery. The osteoarthritis model was prepared via the technique of right knee DMM, as described by Glasson et al. [27]. On the other hand, the sham included an incision of the skin and muscles.
Intra-articular injection
This experimental study is divided into two parts. In the first part, all mice experienced DMM or sham surgery. The mice were randomly distributed into one of the following groups: (1) the PBS group which only received an intra-articular injection of PBS; (2) the PBS-Exo group which received intra-articular injection of the prepared exosome suspended in PBS; and (3) the sham-surgery group.
The experimental group animals received repeated intra-articular injections of either 10 μl of exosomes (1010 vesicles/ml) or 10 μl of PBS twice a week for 4 or 6 weeks. The intra-articular injections were performed using a microsyringe 30 gauge metal needle (Hamilton).
Meanwhile, all the animals in the second experiment that underwent DMM were randomly allocated to one of the following groups: (1) 10 μl of PBS with miR-antagomir negative control group, (2) PBS with exosome + miR-antagomir negative control group, and (3) PBS with exosome + miR-31 antagomir group.
The intra-articular injections were performed twice a week for 4 or 6 weeks using a micro syringe 30 gauge metal needle (Hamilton). The miR-antagomir negative control or miR-31 antagomir was treated for 3 weeks before the experiment (once weekly) and for 1 dose after 1 week of surgery.
Histopathological analysis
The mice’s knee joints were isolated after the animals were sacrificed. The isolated tissues were then fixed using 10% neutral buffered formalin solution (Sangon Biotech, Shanghai, China) for 3 days. The tissues then underwent a decalcification process using EDTA (12.5%) for 2 weeks. Next, the decalcified tissues were embedded in paraffin and cut into sections along the longitudinal axis of the femur and tibial bones at a thickness of 5 μm using a manual tissue chopper. The sections were stained with hematoxylin and eosin (HE) and Safranin O/Fast Green staining. For the sections with Safranin O/Fast Green staining, the procedure included deparaffinization of the sections, then Safranin O staining was applied for 5 min, and finally, Fast Green staining was applied for 5 min. For HE staining, the procedure included deparaffinized of the paraffin embedded sections and then the sections were stained with hematoxylin solution for 10 min followed by staining with eosin solution for 1 min. All staining steps were performed at room temperature.
The histopathological assessment of the medial femoral condyle and medial tibial plateau cartilage was histopathologically assessed using the 0–6 point Osteoarthritis Research Society International (OARSI) recommended grading system. Each tissue section was scored as follows: Grade 0 refers to normal cartilage. Grade 0.5 refers to the absence of structural changes, but there are cellular changes or loss of Safranin-O staining. In grade 1, no cartilage loss is presented, but there are small fibrillations. In grade 2, there is partial damage to the surface lamina and the presence of vertical clefts, which reach to the layer directly under the superficial layer. Grades 3 to 6 refer to the presence of vertical clefts/calcified cartilage erosion, which have spread to < 25%, 25–50%, 50–75%, or > 75% of the articular cartilage surface area, respectively. The degree of cartilage defect was presented as a maximum and total score (the sum of the four highest scores throughout all sections). The scores of all locations and sections were measured and averaged. Three investigators performed the evaluation in a blinded manner, and the average score of the three values was used for the statistical analysis.
Immunohistochemical staining
Immunohistochemistry staining was done using the SP-9000 Histostain-plus kit (Thermo Fisher) as per the manufacturer’s recommendation. Tissue sections were incubated at 4°C overnight with the following antibodies: anti-collagen type II (1 : 100, Proteintech), anti-LC3B (1 : 100, Proteintech), anti-mTOR (1 : 200, Abcam), anti-MMP13 (1 : 200, Proteintech), anti-P62 (1 : 100, Proteintech), and anti-ADAMTS5 (1 : 100, Abcam). The tissue sections were then incubated with proper biotin-labeled secondary antibody and streptavidin-biotin/horseradish peroxidase. Detection of immunoreactivity was performed using a 3,3′-diaminobenzidine tetrahydrochloride kit (3,3-DAB), then methyl green was used for counterstaining. Histomorphometric features of the tibial plateau were analyzed by counting the number of positively stained chondrocytes in three central regions of the cartilage. Image Pro Plus software (Ver. 5.1, Media Cybernetics, USA) was used to count the number of chondrocytes. Then, the percentage of positively stained chondrocytes and the relative fold change were calculated.
Western blot analysis
Proteins were collected and lysed in a radioimmunoprecipitation assay (RIPA; Beyotime, China). The BCA protein assay kit (Beyotime, Jiangsu, China) was used to measure the protein concentration. Western blot analysis was performed according to the method of Chen et al. [28]. The used antibodies included anti-p62/SQSTM1(Proteintech), anti-MAP1LC3 (Proteintech), anti-β-actin (Sigma), in addition to phospho-p70S6K, anti-phospho-mTOR, anti-mTOR p-S6, and p-4EBP1, which were obtained from Cell Signaling Technology. The analysis of grayscale values was used to quantify the western blotting results using the National Institutes of Health ImageJ software (US National Institutes of Health, Bethesda, Maryland, USA).
Quantitative RT-PCR analysis
To detect the mRNA, the preparation protocol included cells lysing and extracting the total RNA via using TRIzol reagent (Invitrogen). PrimeScript RT reagent kit (TaKaRa, China) and gDNA Eraser (TAKARA, Beijing, China) were used to generate complementary DNA templates. The Stratagene Mx3000P system was used to perform the RT-PCR using the SYBR Premix Ex Taq-II kit (Takara) as per the manufacturer’s instructions. On the other hand, the miRNA Isolation Kit (BioFlux) was used to isolate the miRNA, and the miRNA First-Strand cDNA Synthesis Kit was used to perform the RT-PCR (All-in-One, GeneCopoeia). Moreover, to evaluate the mRNA expression, GAPDH was used as an internal reference gene, whereas U6 was used as an internal reference gene for evaluating of miRNA expression. Analyzing the relative expression level of miRNAs was performed using the 2-ΔΔCT method. The primer information is listed in Table I.
Table I
Primers of qPCR analysis for the genes with differential expression
Apoptosis analysis
Using propidium iodide (PI) in conjunction with Annexin V is a widely common flow cytometry-based method to study apoptosis. Herein we followed the protocol of a previously published study by Crowley et al. [29]. Briefly, Annexin V-FITC and PI were applied for 15 min to label the cells using an FITC Annexin V BD Pharmingen FITC Annexin-V apoptosis-detection kit. The evaluation was performed using a Navios Flow cytometer within 30 min of the labeling procedure. The procedure was performed three times and FlowJo Ver.11 software (FlowJo, Ashland, USA) was used to analyze the data.
Dual-luciferase reporter assay
A luciferase reporter assay kit (Promega) was used, according to the method described by Wu et al. [30]. SW1353 chondrocyte-like cells were used as a cellular model of osteoarthritis. SW1353 cells were transfected with reporter plasmids and RNA oligonucleotides. DPSC-exosomes were used to treat SW1353 chondrocyte-like cells. After 48 h, the activity of luciferase was analyzed using the Dual-Glo Luciferase System (E1910, Promega, United States) as per the manufacturer’s recommendations.
DNA quantification and glycosaminoglycan quantification
Hoechst dye was used to quantify the DNA. The digested pellet was combined with Hoechst dye solution. The fluorescence of the samples was scanned at 340 nm excitation wavelength and 465 nm emission wavelength. Calf thymus DNA was used to generate the standard curve.
Dimethyl methylene blue (DMMB) assay was used to quantify the glycosaminoglycan (GAG) content in the IL-1β-treated chondrocytes. 20 μl of the digested pellets were added to 30 μl of water and 250 μl of DMMB dye solution. The absorbance of the samples was read at the 525 nm wavelength. Chondroitin sulfate from shark cartilage (Seikagaku, Tokyo, Japan) was used to generate the standard curve. The amount of DNA measured for each sample represents the GAG values.
Statistical analysis
The experiment was performed in triplicate. All data are presented as mean ± standard deviation (SD). Statistical analyses were performed using Prism software (PRISM 9.0, GraphPad Software, Inc.). Comparisons between the two groups were analyzed using an independent sample t-test. Comparisons between several groups were performed using ANOVA followed by Bonferroni correction. The level of statistical significance was set to p < 0.05.
Results
Isolation and characterization of DPSCs and DPSC-exosomes
Dental pulp stem cells were obtained from the dental pulp tissue of extracted molar teeth without periodontal disease, caries, or infections. DPSCs were essentially similar to MSCs which were harvested from the stromal compartment of different tissues such as adipose and bone-marrow MSCs. DPSCs presented a typical spindle-shaped morphology upon observation under an optical microscope (Figure 1 A). DPSCs were in accordance with the multipotent MSCs’ criteria of the International Society for Cellular Therapy Guidelines [31]. Moreover, as shown through the flow cytometric assay, cells showed positive staining signals for MSC-associated markers including CD105, CD73 and CD90.
Figure 1
Isolation and identification of DPSCs. A – DPSCs morphology under the optical microscope showed a spindle-like morphology. Scale bar: 100 μm. B – Western blotting of DPSCs and DPSC-exosomes surface markers. C – Relative grayscale values obtained from western blotting. D – Proportion of miRNAs in total miRNA reads
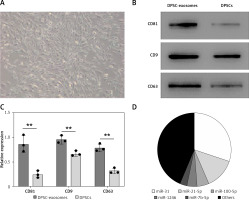
To isolate exosomes, polyethylene glycol-precipitation and ultrafiltration techniques were used. Upon using the transmission electron microscope, the majority of the isolated vesicles were observed as sphere-shaped vesicles (their diameter is roughly 100 nm) with a bilayer, which is the same described morphology of exosomes [32]. The results obtained from Nanosight analysis revealed that the majority of vesicles measured 30–150 nm in diameter. Furthermore, CD9, CD63, and CD81 markers in the isolated exosome solution showed significantly positive expression in the western blot assay (Figures 1 B, C).
Moreover, the previously conducted studies detected the following contents [33, 34]: macrophage colony-stimulating factor (M-CSF), monocyte chemotactic protein-1 (MCP-1), interleukin 1 receptor antagonist (IL-1ra), and stromal cell-derived factor 1-alpha (SDF-1a), in addition to angiogenic factors such as vascular endothelial growth factor (VEGF), hepatocyte growth factor (HGF), and basic fibroblast growth factor (b-FGF). Furthermore, the miRNAs detected in the DPSC-derived exosomes were miR-22, miR-27a, miR-30b-5p, miR-324-5p, miR-130a-3p, miR-34a-5p, miR-378f, miR-513b-5p, miR-193a-5p, miR-5100, miR-4792, miR-652-3p miR-505-3p, miR-27a-5p miR-629-5p, miR-1260b, miR-140-3p, miR-1260a, miR-185-5p, miR-1260a miR-146b-5p, miR-1260a, miR-339-5p, miR-1260b, miR-1246, miR-1260b, miR-107, miR-370-3p miR-320d, miR-210-3p miR-451a, miR-10a-5p, miR-215-5p, miR-1-3p, miR-126-3p, miR-10b-5p, miR-3687, miR-619-5p , and miR-31-5p, miR-5100, miR-652-3p, miR-1260b, miR-370-3p, miR-505-3p, miR-185-5p, miR-107, miR-451a, miR-31-5p, miR-1246, miR-27a-5p, miR-210-3p, miR-320d, miR-1260a, miR-339-5p, let-7f-1-3p, miR-146b-5p, miR-193a-5p, miR-1-3p, miR-140-3p, miR-4792, miR-215-5p, miR-629-5p, miR-619-5p, miR-126-3p, miR-10b-5p, miR-3687, and miR-10a-5p.
Beside the abovementioned miRNAs, the RT-PCR test showed that the four most abundant miRNAs in DPSC-exosomes were miR-31, miR-21-5p, miR100-5p, miR-1246, and miR-7b-5p (Figure 1 D).
DPSC-exosomes prevent articular cartilage destruction
The osteoarthritis models induced by DMM were treated with either DPSC-exosomes suspended in PBS or PBS solution (control), according to the study design. Safranin
O/Fast Green staining and HE staining were used to evaluate the structure and proteoglycan content of the articular cartilage after 8 weeks of model preparation (DDM). The stained tissues showed noteworthy destruction of the cartilage after the DDM procedure. However, the DPSC-exosome group presented smoother articular surfaces and complete integration of cartilage compared with the control group (Figure 2 A).
Figure 2
A – HE and Safranin O/Fast Green stained sections of knee joints of sham surgery group and DMM model which included PBS and DPSC-exosome treated groups. B – OARSI score of the stained slides from sham surgery group and DMM model which included PBS and DPSC-exosome treated groups. The arrows refer to the pathologic changes
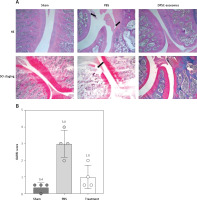
To quantify the degree of cartilage damage, maximal scores of the OARSI scoring system were calculated. The results demonstrated that DPSC-exosome-treated cartilage achieved a better score and significantly covered the DMM-induced lesion. Among the mice that experienced DDM, the OARSI mean (SD) of the maximal score of the DPSC-exosome group was significantly better than that of the PBS group, which was 1 (0.70) and 3 (0.81), respectively, with a p-value < 0.05, while the sham surgery group score was 0.37 (0.25) (Figure 2 B).
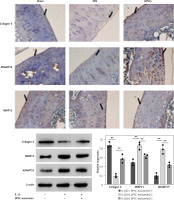
On the other hand, an immunohistochemical test was established to evaluate the level of osteoarthritis related proteins in the mice cartilage. These results clearly indicated that the overexpression of MMP13 and ADAMTS5 due to DDM was effectively downregulated upon treatment with DPSC-exosomes. Moreover, the reduction in collagen II due to DMM can be mainly fixed using DPSC-exosome treatment, as shown in Figure 3. Altogether, these results showed that DPSC-exosomes have the ability to reach the injured area of cartilage, stimulate chondrocyte catabolism, and suppress its anabolism.
DPSC-exosomes suppress cell apoptosis and stimulate cartilage anabolism
The in vitro part of this study included Annexin V-FITC/PI staining, which was performed to investigate the effects of DPSC-exosomes (5 × 10⁸ vesicles) on IL-1β-induced apoptosis in chondrocytes (used to induce inflammation). Flow cytometry data showed that the degree of apoptosis was the highest in the control sample and lower in the IL-1β with exosome samples. However, the lowest degree of apoptosis was observed in IL-1β samples. Statistical analysis revealed that DPSC-exosomes have the potential to inhibit apoptosis in IL-1β-treated chondrocytes.
Western blotting and immunofluorescence assays were used to detect the levels of the three OA-related proteins. Chondrocyte cells treated with 10 ng/ml IL-1β and 5 × 10⁸ vesicles/ml DPSC-exosomes were used to investigate the protein levels of catabolism-related genes, including ADAMTS5 and MMP13, and anabolism-related genes, including collagen II [35].
Consistent with earlier experimental studies [19, 36], IL-1β remarkably reduced the expression of collagen II but overexpressed the levels of ADAMTS5 and MMP13 proteins. Interestingly, DPSC-exosomes significantly reversed the effect of IL-1β on MMP13, collagen II, and ADAMTS5. The immunofluorescence results have provided support for these findings (Figure 4 A). Thus, these results show that DPSC-exosomes may inhibit the apoptosis process induced by IL-1β in chondrocytes, while stimulating anabolism and inhibiting catabolism in chondrocytes treated with IL-1β.
Figure 4
A – The effect of DPSC-exosomes on cell apoptosis detected by flow cytometry. B – GAG/DNA ratio of the cell-hydrogel constructs and pellets
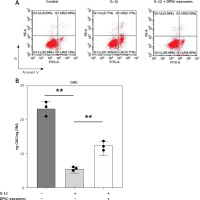
Furthermore, the GAG content normalized to DNA content in the IL-1β-treated chondrocytes was measured (Figure 4 B). The GAG/DNA ratio was significantly decreased in the IL-1β treated chondrocytes compared to the control. However, the IL-1β-treated chondrocytes that received DPSC-exosomes presented a significant increase in the GAG/DNA ratio, which indicates the positive effect of DPSC-exosomes on increasing the GAG content of the regenerated tissue (Figure 4 B).
DPSC-exosomes promote the autophagy level by mTOR signaling pathway inhibition
The autophagy process has a significant role in sustaining cartilage homeostasis [37]. Herein, we studied the changes in autophagy rate related to the effects of DPSC-exosomes on articular cartilage. To study the underlying mechanism of DPSC-exosomes’ role in regulating autophagy in chondrocytes, chondrocyte cells were treated with 5 × 10⁸ vesicles/ml of DPSC-exosomes and 10 ng/ml of IL-1β for 24 h.
Moreover, a high throughput-qPCR assay was used to measure the mRNA level in the autophagy-related genes. There were different expression levels of genes among IL-1β + DPSC-exosome-treated samples and IL-1β-treated chondrocyte samples. The mRNA of mTOR was intensely reduced in DPSC-exosomes, which subsequently could promote autophagy [38], and this leads to providing a protective effect for cartilage [25, 26]. Furthermore, we studied the role of mTOR and its downstream signal on cartilage maintenance. The findings revealed that DPSC-exosomes significantly inverted the increase of mTOR which was caused by IL-1β and P70S6 kinase phosphorylation of P-p70S6K in chondrocyte cells (Figure 5).
Figure 5
DPSC-exosomes could dose-dependently decrease the protein level of P-mTOR and P-p70S6K. A – Relative ratio of mTOR/β-actin. B – Relative ratio of P-p70S6K/β-actin. C – Expression of P-mTOR and P-p70S6K was investigated by western blot. Three independent experiments were performed, **p < 0.01
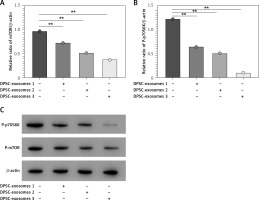
Additionally, we investigated the effects of different doses of DPSC-exosomes (1 × 10⁸, 5 × 10⁸, and 10 × 108) which were applied for 24 h. The results showed that different doses of DPSC-exosomes affected the ability to reduce the protein level of mTOR, and a larger effect was associated with a higher dose of DPSC-exosomes. Altogether, DPSC-exosomes have the ability to significantly promote protective autophagy in IL-1β-treated chondrocytes, which could be attributed to mTOR inhibition.
miR-31 enriched in DPSC-exosomes reduces mTOR expression
This part of the experiment was aimed at predicting the potential ability of miR-31 to target the 3’UTR of mTOR. The miR-31 inhibitor was used in the luciferase reporter assay to examine whether miR-31 contributes to the DPSC-exosomes’ effects on the 3′UTR activity of mTOR. The luciferase reporter results revealed that the luciferase activity was strongly inhibited by DPSC-exosomes, whereas miR-31 inhibitors interrupted the effect of DPSC-exosomes. To confirm these findings, a luciferase reporter plasmid which included the mutant 3′UTR region of mTOR (pmir-mTOR-mu) was established. The luciferase reporter results revealed that the DPSC-exosomes significantly decreased luciferase activity in the cells which were transfected with pmir-mTOR, whereas luciferase activity was not affected in cells transfected with pmir-mTOR-mu.
Furthermore, DPSC-exosomes-treated chondrocytes were incubated for 24 h. Next the miR-31 levels were quantified by qRT-PCR. The results indicated that miR-31 levels were notably greater in the DPSC-exosomes-treated chondrocytes compared to chondrocytes cultured without exosomes.
To further confirm the above-mentioned results, western blot was utilized to investigate the effect of DPSC-exosomes on expression levels of mTOR protein and mTOR pathway markers (P-S6 and P-4EBP1). There was a noteworthy decrease in the expression level of mTOR protein and its markers in the DPSC-exosome-treated chondrocytes, whereas the miR-31 inhibitor blocked the reduction in the expression level of mTOR protein (Figure 6). These findings reveal that DPSC-exosomes’ role in downregulating mTOR is fundamentally dependent on miR-31.
Figure 6
A – The miR-31 relative expression level. B – Protein levels of P-mTOR and β-actin obtained by western blotting. C – Western blot analysis of p-S6 levels in IL-1β treated chondrocytes. D – Western blot analysis of P-4EBP1 levels in IL-1β treated chondrocytes
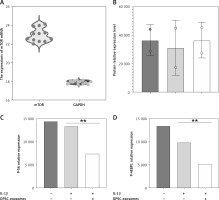
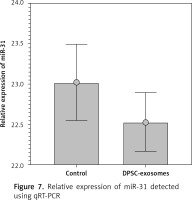
Furthermore, qRT-PCR was used to quantify the miR-31 levels in the DPSC-exosome-treated chondrocytes samples. U6 was used as an internal reference gene for evaluating mir-31 expression. The results showed that miR-31 level in the DPSC-exosome-treated chondrocytes was lower than that in the non-treated chondrocyte samples (Figure 7).
Injection of antagomir-miR-31 intraarticularly into the DMM model disrupts the therapeutic effect of DPSC-exosomes
This part of the experiment investigated whether miR-31 has a role in the cartilage protection effect which is mediated by DPSC-exosomes. The mice which underwent DMM were randomly divided into two groups. The first group received DPSC-exosomes with antagomir-miR-31 intraarticularly, while the second group received only intraarticular injection of DPSC-exosomes. The tissues of the treated knee were harvested after 8 weeks of surgery, and the harvested tissues were stained using Safranin O and Fast Green (Figure 8). The results revealed that antagomir-miR-31 widely suppressed the therapeutic effect of DPSC-exosome-mediated cartilage protection in the studied model. The mean scores (SD) of the tested slides were 0.87 (0.93), 2.5 (0.99), 2.5 (1.08) for PBS-EXo + antagomir-NC, PBS-Exo + antagomir-31, and PBS + antagomir-NC, respectively.
Figure 8
Safranin O/Fast Green staining of mice knee joint sections showing that antagomir-31 reversed the therapeutic effect of DPSC-exosomes. Arrows indicate pathologic changes

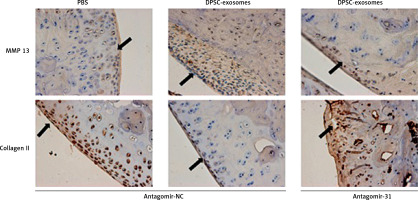
Furthermore, immunohistochemical investigations showed that the increase of collagen II content and decrease of MMP13 content which were achieved through using DPSC-exosomes were reversed when antagomir-miR-31 was added. These findings revealed that the chondroprotective effect was chiefly dependent on the presence of miR-31 (Figure 9).
Discussion
This study revealed that DPSC-exosomes have a chondroprotective effect in osteoarthritis, which is essentially connected to the miR-31-mediated suppression of the mTOR-autophagy pathway. The use of dental tissues as a source for tissue engineering applications is gaining substantial attention [39–44]. Previous studies have shown that stem cell-derived exosomes, which are cell-free treatments, are promising minimally invasive treatments that play a significant role in slowing down OA progression, exerting a protective effect, and promoting cartilage regeneration [18, 19, 45–47]. However, the underlying mechanism remains to be elucidated.
In this study, we conducted in vitro and in vivo experiments to demonstrate the role of miR-31, which is present in the exosome solution, in the treatment of osteoarthritis by targeting mTOR and explaining its mechanism of action. mTOR is an atypical serine/threonine protein kinase. It has a chief role in articular cartilage homeostasis and progression of osteoarthritis [48].
The suppression of mTORC1 promotes autophagy, maintains cell proliferation, and reduces the expression of inflammatory factors in osteoarthritis [49]. Moreover, a previous experimental study showed that the intra-articularly injected mTORC1 inhibitor rapamycin could activate chondrocyte autophagy and delay cartilage degradation in an animal model [26]. The study by Bouderlique et al. showed compatible results upon the genetic deletion of mTOR. Earlier studies have shown that miR-31 possesses the ability to increase chondrocyte viability, proliferation and migration through targeting the lysine-specific demethylase 2A [21, 50]. Therefore, studying the relationship between mTOR and miR-31 could lead to a better understanding of the therapeutic mechanism of action.
Herein, the relative expression levels of P-S6 and P-4EBP1 were elevated in the DPSC-exosome group. The experimental findings showed that DPSC-exosomes could perfectly inhibit mTOR and subsequently promote autophagy in chondrocytes. Moreover, the chondroprotective effect of DPSC-exosomes was achieved through delivering exosomal miR-31 to the treated area. Likewise, several studies have confirmed the significant role of miR-31 in treating osteoarthritis [51]. This suggests that exosome-mediated injection of miR-31 could play a pivotal role in regulating recipient cell functions and cell-to-cell signals.
Furthermore, as the antagomir-miR-31 greatly affected the therapeutic effect of DPSC-exosomes, this also supports the role of miR-31 as an essential component of DPSC-exosomes. However, as the antagomir-miR-31 did not completely eliminate the therapeutic effect of DPSC-exosomes, it is supposed that another mechanism could be associated with the abovementioned mechanism. In a previous study, MSC-exosomes showed the ability to control immune reactivity, such as cytokine release and macrophage response, which could contribute to the therapeutic effect [52, 53].
Another suggested explanation for the potential mechanism of action is that exosomal solutions include bioactive lipids, proteins, and nucleic acids. This could significantly contribute to exerting the biological effects of DPSC-exosomes [54].
Although it has been confirmed that mTOR plays a major role in negatively regulating autophagy, the precise underlying mechanisms have not been fully elucidated [38].
In agreement with our experimental results, Xu et al. [55] confirmed that miR-31 could improve survival and promote autophagy of osteoarthritis chondrocytes via the inhibition of mTORC1 by targeting the transcription factor SOX-4. This suggests that miR-31 has a chondroprotective role in osteoarthritis conditions. To the best of our knowledge, this study is the first to examine the role of miR-31 in the protection of articular cartilages using DPSC-exosomes through targeting the mTOR/autophagy-signaling pathway. However, further studies are highly recommended to discover other important components of exosomes that contribute to the therapeutic effect of miR-31 and to improve the therapeutic effects of MSC-exosome therapy in osteoarthritis.
In conclusion, the current study demonstrates that DPSC-exosomes have the potential to protect cartilage from damage in an osteoarthritis mouse model, owing to their ability to regulate anabolic and catabolic processes and suppress chondrocyte apoptosis. The underlying mechanism of action could be based on the role of miR-31 in inhibiting the mTOR-autophagy pathway. Our findings could offer a basis for further investigations that will help elucidate the entire mechanism of action. However, further experimental studies are strongly recommended to clarify the exact function of exosomalmiR-31 in an osteoarthritis model before it can be applied in routine clinical applications.


