Current issue
Archive
Manuscripts accepted
About the Journal
Editorial office
Editorial board
Section Editors
Abstracting and indexing
Subscription
Contact
Ethical standards and procedures
Most read articles
Instructions for authors
Article Processing Charge (APC)
Regulations of paying article processing charge (APC)
CLINICAL RESEARCH
The rare glucose response curve during oral glucose tolerance tests in pregnant Chinese women and its association with preterm birth
1
Department of Central Laboratory, Children's Hospital, Zhejiang University School of Medicine, National Clinical Research Center for Child Health, Hangzhou, China
2
Department of Clinical Laboratory, Women's Hospital, Zhejiang University School of Medicine, China
These authors had equal contribution to this work
Submission date: 2024-09-16
Final revision date: 2024-11-24
Acceptance date: 2024-12-07
Online publication date: 2025-02-28
Corresponding author
Yongying Bai
Department of Clinical Laboratory, Women's Hospital, Zhejiang University School of Medicine, China
Department of Clinical Laboratory, Women's Hospital, Zhejiang University School of Medicine, China
KEYWORDS
TOPICS
ABSTRACT
Introduction:
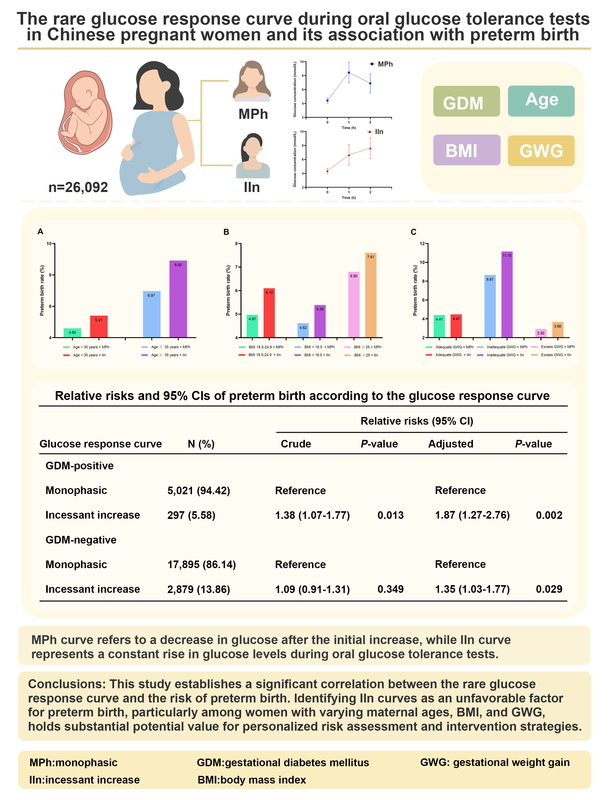
This study aimed to investigate the rare glucose response curve during oral glucose tolerance tests (OGTTs) in pregnant Chinese women and its association with preterm birth.
Material and methods:
A total of 26,092 pregnant women were included in this study and categorized into two groups based on the shape of their glucose response curve during OGTTs conducted at 24–28 weeks of gestation. The curves were classified as either monophasic (MPh) or incessant increase (IIn). Logistic regression analysis was utilized to examine the association between these shapes and the risk of preterm birth. Additionally, we explored the relationship between these shapes and preterm birth across various factors including gestational diabetes mellitus (GDM) status, maternal age, preconception body mass index (BMI), and gestational weight gain (GWG).
Results:
The most prevalent OGTT curve observed was MPh (85.54%), followed by IIn (14.46%). Compared to the majority MPh group, curves with IIn had a higher rate of preterm birth (p < 0.05). The logistic regression analyses, with the MPh group as a reference, revealed that regardless of GDM, membership of the IIn group was an unfavorable factor for preterm birth development, even after adjusting for potential covariates (p < 0.05). Furthermore, these risks varied depending on maternal age, preconception BMI, and GWG.
Conclusions:
This study establishes a significant correlation between the rare glucose response curve and the risk of preterm birth. Identifying IIn curves as an unfavorable factor for preterm birth, particularly among women with varying maternal ages, BMI, and GWG, holds substantial potential value for personalized risk assessment and intervention strategies.
REFERENCES (48)
1.
Sert UY, Ozgu-Erdinc AS. Gestational diabetes mellitus screening and diagnosis. Adv Exp Med Biol 2021; 1307: 231-55.
2.
Hou J, Chen X, Xia J, et al. Down-regulation of PM20D1 is associated with clinical outcomes and prognosis of pregnant patients with diabetes mellitus. Arch Med Sci 2023; 19: 1701-8.
3.
Metzger BE, Gabbe SG, Persson B, et al. International association of diabetes and pregnancy study groups recommendations on the diagnosis and classification of hyperglycemia in pregnancy. Diabetes Care 2010; 33: 676-82.
4.
Kim JY, Michaliszyn SF, Nasr A, et al. The shape of the glucose response curve during an oral glucose tolerance test heralds biomarkers of type 2 diabetes risk in obese youth. Diabetes Care 2016; 39: 1431-9.
5.
Bervoets L, Mewis A, Massa G. The shape of the plasma glucose curve during an oral glucose tolerance test as an indicator of beta cell function and insulin sensitivity in end-pubertal obese girls. Horm Metab Res 2015; 47: 445-51.
6.
Tura A, Morbiducci U, Sbrignadello S, et al. Shape of glucose, insulin, C-peptide curves during a 3-h oral glucose tolerance test: any relationship with the degree of glucose tolerance? Am J Physiol-Reg I 2011; 300: R941-8.
7.
Tschritter O, Fritsche A, Shirkavand F, et al. Assessing the shape of the glucose curve during an oral glucose tolerance test. Diabetes Care 2003; 26: 1026-33.
8.
Kanauchi M, Kimura K, Kanauchi K, et al. Beta-cell function and insulin sensitivity contribute to the shape of plasma glucose curve during an oral glucose tolerance test in non-diabetic individuals. Int J Clin Pract 2005; 59: 427-32.
9.
Nolfe G, Spreghini MR, Sforza RW, et al. Beyond the morphology of the glucose curve following an oral glucose tolerance test in obese youth. Eur J Endocrinol 2012; 166: 107-14.
10.
Kim JY, Coletta DK, Mandarino LJ, et al. Glucose response curve and type 2 diabetes risk in latino adolescents.
12.
Arslanian S, El Ghormli L, Young Kim J, et al. The shape of the glucose response curve during an oral glucose tolerance test: forerunner of heightened glycemic failure rates and accelerated decline in beta-cell function in today. Diabetes Care 2019; 42: 164-72.
13.
Arslanian SA, El Ghormli L, Kim JY, et al. OGTT glucose response curves, insulin sensitivity, and beta-cell function in RISE: comparison between youth and adults at randomization and in response to interventions to preserve beta-cell function. Diabetes Care 2021; 44: 817-25.
14.
Zhang DX, Wen Z, Jiang T, et al. The incessant increase curve during oral glucose tolerance tests in Chinese adults with type 2 diabetes and its association with gut hormone levels. Peptides 2021; 143: 170595.
15.
WHO: recommended definitions, terminology and format for statistical tables related to the perinatal period and use of a new certificate for cause of perinatal deaths. Modifications recommended by FIGO as amended October 14, 1976. Acta Obstet Gynecol Scand 1977; 56: 247-53.
16.
Goldenberg RL, Culhane JF, Iams JD, et al. Epidemiology and causes of preterm birth. Lancet 2008; 371: 75-84.
17.
Chang Y, Li W, Shen YM, et al. Association between interleukin-6 and preterm birth: a meta-analysis. Ann Med 2023; 55: 2284384.
18.
da Fonseca EB, Damiao R, Moreira DA. Preterm birth prevention. Best Pract Res Clin Obstet Gynaecol 2020; 69: 40-9.
19.
Shen Y, Zheng Y, Su Y, et al. Insulin sensitivity, beta cell function, and adverse pregnancy outcomes in women with gestational diabetes. Chin Med J 2022; 135: 2541-6.
20.
International Association of Diabetes and Pregnancy Study Groups Consensus Panel; Metzger BE, Gabbe SG, Persson B, et al. International association of diabetes and pregnancy study groups recommendations on the diagnosis and classification of hyperglycemia in pregnancy. Diabetes Care 2010; 33: 676-82.
21.
Chen C, Lu FC; Department of Disease Control Ministry of Health PRC. The guidelines for prevention and control of overweight and obesity in Chinese adults. Biomed Environ Sci 2004; 17 Suppl: 1-36.
22.
Rasmussen KM, Yaktine AL, eds. Weight Gain During Pregnancy: Reexamining the Guidelines. Washington (DC) 2009.
23.
Wei Y, Zhu Y, Tang J, et al. Effects of perinatal disease activity on offspring’s growth in patients with systemic lupus erythematosus. Arch Med Sci 2024; 20: 1171-9.
24.
Vogel JP, Chawanpaiboon S, Moller AB, et al. The global epidemiology of preterm birth. Best Pract Res Clin Obstet Gynaecol 2018; 52: 3-12.
25.
Abdul-Ghani MA, Lyssenko V, Tuomi T, et al. The shape of plasma glucose concentration curve during OGTT predicts future risk of type 2 diabetes. Diabetes-Metab Res 2010; 26: 280-6.
26.
Trujillo-Arriaga HM, Roman-Ramos R. Fitting and evaluating the glucose curve during a quasi continuous sampled oral glucose tolerance test. Comput Biol Med 2008; 38: 185-95.
27.
Tura A, Morbiducci U, Sbrignadello S, et al. Shape of glucose, insulin, C-peptide curves during a 3-h oral glucose tolerance test: any relationship with the degree of glucose tolerance? Am J Physiol Regul Integr Comp Physiol 2011; 300: R941-8.
28.
Fuchigami M, Nakano H, Oba K, et al. Oral glucose tolerance test using a continuous blood sampling technique for analysis of the blood glucose curve. Nihon Ronen Igakkai Zasshi 1994; 31: 518-24.
29.
Manco M, Nolfe G, Pataky Z, et al. Shape of the OGTT glucose curve and risk of impaired glucose metabolism in the EGIR-RISC cohort. Metabolism 2017; 70: 42-50.
30.
Utzschneider KM, Younes N, Rasouli N, et al. Shape of the OGTT glucose response curve: relationship with beta-cell function and differences by sex, race, and BMI in adults with early type 2 diabetes treated with metformin. BMJ Open Diabetes Res Care 2021; 9: e002264.
31.
Wang X, Zhao X, Zhou R, et al. Delay in glucose peak time during the oral glucose tolerance test as an indicator of insulin resistance and insulin secretion in type 2 diabetes patients. J Diabetes Investig 2018; 9: 1288-95.
32.
Kramer CK, Ye C, Hanley AJ, et al. Delayed timing of post-challenge peak blood glucose predicts declining beta cell function and worsening glucose tolerance over time: insight from the first year postpartum. Diabetologia 2015; 58: 1354-62.
33.
Poitout V, Robertson RP. Glucolipotoxicity: fuel excess and beta-cell dysfunction. Endocr Rev 2008; 29: 351-66.
34.
Del Prato S. Role of glucotoxicity and lipotoxicity in the pathophysiology of type 2 diabetes mellitus and emerging treatment strategies. Diabet Med 2009; 26: 1185-92.
35.
Monnier L, Colette C. Postprandial and basal hyperglycaemia in type 2 diabetes: contributions to overall glucose exposure and diabetic complications. Diabetes Metab 2015; 41 (6 Suppl 1): 6S9-15.
36.
Ceriello A, Colagiuri S, Gerich J, et al. Guideline for management of postmeal glucose. Nutr Metab Cardiovasc Dis 2008; 18: S17-33.
37.
Romero R, Espinoza J, Goncalves LF, et al. Inflammation in preterm and term labour and delivery. Semin Fetal Neonatal Med 2006; 11: 317-26.
38.
Green ES, Arck PC. Pathogenesis of preterm birth: bidirectional inflammation in mother and fetus. Semin Immunopathol 2020; 42: 413-29.
39.
Sultana Z, Maiti K, Aitken J, et al. Oxidative stress, placental ageing-related pathologies and adverse pregnancy outcomes. Am J Reprod Immunol 2017; 77(5). doi: 10.1111/aji.12653.
40.
Amelio GS, Provitera L, Raffaeli G, et al. Endothelial dysfunction in preterm infants: the hidden legacy of uteroplacental pathologies. Front Pediatr 2022; 10: 1041919.
41.
Lane-Cordova AD, Khan SS, Grobman WA, et al. Long-term cardiovascular risks associated with adverse pregnancy outcomes: JACC review topic of the week. J Am Coll Cardiol 2019; 73: 2106-16.
42.
Kramer CK, Zinman B, Retnakaran R. Short-term intensive insulin therapy in type 2 diabetes mellitus: a systematic review and meta-analysis. Lancet Diabetes Endocrinol 2013; 1: 28-34.
43.
Ferrero DM, Larson J, Jacobsson B, et al. Cross-country individual participant analysis of 4.1 million singleton births in 5 countries with very high human development index confirms known associations but provides no biologic explanation for 2/3 of all preterm births. PLoS One 2016; 11: e0162506.
44.
Jacobsson B, Ladfors L, Milsom I. Advanced maternal age and adverse perinatal outcome. Obstet Gynecol 2004; 104: 727-33.
45.
Cnattingius S, Villamor E, Johansson S, et al. Maternal obesity and risk of preterm delivery. JAMA 2013; 309: 2362-70.
46.
Greco E, Calanducci M, Nicolaides KH, et al. Gestational diabetes mellitus and adverse maternal and perinatal outcomes in twin and singleton pregnancies: a systematic review and meta-analysis. Am J Obstet Gynecol 2024; 230: 213-25.
47.
Liu X, Wang H, Yang L, et al. Associations between gestational weight gain and adverse birth outcomes: a population-based retrospective cohort study of 9 million mother-infant pairs. Front Nutr 2022; 9: 811217.
48.
Dedik L, Durisova M, Penesova A, et al. Estimation of influence of gastric emptying on shape of glucose concentration-time profile measured in oral glucose tolerance test. Diabetes Res Clin Pract 2007; 77: 377-84.
Share
RELATED ARTICLE
| eISSN: | 1896-9151 |
| ISSN: | 1734-1922 |
We process personal data collected when visiting the website. The function of obtaining information about users and their behavior is carried out by voluntarily entered information in forms and saving cookies in end devices. Data, including cookies, are used to provide services, improve the user experience and to analyze the traffic in accordance with the Privacy policy. Data are also collected and processed by Google Analytics tool (more).
You can change cookies settings in your browser. Restricted use of cookies in the browser configuration may affect some functionalities of the website.
You can change cookies settings in your browser. Restricted use of cookies in the browser configuration may affect some functionalities of the website.