A sinister duo: diabetes and obesity
The prevalence of type 2 diabetes is gradually increasing, mainly in relation to the growing number of people with obesity. In Poland, over the period 1975–2016, the percentage of obese people increased significantly, from about 11% to more than 25% [1]. In the LIPIDOGRAM2015 study of primary care patients, the prevalence of diabetes was estimated at 18% in the male population and 12% in the female population [2]. An estimated 2 billion people are overweight worldwide, and a third of those are obese [3, 4]. In 2019 alone, the number of obesity-related deaths reached 5 million [5]. It is predicted that by 2030, one in two adults in the United States will be obese, and about a quarter will be morbidly obese [6]. Similarly alarming figures apply to Poland: the percentage of overweight people is 32.2% of adult women, 46.8% of adult men, 18.3% of boys and 19.2% of girls. In the LIPIDOGRAM2015 study, the prevalence of overweight was estimated at 45% in the male population and 37% in the female population [2]. Moreover, 18.1% of adult women, 20.1% of adult men, 17.6% of boys and 9.4% of girls in Poland suffer from obesity [7]. In the LIPIDOGRAM2015 study in primary care settings, the prevalence of obesity was estimated at 38.5% in the male population and 32% in the female population [2]. The World Obesity Federation’s 2022 obesity prevalence projections indicate that by 2030, 1 in 5 women and 1 in 7 men will be obese [8]. It should be noted that more than 200 different complications are associated with obesity, and cardiovascular disease (CVD) is among the most common causes of morbidity and mortality [9, 10].
One of the most serious consequences of obesity is insulin resistance, atherogenic dyslipidaemia, prediabetes and subsequently diabetes and its complications [11]. In 2021, 529 million people worldwide had diabetes (average global prevalence: 6.1%). Type 2 diabetes accounts for 96% of all cases of the disease. It is predicted that by 2050 the number of patients with diabetes worldwide will exceed 1.31 billion [12]. Over the period 2021–2045, the percentage of diabetics worldwide will increase by as much as 46%. In Europe, the number of diabetics in 2021 was 61 million, by 2030 it will be 67 million and in 2045 69 million [13]. One should also add to this, an epidemic of pre-diabetic conditions, including impaired glucose tolerance (IGT) and impaired fasting glucose (IFG). It is indicated that in 2021 the number of people with IGT and IFG worldwide was 464 million (9.1%) and 298 million (5.8%), while in 2045 it will reach 638 million (10.0%) and 414 million (6.5%), respectively [14]. Excess body weight significantly increases the risk of prediabetes (odds ratio [OR] = 1.99; 95% CI: 1.65–2.41) [15]. A meta-analysis involving nearly 2.8 million people found that being overweight increases the risk of type 2 diabetes twofold, obesity by four and a half times, and morbid obesity by as much as 23 times [16]. Excess body weight accounts for more than 50% of new cases of diabetes each year [16]. The prediabetes alone significantly increases the risk of death from any cause (risk ratio [RR] = 1.13; 95% CI: 1.10–1.17) and cardiovascular disease (RR = 1.15; 95% CI: 1.11–1.18) [15]. People with type 2 diabetes have a one and a half to two times increased CVD risk compared to those without diabetes [17].
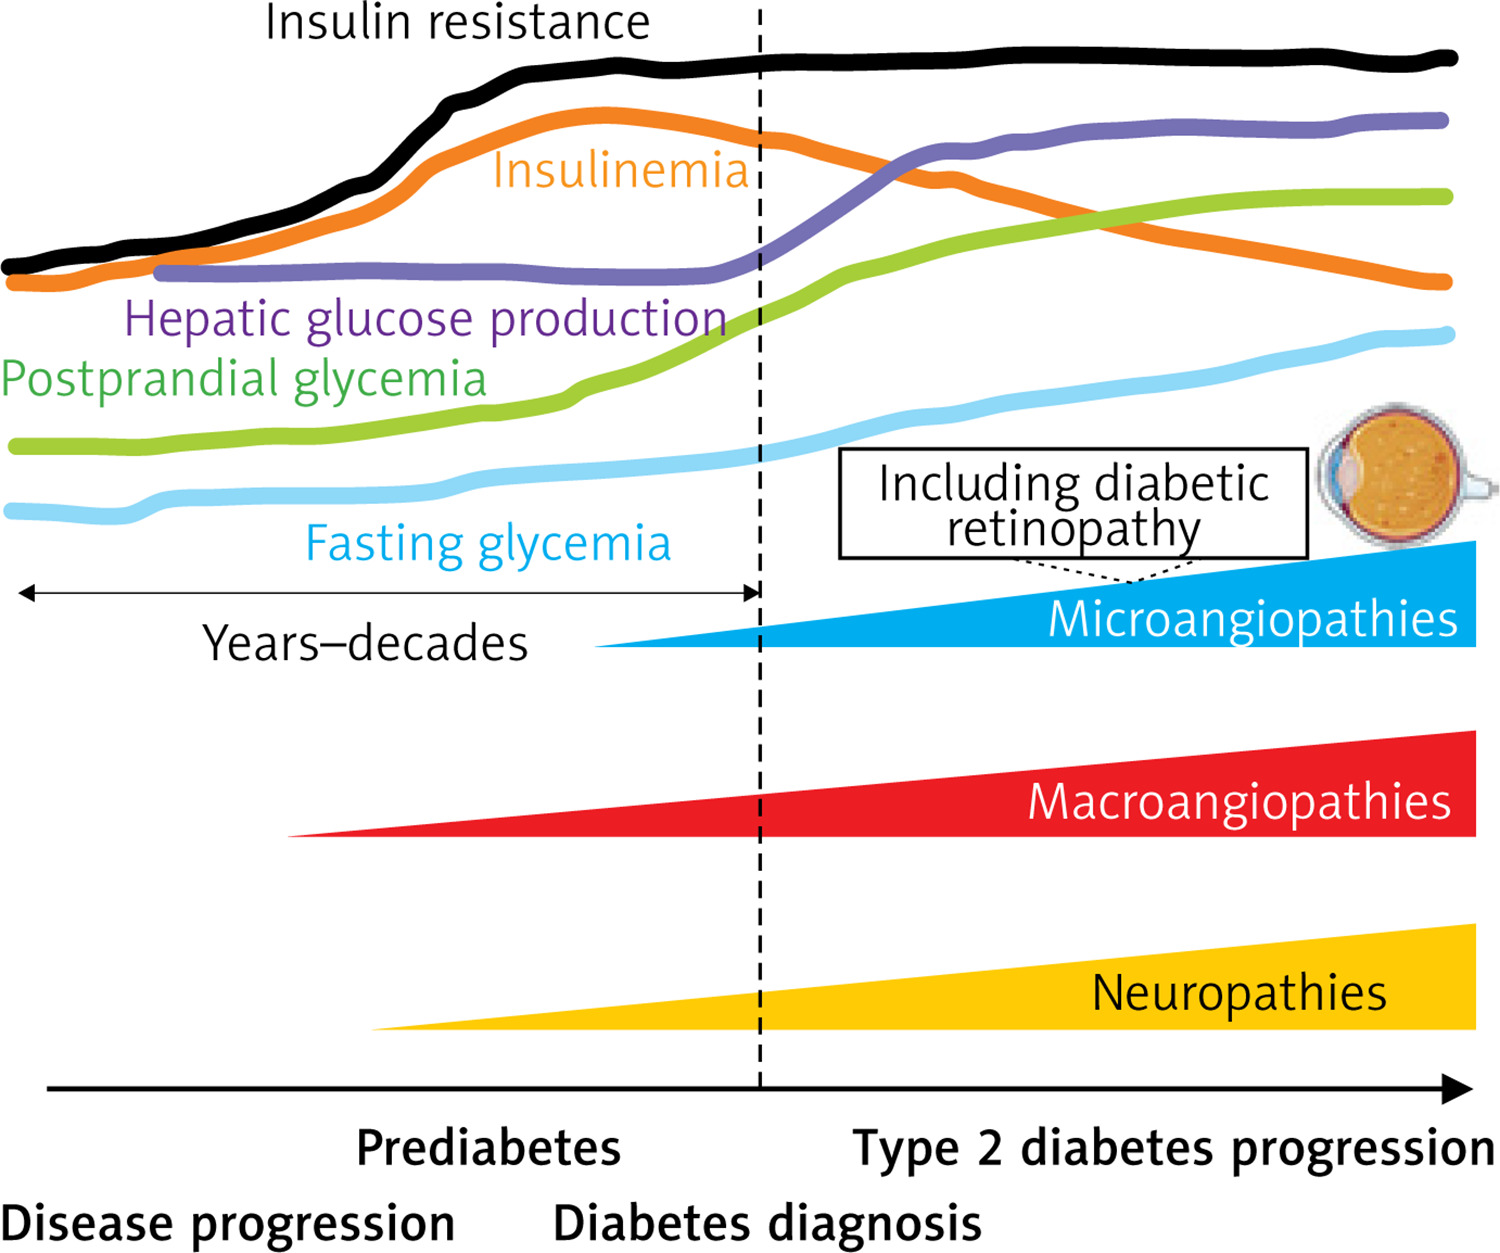
Cardiovascular disease is the leading cause of morbidity and mortality among people with type 2 diabetes [18]. It should be emphasized that at the time of diagnosis of diabetes, complications of the disease such as subclinical organ damage (SOD), macroangiopathies, microangiopathies and neuropathies are already at a certain stage of progression (Figure 1), hence identifying people at risk of diabetes at the earliest possible stage is a key element of cardiovascular prevention [19–21]. It should also be emphasized, in reference to the above, that in daily clinical practice, we do not meet patients with low- or moderate-risk type 2 diabetes, as allowed in the guidelines from 2019, and quite unfortunately in the SCORE-Diabetes, which is often the cause of underestimation of risk and insufficiently intense treatment [22]. One serious microangiopathic complication the risk of which is increased already at the pre-diabetic stage (by as much as 76%) is diabetic retinopathy [23]. This is another argument for patients with diabetes to be classified in at least a high cardiovascular risk category [24, 25].
Classification and epidemiology of diabetic retinopathy
Diabetic retinopathy and associated diabetic macular oedema (maculopathy) is a highly specific neurovascular (microangiopathic/microvascular) complication of diabetes, both type 1 and type 2, and is the most common and also the most severe complication of the disease (because it threatens vision loss) [26]. Extraretinal complications of diabetes include cataracts and secondary glaucoma [26]. The current classification of diabetic retinopathy and diabetic macular oedema is shown in Table I.
Table I
Classification of diabetic retinopathy and diabetic macular oedema
Diabetic retinopathy is one of the major complications of diabetes and is found in up to 30–40% of patients [27]. Taking into account epidemiological projections showing that in 2030 the number of diabetic patients worldwide will exceed 600 million, this indicates that the number of patients with moderate diabetic retinopathy might be about 130 million, with severe retinopathy (threatening vision loss/diabetic macular oedema) about 24 million, and with visual impairment resulting from retinopathy about 4 million [28]. By 2045, the number of patients with diabetic retinopathy will reach 160.5 million, vision-impairing retinopathy 44.82 million and significant diabetic macular oedema 28.61 million [29]. A study by Kozioł et al. based on data from 2013–2017 showed that among Polish patients with type 1 diabetes, the average percentage of those with diabetic retinopathy was 20.01%, while among those with type 2 diabetes it was 9.70%. It is noteworthy that the prevalence of retinopathy among patients with both type 1 and type 2 diabetes increased between 2013 and 2017 (15.67% vs. 23.51% and 7.80% vs. 11.00%, respectively) [30]. A study by Matuszewski et al. involving 315 patients with type 1 diabetes and 894 patients with type 2 diabetes found that diabetic retinopathy was present in 32.6% and 23.04% of the patients, respectively. In patients with type 1 diabetes and diabetic retinopathy, 24.44% had non-proliferative forms, 1.6% proliferative forms and 5.4% had diabetic macular oedema. In patients with type 2 diabetes, the percentages were 17.11%, 1.01% and 4.8%, respectively. The results of this study indicate that, on average, 1 in 4 patients with diabetes have some form of diabetic retinopathy [31]. A meta-analysis of 22,896 patients with diabetes by Yau et al. showed that diabetic retinopathy occurred in 34.6% of all patients, the proliferative form in 6.96%, diabetic macular oedema in 6.81%, and vision-threatening diabetic retinopathy (VTDR) in 10.2% [32]. A retrospective study by Voigt et al. involving 17,461 patients with type 2 diabetes showed that retinopathy was present in 25.8% of them (20.2% non-proliferative DR, 4.7% proliferative DR, 0.1% blindness) [33]. It is noteworthy that in 2020, the number of patients who lost their sight due to diabetic retinopathy was 1.07 million, while those who suffered moderate-to-severe visual impairment in the course of this disease was another 3.28 million [34]. In conclusion, diabetic retinopathy affects 1 in 3 people with diabetes and remains the leading cause of blindness in working-age adults [35, 36].
Risk factors for the development and progression of diabetic retinopathy
The most important risk factor for the onset and progression of diabetic retinopathy is the duration and degree of diabetes control [26]. Nevertheless, a number of other factors have been identified that have a major bearing on the risk of onset and progression of retinopathy in diabetic patients. These factors include hypertension, lipid disorders, excess body weight, diabetic kidney disease, gestation period in diabetic women, puberty period, cataract surgery, and conditions after kidney and pancreas or kidney-only transplantation [26]. A study by Zhang et al. with 7,274 diabetic patients also found that risk factors for diabetic retinopathy included younger age, proteinuria, blood urea nitrogen (BUN) levels, reduced haemoglobin levels, need for insulin therapy, diabetic foot syndrome, peripheral neuropathy, hyperkalaemia and hypernatremia [37]. In yet another study, factors that increased the risk of retinopathy in diabetic patients included elevated intraocular pressure, elevated total cholesterol and triglycerides, and an increased optic cup-to-disc ratio [38]. Poor dietary habits (ultimately leading to obesity and insulin resistance) are also a risk factor for diabetic retinopathy (OR = 2.73; 95% CI: 1.81–4.10) [39]. Even poor glycaemic control is a significant risk factor for proliferative diabetic retinopathy [40]. Very often, type 2 diabetes coexists with other metabolic disorders to form the metabolic syndrome [41]. In Poland, the metabolic syndrome is found in 31.7% of adults (results of the WOBASZ II study) [42]. In the LIPIDOGRAM study, metabolic syndrome was diagnosed in 31% and 37.7% of individuals in primary care settings, depending on the definition (National Cholesterol Education Program, Adult Treatment Panel III [NCEP/ATP III] and Joint Interim Statement [JIS]) [43]. Metabolic syndrome is a significant risk factor for diabetic retinopathy [44, 45].
As mentioned above, the incidence of retinopathy increases with diabetes duration: 1.1% at diagnosis, 6.6% after 0–<5 years, 12% after 5–<10 years, 24% after 10–<15 years, 39.9% after 15–<20 years, 52.7% after 20–<25 years, 58.7% after 25–<30 years and 63% after ≥ 30 years of disease duration. During the first 10 years of diabetes, the incidence of retinopathy is relatively low, and progression is low. Most patients have a non-proliferative form, which can be reversible [33]. In a paediatric population with type 2 diabetes, it was found that the incidence of diabetic retinopathy increased over time and was 1.11% less than 2.5 years after the diagnosis of type 2 diabetes, 9.04% between 2.5 and 5.0 years after the diagnosis and 28.14% more than 5 years after the diagnosis of the disease [46]. It should be noted that people with prediabetes are already more than twice as likely to have retinopathy compared to normoglycemic patients (6.7% vs. 3.0%) [23, 47, 48]. Identifying patients with risk factors for diabetes, prediabetes, and diabetes and other comorbidities allows us to reach persons with a particularly elevated risk of the development and progression of diabetic retinopathy [49]. A critically important risk factor for retinopathy is the duration of diabetes, hence awareness of the disease seems to be the cornerstone of prevention, and as it turns out, as many as 50% of patients are unaware that they have the disease (in 2021, there were 239.7 million unaware type 2 diabetics, that is nearly 45% of all sufferers worldwide) [50].
The occurrence of diabetic retinopathy is an unfavourable prognostic factor. It has been shown that the occurrence of diabetic retinopathy in a diabetic patient is associated with an increased risk of CVD (RR = 2.42; 95% CI: 1.77–3.31) [51], cardiovascular mortality (RR = 1.83; 95% CI: 1.42–2.36) [52] and dementia (OR = 2.45; 95% CI: 1.76–3.41) [53]. Moreover, the occurrence of diabetic retinopathy is a predictor of subclinical atherosclerotic cardiovascular disease (ASCVD) [54].
Lipid disorders in diabetes and the risk of diabetic retinopathy
A frequent comorbidity in patients with type 2 diabetes (up to 70%) [55] is atherogenic dyslipidaemia defined as: 1) normal/elevated low-density lipoprotein (LDL) levels (elevated small dense LDL), 2) reduced high-density lipoprotein (HDL) levels (presence of small dense HDL), and 3) elevated triglyceride-rich lipoprotein levels (presence of large VLDL particles) [38]. The most recent definition introduced in the 2022 expert document, proposed by the Polish Lipid Association, is simply elevated non-HDL levels > 130 mg/dl (3.4 mmol/l) [41]. A meta-analysis by Li et al. involving 7,459 patients with type 2 diabetes showed that those with increased total cholesterol, triglycerides and LDL were more likely to develop diabetic retinopathy [56]. In contrast, a study by Xu et al. involving 4,358 patients with type 2 diabetes showed that those with a higher atherogenic index (AI = non-HDL-C/HDL-C) were more likely to have the proliferative form of diabetic retinopathy [57]. Another study involving 2,535 patients with type 2 diabetes found that the risk of microvascular disease (including diabetic retinopathy) was increased by 16% (hazard ratio [HR] = 1.16; 95% CI: 1.11–1.22) for every 0.5 mmol/l (44.3 mg/dl) of increase in plasma triglycerides and reduced by 8% (HR = 0.92; 95% CI: 0.88–0.96) for every 0.2 mmol/l of increase in HDL-C (8 mg/dl) [58]. Moreover, elevated remnant cholesterol (i.e. the difference between total cholesterol and HDL and LDL-C) also correlates with a higher risk of retinopathy in patients with type 2 diabetes (OR = 5.6; 95% CI: 3.0–10.6) [59], similarly obviously to hypertriglyceridemia (OR = 2.26; 95% CI: 1.40–3.65) [60]. It is worth mentioning that elevated LDL-C levels are a risk factor for diabetic retinopathy in patients with type 1 diabetes (OR = 1.79; 95% CI: 1.16–2.87) [61]. The presence of dyslipidaemia in patients with diabetes increases the risk of non-proliferative retinopathy and diabetic macular oedema (HR = 1.77; 95% CI: 1.63–1.92 and HR = 2.34; 95% CI: 1.24–4.41, respectively) [62]. Liu et al. identified, as a risk factor for diabetic retinopathy, elevated levels of small dense LDL (OR = 14.71; 95% CI: 8.30–26.08) which are a hallmark of atherogenic diabetic dyslipidaemia (in the presence of elevated triglyceride-rich lipoproteins [TRLs]) [63]. Further important information was provided by studies by Moosaie et al. and Yun et al., which showed that elevated Lp(a) levels in patients with type 2 diabetes were also a risk factor for diabetic retinopathy (up to a 5-fold increase in risk) [64, 65]. In contrast, a study by Shu et al. using Mendelian randomization (facilitating the cause-and-effect inference) showed that reduced HDL-C levels were associated with a higher risk of diabetic retinopathy [66]. Interestingly, dyslipidaemia has also been identified as a factor that increases the risk of retinal vein occlusion (RVO), the second most common retinal vascular disease after diabetic retinopathy [67].
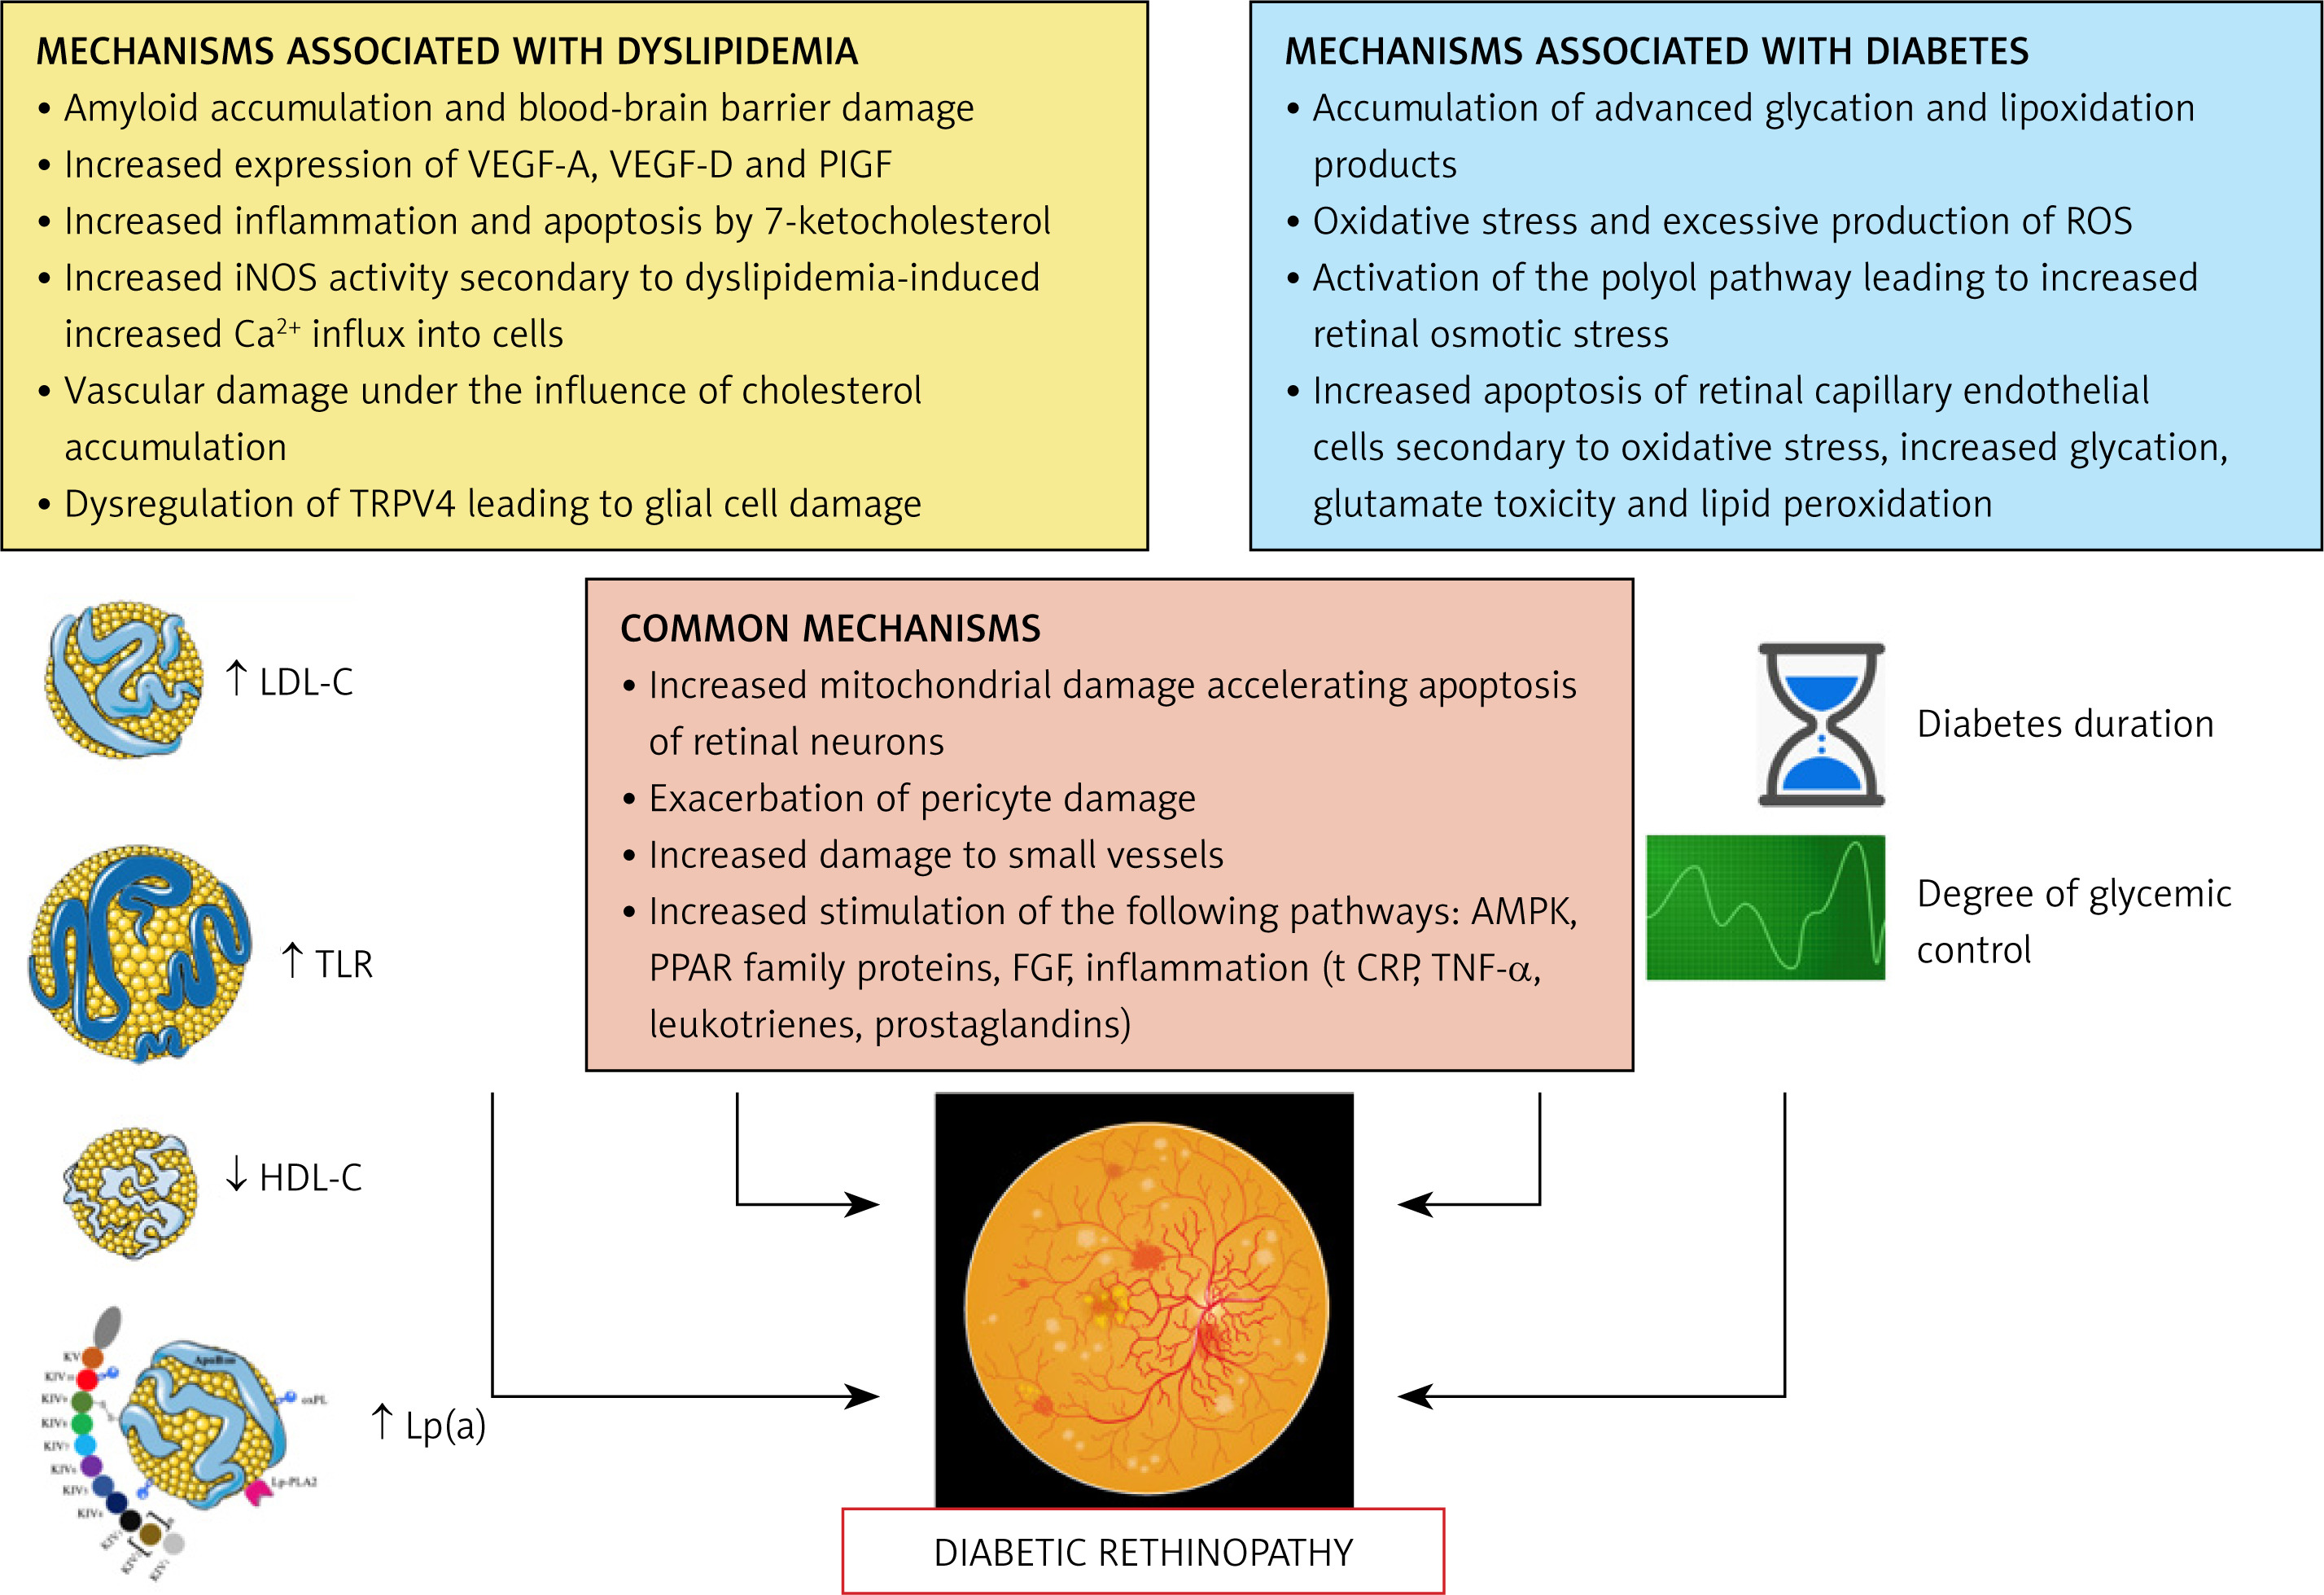
In conclusion, lipid disorders, particularly in the form of atherogenic diabetic dyslipidaemia, are a documented risk factor for the development and progression of retinopathy in diabetic patients. A number of pathophysiological mechanisms have been identified linking lipid disorders and diabetes to diabetic retinopathy, as summarized in Figure 2 [68–70].
Diabetic dyslipidaemia and cardiovascular risk: the role of residual risk
When discussing the impact of lipid disorders on the risk of diabetic retinopathy, one cannot ignore the effect of this risk factor on overall CVD risk and the aspect related to residual risk in patients with type 2 diabetes.
Patients with diabetes have a higher residual risk of cardiovascular disease despite statin therapy and lifestyle changes. A pattern of elevated triglycerides, elevated sdLDL levels and reduced HDL-C levels, which is referred to as (atherogenic) diabetic dyslipidaemia, is peculiar to people with diabetes [71].
Hypertriglyceridemia is a documented risk factor for ASCVD. A meta-analysis involving more than 262,000 people found that triglyceride levels > 181 mg/dl were associated with a 71% higher risk of ASCVD (RR = 1.71; 95% CI: 1.56–1.90) [72]. Another meta-analysis showed that the risk of death from any cause as well as from cardiovascular causes begins to increase significantly in patients with triglyceride levels > 150 mg/dl (RR = 1.15; 95% CI: 1.03–1.29 and RR = 1.09; 95% CI: 1.02–1.17, respectively). Each 1 mmol/l (88.6 mg/dl) of increase in triglycerides was found to be associated with an elevated risk of death from any cause, as well as from cardiovascular causes by 13% and 12%, respectively [73]. Similarly, elevated triglyceride levels increase the risk of ASCVD in patients with type 2 diabetes [74]. The Progression of Early Subclinical Atherosclerosis (PESA) study also showed that triglyceride levels above 100 mg/dl (1.13 mmol/l) are associated with a significant increase in cardiovascular risk, which was the basis for changing the recommendations of the Polish Lipid Association (PoLA) and the Polish Society of Laboratory Diagnostics (PTDL) in this regard, with the current optimal triglyceride concentration being not < 150 (1.7 mmol/l) but < 100 mg/dl (1.1 mmol/l) [75, 76].
In patients with diabetes and comorbid lipid disorders, statins are the first-choice medicines (the gold standard after the Heart Protection Study [HPS]) [25]. It should be noted, however, that in some patients with diabetes, statin therapy may not be sufficient/may be insufficient, which is associated with residual risk. Patients with diabetes have a higher cardiovascular risk, even when taking statins, compared to those without diabetes treated with these drugs [77]. Factors determining residual risk include high-sensitivity C-reactive protein (hsCRP) ≥ 2 mg/dl, the presence of prothrombotic factors, triglyceride levels ≥ 150 mg/dl, Lp(a) levels ≥ 50 mg/dl and inadequate glycaemic control [78]. Long-term follow-up of the dal-OUTCOMES trial with cholesteryl ester transfer protein (CETP) inhibitor dalcetrapib showed that the risk of cardiovascular events in the > 175 mg/dl quintile relative to the ≤ 80 mg/dl quintile of triglyceride levels was 61% higher (HR = 1.61; 95% CI: 1.34–1.94), despite effective treatment with statins [79]. The Treating to New Targets (TNT) randomized clinical trial, with either atorvastatin 10 or 80 mg, involving 9,770 patients showed that high triglyceride levels and reduced HDL-C levels correlate with ASCVD risk, even when LDL-C levels are well controlled (≤ 70 mg/dl) [80]. A meta-analysis including 62,154 statin-treated patients showed that those with LDL-C < 100 mg/dl (2.5 mmol/l) and non-HDL-C ≥ 130 mg/dl had a 32% higher cardiovascular risk compared to those with LDL-C < 100 mg/dl and non-HDL-C < 130 mg/dl (3.4 mmol/l), respectively [81]. In a study by Sirimarco et al., it was shown that the risk of major CVD events, despite the use of statins, was higher in patients with atherogenic dyslipidaemia compared to those without (HR 1.36 and 1.40 in analyzed trials, respectively) [82].
In conclusion, in patients with diabetes, adequate LDL-C control may not be sufficient/may be insufficient to optimize cardiovascular risk, due to the important role of residual risk in these patients, associated primarily with elevated triglyceride-rich lipoprotein levels.
Methods of diabetic retinopathy prevention
The residual CVD risk discussed above fits clearly into the issues of diabetic retinopathy prevention. Strategies to reduce the risk of cardiovascular disease in people with type 2 diabetes include lifestyle changes as a foundation (proper diet, regular exercise, no stimulants, healthy sleep), followed by pharmacotherapy to optimize plasma lipid levels, blood pressure and glycaemic control. On top of this, it is critically important to educate the patients at every step of the healthcare system to improve disease awareness and, consequently, adherence [83]. Data from epidemiological and clinical studies show that control of many risk factors is associated with ≥ 50% reduction in cardiovascular events, but only ≤ 20% of patients with type 2 diabetes achieve target risk factor levels [13].
A meta-analysis by Kunutsor et al. evaluated the effect of more intensive glycaemic control in patients with type 2 diabetes on cardiovascular risk. They found that patients with more intensive glycaemic control had a significantly lower risk of microangiopathic complications, including nephropathy (HR = 0.70; 95% CI: 0.55–0.90) and retinopathy (HR = 0.85; 95% CI: 0.78–0.93). More intensive glycaemic control was associated with a higher risk of hypoglycaemia but was generally well tolerated by patients (risk of any adverse effects: HR = 1.00; 95% CI: 0.98–1.03) [84]. It follows that intensive glycaemic control reduces the risk of diabetic retinopathy by 15%, with the remaining 85% associated with residual risk [85].
Results of previous studies strongly support the use of lipid-lowering agents in combination with antidiabetic and antihypertensive therapy to prevent and treat diabetic retinopathy [86]. A real-world analysis of data from 69,070 patients with type 2 diabetes showed that the use of lipid-lowering drugs was associated with a reduced risk of developing diabetic retinopathy (OR = 0.77; 95% CI: 0.72–0.83). Moreover, the use of these medicines was also associated with a reduced risk of diabetic macular oedema, the need for any kind of ophthalmologic treatment for retinopathy or the need for laser photocoagulation and vitrectomy in patients with diabetic retinopathy at baseline [87]. A meta-analysis including 13,454 patients with diabetes showed that hypolipemic treatment significantly slowed the progression of diabetic retinopathy by 23% (OR = 0.77; 95% CI: 0.62–0.96) [88]. A meta-analysis by Pranata et al. involving 558,177 patients with diabetes also showed that lipid-lowering treatment had a significant preventive effect against the development and progression of diabetic retinopathy (Table II) [89]. It is also worth citing here the results of a study by Kang et al. involving nearly 38,000 patients with type 2 diabetes. The authors showed that lipid-lowering treatment reduced the risk of total diabetic retinopathy (HR = 0.86; 95% CI: 0.81–0.91), non-proliferative diabetic retinopathy (HR = 0.92; 95% CI: 0.86–0.99), proliferative diabetic retinopathy (HR = 0.64; 95% CI: 0.58–0.70), vitreous haemorrhage (HR = 0.62; 95% CI: 0.54–0.71), retinal detachment (HR = 0.61; 95% CI: 0.47–0.79) and diabetic macular oedema (HR = 0.60; 95% CI: 0.46–0.79) and also reduced the need for laser therapy (HR = 0.71; 95% CI: 0.65–0.77), vitreous injections (HR = 0.74; 95% CI: 0.61–0.89) and vitrectomy (HR = 0.58; 95% CI: 0.48–0.69). Lipid-lowering therapy (LLT) in these patients was also associated with a lower risk of major adverse cardiovascular events (MACE) (HR = 0.81; 95% CI: 0.77–0.85), development of diabetic neuropathy (HR = 0.85; 95% CI: 0.82–0.89) and of diabetic foot syndrome (HR = 0.73; 95% CI: 0.68–0.78) [90].
Table II
Effect of lipid-lowering treatment on the risk and progression of diabetic retinopathy. Results of a meta-analysis by Pranata et al. [89]
In summary, the main strategy for preventing and slowing the progression of retinopathy in patients with diabetes is lifestyle modification, proper control of glycemia, blood pressure and lipid profile. Nevertheless, as shown in available studies, treatment with statins of patients with atherogenic dyslipidaemia does not fully protect against the risk of microvascular complications, especially those with elevated triglycerides and reduced HDL-C levels (with elevated non-HDL levels) [91]. Hence, the important role of the use of fibrates in this group of patients is highlighted, with particular importance of fenofibrate.
Fenofibrate and cardiovascular risk in patients with type 2 diabetes
According to guidelines still in effect, the addition of fenofibrate to statin therapy should be considered in patients with diabetes and persistent triglyceride levels > 200 mg/dl (2.3 mmol/l) [25]. The addition of fenofibrate to therapy in patients with type 2 diabetes has a documented cardio-preventive effect. The FIELD (Fenofibrate Intervention and Event Lowering in Diabetes) trial involving 9,795 patients with type 2 diabetes analysed the effect of fenofibrate (in monotherapy) versus placebo on cardiovascular risk. Fenofibrate reduced total cholesterol, LDL-C and triglycerides by 7%, 6% and 22%, respectively. There was a non-significant effect of fenofibrate on the risk of the primary composite endpoint (cardiovascular death + non-fatal myocardial infarction) (HR = 0.89; 95% CI: 0.75–1.05). However, it should be noted that the study had a limitation due to unequal use of statins in both groups (19% in the fenofibrate group and as much as 36% in the placebo group), which were recommended after the HPS results were announced during the FIELD trial. After adjusting the results for treatment with statins, a significant 19% reduction in the primary endpoint was achieved (p = 0.01). Fenofibrate also significantly reduced the risk of non-fatal myocardial infarction (HR = 0.76; 95% CI: 0.62–0.94) and the total number of cardiovascular events (HR = 0.89; 95% CI: 0.80–0.99). Subgroup analysis showed that fenofibrate significantly reduced the total number of CVD events only in the primary prevention group of patients – without a history of ASCVD (HR = 0.81; 95% CI: 0.70–0.94). In the FIELD trial, it was observed that patients using fenofibrate had a lower incidence of diabetic retinopathy requiring laser treatment (5.2% vs. 3.6%, p = 0.0003) [92]. A significant benefit of fenofibrate in the FIELD trial was demonstrated in patients with elevated triglyceride levels and concomitant reductions in HDL-C levels. In this subgroup, fenofibrate was shown to reduce the overall risk of cardiovascular events by 27% (RR = 0.73; number needed to treat [NNT] = 23) [93]. The Action to Control Cardiovascular Risk in Diabetes (ACCORD) trial involving 5,518 patients with type 2 diabetes also showed no obvious cardiovascular benefit from adding fenofibrate to simvastatin therapy. However, it was observed that the use of statin + fenofibrate combination therapy reduced the risk of hospitalization for heart failure exacerbation (HR = 0.64; 95% CI: 0.48–0.85) [93–97]. Subgroup analysis showed that fenofibrate combined with simvastatin reduced the relative risk of the primary endpoint (non-fatal myocardial infarction or stroke, death from cardiovascular causes) by 31% in the subgroup of patients with triglyceride levels ≥ 204 mg/dl and HDL-C ≤ 34 mg/dl. It should also be added that the patients participating in the ACCORD trial were very well treated at baseline, with mean baseline triglyceride levels in the placebo and fenofibrate groups of 160 and 164 mg/dl, respectively. The ACCORD trial also confirmed the significant role of fenofibrate in reducing the risk of microangiopathic complications, including progression of retinopathy (by 40%, p = 0.006, NNT = 27) and the risk of developing micro- and macroalbuminuria (absolute risk reduction aRR = 3.4%, NNT = 29, p = 0.01 and aRR = 1.8%, NNT = 56; p = 0.03, respectively) [94]. The benefits in this group of patients were confirmed in the extended follow-up of the ACCORD trial (ACCORDION trial), involving 4,644 patients with type 2 diabetes. Again, fenofibrate was shown to reduce the risk of fatal and non-fatal myocardial infarction and stroke by 27% (HR = 0.73; 95% CI: 0.56–0.95) in patients with triglycerides ≥ 204 mg/dl and HDL-C ≤ 34 mg/dl [95]. In a study by Hong et al., involving 110,723 patients with diabetes mellitus and triglyceride levels ≥ 150 mg/dl (1.7 mmol/l) and no history of ASCVD, followed for more than 4 years, it was demonstrated that the addition of fenofibrate to statin therapy was associated with a significantly greater reduction in the risk of myocardial infarction (HR = 0.88; 95% CI: 0.83–0.93), stroke (HR = 0.90; 95% CI: 0.85–0.96) and death from any cause (HR = 0.72; 95% CI: 0.69–0.75), compared to statin monotherapy. A particularly marked reduction in (residual) risk was observed among those who achieved LDL-C levels < 70 mg/dl (1.8 mmol/l) [96]. An extended sub-analysis of the ACCORDION trial (5 + 4.9 years) showed that after the open-label phase of the trial – for the entire follow-up period – the incidence of overall mortality (p = 0.0038), cardiovascular mortality (p = 0.025) and major ischemic heart disease (0.0016) was significantly lower in the fenofibrate group. Moreover, patients who were initially assigned to simvastatin therapy with fenofibrate, even if they discontinued fenofibrate at later follow-up, had a significantly lower risk of death from any cause (HR = 0.65; 95% CI: 0.45–0.94) [97, 98].
The results of the above studies confirm the important role of fenofibrate in optimizing residual risk in patients with diabetes and atherogenic dyslipidaemia.
Fenofibrate and diabetic retinopathy
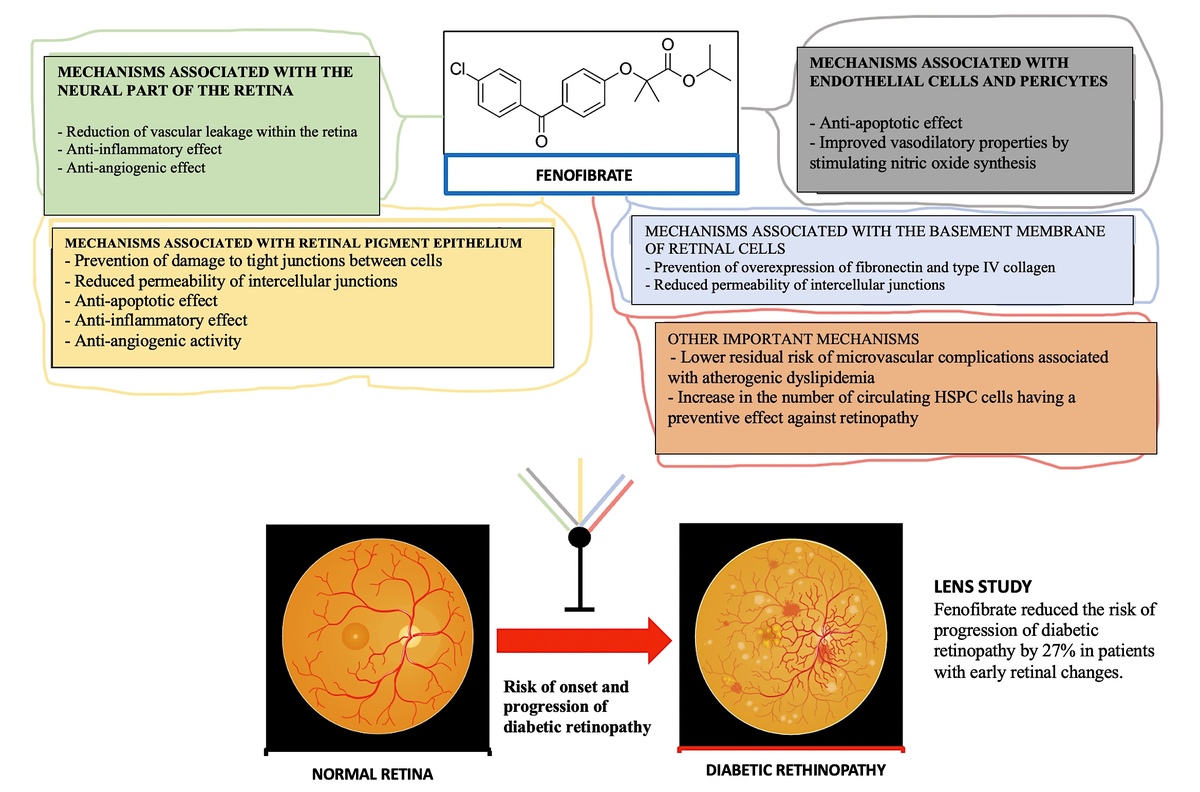
Observations made in the FIELD and ACCORD studies indicating that patients with type 2 diabetes using fenofibrate are less likely to experience diabetic retinopathy requiring laser therapy prompted in-depth analyses of this issue [91]. The ophthalmologic analysis of the FIELD trial showed that fenofibrate significantly reduced the need for laser therapy for diabetic retinopathy by 31% (HR = 0.69; 95% CI: 0.56–0.84; aRR = 1.5%, NNT = 66, p = 0.0002). Fenofibrate decreased the need for laser therapy in patients with diabetic macular oedema and proliferative retinopathy (HR = 0.69; 95% CI: 0.54–0.87 and HR = 0.70; 95% CI: 0.52–0.93, respectively), thus slowing the progression of retinopathy. Fenofibrate also reduced the cumulative number of laser therapy procedures for diabetic retinopathy by 37% (p = 0.0003). A particularly marked reduction in the need for laser therapy was observed in patients with no prior history of retinopathy (49%, p = 0.0002), indicating an important role of fenofibrate in the early stages of prevention of this dangerous complication [99]. Importantly, the authors of the study point out that the demonstrated beneficial effect of fenofibrate cannot be explained by changes in glycated haemoglobin percentage, concomitant treatment, or a small reduction in blood pressure in the group taking fenofibrate [99]. Twenty-two of the 63 centres in the FIELD trial were additionally enrolled in the ophthalmic sub-analysis, which ultimately recruited 1,012 patients (500 from the placebo group and 512 from the fenofibrate group). Retinal photographs were taken at study entry, at year 2 of the study, at year 5 of the study and at study completion. The photographs were evaluated according to the Early Treatment Diabetic Retinopathy Study (ETDRS) criteria, while the primary endpoint included progression of diabetic retinopathy. Fenofibrate was shown to reduce the risk of significant retinal pathologies (progression of retinopathy by 2 degrees, onset of macular oedema, need for laser therapy) by 34% (aRR = 5%, NNT = 20, p = 0.022) [99]. In further analyses, the authors demonstrated a significant role of fenofibrate in reducing first laser therapy (by 79%, p = 0.0004) and the risk of two-stage progression of retinopathy (by 79%, p = 0.004), especially in patients in secondary prevention of retinopathy (NNT = 17; in patients in primary prevention of retinopathy, the NNT was 90). Another important study that directly assessed the effect of fenofibrate on diabetic retinopathy was the ACCORD-EYE study, which was aimed to determine how the degree of glycaemic control, blood pressure control and lipid disorder control with fenofibrate is associated with inhibition of the development and progression of diabetic retinopathy [100]. The ACCORD-EYE analysis was open to all patients participating in the ACCORD trial, except those with proliferative retinopathy treated with photocoagulation or vitrectomy at inclusion. The composite endpoint included progression of diabetic retinopathy (≥ 3 grades according to the ETDRS scale), the need for photocoagulation and the need for vitrectomy. Analysis of data from 1,593 patients showed that the use of fenofibrate in combination with a statin was associated with a significant 40% reduction in the risk of diabetic retinopathy progression (odds ratio [OR] = 0.60; 95% CI: 0.42–0.87; aRR = 3.7%, NNT = 27, p = 0.006) compared to statin monotherapy. Effects were seen only in patients already diagnosed with retinopathy. Intensive glycaemic control reduced the risk of progression of diabetic retinopathy by 33% (OR = 0.67; 95% CI: 0.51–0.87), while intensive antihypertensive treatment had no additional benefit in this aspect (OR = 1.23; 95% CI: 0.84–1.79) [100]. Slowing the progression of diabetic retinopathy was achieved independently of effective control of LDL (78 mg/dl), glycemia (HbA1c 6.4–7.5%) and blood pressure (129/68 mm Hg) [93]. The results of this study indicate a strong preventive role of fenofibrate against the progression of diabetic retinopathy (greater than intensive glycaemic and blood pressure control). The study by Kim et al. also evaluated the effect of adding fenofibrate to treatment on the risk of diabetic retinopathy in patients with type 2 diabetes and metabolic syndrome. The study included 22,395 patients receiving statin therapy with fenofibrate and 43,191 patients receiving statin monotherapy. The primary endpoint included progression of diabetic retinopathy, including vitreous haemorrhage, vitrectomy, laser photocoagulation, vitreous injection therapy and retinal detachment. The risk of the primary endpoint was significantly lower (HR = 0.88; 95% CI: 0.81–0.96) in the group receiving statin + fenofibrate combination treatment. Only patients with pre-existing retinopathy (secondary prevention) benefited significantly from fenofibrate treatment (HR = 0.83; 95% CI: 0.73–0.95). In addition, the risk of vitreous haemorrhage was significantly lower in the group treated with statin and fenofibrate (HR = 0.86; 95% CI: 0.75–0.99), laser photocoagulation (HR = 0.86; 95% CI: 0.77–0.96) and vitreous injection therapy (HR = 0.73; 95% CI: 0.59–0.90) compared with statin monotherapy [101]. Preiss et al. conducted a meta-analysis in 2022, including the FIELD, ACCORD and LDS (Lipids in Diabetes Study) randomized clinical trials, involving a total of 1,504 patients observed for a mean of 4 years. It showed that fenofibrate reduced the risk of laser treatment for diabetic retinopathy after 1 year of treatment by 30% (OR = 0.70; 95% CI: 0.58–0.83) and at any time of treatment by 23% (OR = 0.77; 95% CI: 0.67–0.88). The authors conclude that in a pooled analysis of large cardiovascular trials conducted to date, fenofibrate treatment reduced the need for retinal laser treatment in 1 in 5 patients with diabetes [102]. In a study by Meer et al., involving a group of 5,835 patients treated with fenofibrate and 144,417 patients without fenofibrate, the risk of progression of non-proliferative retinopathy to sight threatening diabetic retinopathy (STDR) was assessed. They found that fenofibrate reduced the risk of progression of non-proliferative retinopathy to STDR by 8% (HR = 0.92; 95% CI: 0.87–0.98) and as much as 24% of proliferative diabetic retinopathy (HR = 0.76; 95% CI: 0.64–0.90) [103].
Finally, in the LENS (Lowering Events in Non-proliferative retinopathy in Scotland) trial published in 2024, involving 1,151 patients with diabetes, Preiss et al. evaluated the effect of fenofibrate (145 mg) on the risk of occurrence of a primary endpoint involving the development of treatable diabetic retinopathy or maculopathy or treatment of retinopathy or maculopathy (vitreous injections, laser therapy, vitrectomy). After 4 years of follow-up, the risk of the primary endpoint was shown to be 27% lower in patients receiving fenofibrate (HR = 0.73; 95% CI: 0.58–0.91; aRR = 6.5%, NNT = 15). The incidence of any progression of retinopathy or maculopathy was significantly lower in the fenofibrate group compared to the placebo group (HR = 0.74; 95% CI: 0.61–0.90) and diabetic macular oedema (HR = 0.50; 95% CI: 0.30–0.84). The detailed results of the LENS study are summarized in Table III. It is noteworthy that the proven ophthalmic benefits of fenofibrate were greater in women (women HR = 0.64, men HR = 0.76), in patients with chronic kidney disease (eGFR < 60, HR = 0.51, eGFR ≥ 60, HR = 0.77), with better glycaemic control at study entry (HbA1c < 70 mmol/mol, HR = 0.68, HbA1c ≥ 70 mmol/mol non-significant effect), and after longer duration of fenofibrate use (less than 1 year – non-significant risk reduction of 30%, after 1 year HR = 0.74, 95% CI: 0.56–0.99) [104].
Table III
Effect of fenofibrate on the progression of diabetic retinopathy – results of the LENS study by Preiss et al. [104]

It thus appears that the beneficial effect of fenofibrate against the risk and progression of diabetic retinopathy is due to the pleiotropic mechanisms of action of this medicine [105–110], which are summarized in Figure 3. The available results of clinical trials and meta-analyses clearly indicate that fenofibrate can be used as an oral therapy to prevent the progression of diabetic retinopathy, an indication that has already been approved for this drug in Australia since December 2014 [111, 112].

Safety of fenofibrate
In the FIELD trial, patients randomized to the group taking fenofibrate showed an early increase in plasma creatinine levels that persisted throughout the 5-year study period (plasma creatinine levels 10–12 µmol/l higher than in the placebo group, p < 0.001). However, the overall long-term increase in plasma creatinine concentration was lower in the fenofibrate group than in the placebo group (7.9 µmol/l vs. 9.2 µmol/l, p = 0.01) (reducing the risk of diabetic nephropathy). After an 8-week washout phase, plasma creatinine levels were significantly lower in the fenofibrate group compared to the placebo group (p < 0.001). In parallel, a slower rate of eGFR decline was observed (p < 0.001). Very few participants withdrew from the study due to elevated plasma creatinine levels [113]. A meta-analysis involving more than 1,600 patients showed that combination therapy with statin and fenofibrate was as well tolerated as statin monotherapy [114]. Fenofibrate is a well-tolerated drug, what was also confirmed in the ACCORD trial and other available clinical trials [115, 116]. Fenofibrate therapy has a nephroprotective effect, as it reduces proteinuria (RR = 0.86; 95% CI: 0.76–0.98) in patients with and without diabetes treated for lipid disorders [117]. Moreover, fenofibrate reduces the risk of end-stage renal failure (HR = 0.76; 95% CI: 0.71–0.82) [118]. Fenofibrate also has a hepatoprotective effect, as it has shown beneficial effects in preventing and even reversing the progression of steatotic liver disease (SLD) [119]. The FIELD, ACCORD, ACCORDION or LENS trials have confirmed the safety of fenofibrate and the lack of significant risk of adverse effects related to increases in liver enzymes or creatine kinase or the risk of muscle side effects.
Summary and recommendations
In patients with type 2 diabetes, not only should we reduce the risk of cardiovascular complications as much as possible, through accurate risk stratification, avoiding underestimation errors that may exist in the currently used scales, but above all through optimal treatment, which also enables effective prevention of the occurrence of micro- and macroangiopathic complications. These complications per se further increase cardiovascular risk (e.g., nephropathy), but can also significantly reduce quality of life (deterioration or loss of vision in those with retinopathy). In the context of the available data on fenofibrate, the authors of this Position Paper are in no doubt about its role, not only in terms of reducing the risk of cardiovascular complications, but perhaps most importantly, in the prevention of micro- and macroangiopathic complications, particularly retinopathy. The available data on the efficacy of this medicine in the primary prevention of retinopathy (recommendation IIb C) are still inconclusive, but the two-eye analyses under the FIELD study, the ACCORD-EYE study, the LENS study and other available data, unequivocally point to an important role of this agent in patients with type 2 diabetes and diagnosed retinopathy to significantly reduce the risk of retinopathy progression, the need for ophthalmologic surgery or vision loss (recommendation I B). A summary of the updated recommendations for the management of patients with diabetes, including in the context of prevention of retinopathy, can be found in Table IV.
Table IV
Updated recommendations for the management of patients with diabetes, including in the context of prevention of diabetic retinopathy