Introduction
Liver cancer, especially hepatocellular carcinoma (HCC) is one of the 10 most common malignant tumours in the world, with high morbidity and mortality. The occurrence of HCC is a dynamic process of multigene involvement and multistage development. Liver cirrhosis induced by hepatitis and fatty liver is the main pathological basis [1, 2]. However, early patients with HCC often show atypical symptoms, therefore, an in-depth study on the key nodes will provide the novel strategies for the early diagnosis and targeted therapy of HCC.
Long non-coding RNAs (lncRNA), a class of non-coding RNA, participate in the regulation of gene expression in different ways, such as epigenetic, transcriptional, and post-transcriptional regulation [3]. Abnormal expression of lncRNA is reported to be involved in the control of a broad range of biological processes, thereby impacting differentiation, metabolism, and aging [4]. Meanwhile, lncRNA may act as a diagnostic marker in tumours and indicate the early prognosis and therapeutic response of tumour cells [5]. Compared with protein marker α-fetoprotein (AFP), lncRNA UCA1 has higher diagnostic efficacy in liver cancer. When combined UCA1 and JUN mRNA were used in the diagnosis of early HCC, the sensitivity and specificity were as high as 100% and 80%, respectively [6, 7].
So far, most studies show that lncRNA plays an extremely important role in HCC. However, the exact mechanism remains to be discovered. In this study, we screened for differentially expressed lncRNAs between normal and cancer samples by microarray analysis in HCC. Subsequently, we chose the most differentially expressed LncRNA TUG1 for further investigation. Our findings suggest that TUG1 and some of its target genes may contribute to the shorter survival time and poor prognosis. Our results may provide a clear direction for early diagnosis and treatment of HCC.
Material and methods
Microarray data
The GeneChip dataset of GSE14323 was obtained from the GEO database, which was employed to store second-generation sequencing and other forms of high-throughput functional genomics data. After quality inspection of the chip dataset, a total of 18 normal samples and 28 samples of HCC were retained for analysis.
A cohort from the TCGA (https://tcga-data.nci.nih.gov/tcga/) database containing 371 HCC patients and 50 controls as well as follow-up information, were included in our study.
Screening of differentially expressed lncRNAs
The statistical software R was used to screen for differentially expressed LncRNAs in the GSE14323 dataset. Fold change more than 2 and raw p-values less than 0.05 were selected as the cut-off criterion.
Identifying target genes of the differentially expressed lncRNA-TUG1
Firstly, screening and predicting target genes was performed, directly or indirectly regulated by TUG1, from common molecular interaction databases including starBase v2.0, lncBase v.2, miRTarBase, TarBase v7.0, and RAID v2.0.
Then Pearson’s correlation test was applied to filter the genes with significant association with TUG1 in the GSE14323 dataset and TCGA transcriptome data. Subsequently, the differentially expressed TUG1 target genes related to prognosis were screened based on the clinical information and gene expression profile of 370 patients with HCC in the TCCA database by survival analysis. The Limma package of statistical analysis software R was used to assess the differential co-expression genes in the GSE14323 dataset. A Wayne map was conducted for the first intersection of the above results. The raw p-values less than 0.05 were selected as statistically significant.
Finally, to obtain more reliable target genes, the two parts were combined with each other to retrieve the differentially expressed target genes of TUG1.
Construction of lncRNA-target gene interaction network
The Cytoscape platform was used to process biological network and data integration.
Cell lines and human HCC samples
Human liver cancer cell lines HepG2, Huh7, QGY-7703, Hep3B, and human normal liver cell line QSG-7701 were preserved in our laboratory. All cell lines were maintained in DMEM (Gibco, BRL) supplemented with 10% foetal bovine serum (FBS) (Gibco, BRL) in a humidified atmosphere containing 5% CO2 at 37°C. Fifteen cases of normal liver tissues and liver cancer tissue paraffin sections were obtained from the Department of Pathology of Xiangya Hospital. Five cases of normal liver tissues and 5 cases of liver cancer tissues were obtained from the key laboratory of tumour proteomics of the Ministry of Health of Xiangya Hospital and the Department of Hepatobiliary and Pancreatic surgery of Xiangya Hospital.
Correlation analysis of TUG1 and its target gene expression
Software R, SPSS18.0, and Graphad Prism version 5 were used for statistical analysis in the GSE14323 dataset and TCGA transcriptome data. qRT-PCR and siRNA transfection were applied in the abovementioned cells and tissues, which were detailed in supplementary materials. The primers of GAPDH, TUG1, HMGN4, VGLL4, and PIGC are listed in Table I. The siTUG1 and negative control were synthesised by Genechem, and the sequences are listed in Table I. Pearson’s correlation test was conducted to assess the correlation of TUG1 and its target genes in the above cell lines and tissues; the raw p-values less than 0.05 were recognised as statistically significant.
Table I
Sequences of primers and short RNA oligos
Predicting the effects of TUG1 and its target genes on the diagnosis and prognosis of HCC
The diagnosis of HCC was performed using clinical criteria and the findings obtained by B-mode ultrasonography (US), computed tomography (CT) angiography, or magnetic resonance imaging (MRI) [8, 9].
The statistical analysis was performed by SPSS 18.0 software or Graphad Prism version 5 in the TCCA cohort. The continuous data were presented as the mean ± standard deviation (SD). The mean values of two samples were compared by independent sample t test. Kaplan-Meier survival analysis was carried out by the log-rank method. The survival curve was used to describe the correlation between the target gene expression and the patients’ survival. Pearson correlation analysis was applied to analyse the expression of target genes and tumour stages, and receiver operating characteristic (ROC) curve analysis was performed to describe their diagnostic value for patients with liver cancer. The raw p-values less than 0.05 were recognised as statistically significant.
Supplementary data
Extraction and reverse transcription of RNA
Two micrograms of RNA were extracted from normal liver cell line QSG7701 and liver cancer cell line HepG2, Huh7, Hep3B, and QGY7703 for reverse transcription. One microlitre of Oligo (dT) primer was added in combination with DEPC water to a total volume of 12 μl, placed in a PCR instrument, and treated at 65°C for 5 min. Then, 1 μl reverse transcriptase inhibitor, 2 μl dNTP Mixture, 4 μl 5 × PrimeScript Buffer, and 1 μl reverse transcriptase was added to the PCR tube. The procedure was as follows: 42°C, 1 h and 70°C, 5 min; the reverse transcription cDNA solution was stored at 4°C.
The system of qPCR reaction was 15 μl, containing 0.3 μl cDNA solution, 6.6 μl aseptic water, 0.6 μl upstream and downstream primers, and 7.5 μl qPCR mixture. The total reaction system was calculated according to the cell type and gene number, and the corresponding premixed solution was added to the octahedral tube, then centrifuged and placed in the qPCR instrument. The specific procedure of fluorescence quantitative PCR with two-step method was as follows: denaturation at 95°C for 5 min; denaturation at 95°C for 30 s and annealing at 60°C for 30 s, a total of 40 cycles. The differential expression of target gene was calculated by 2^– ∆ ∆ C method.
Results
Prediction of lncRNA TUG1 target genes and construction of interaction network
Differentially expressed lncRNAs
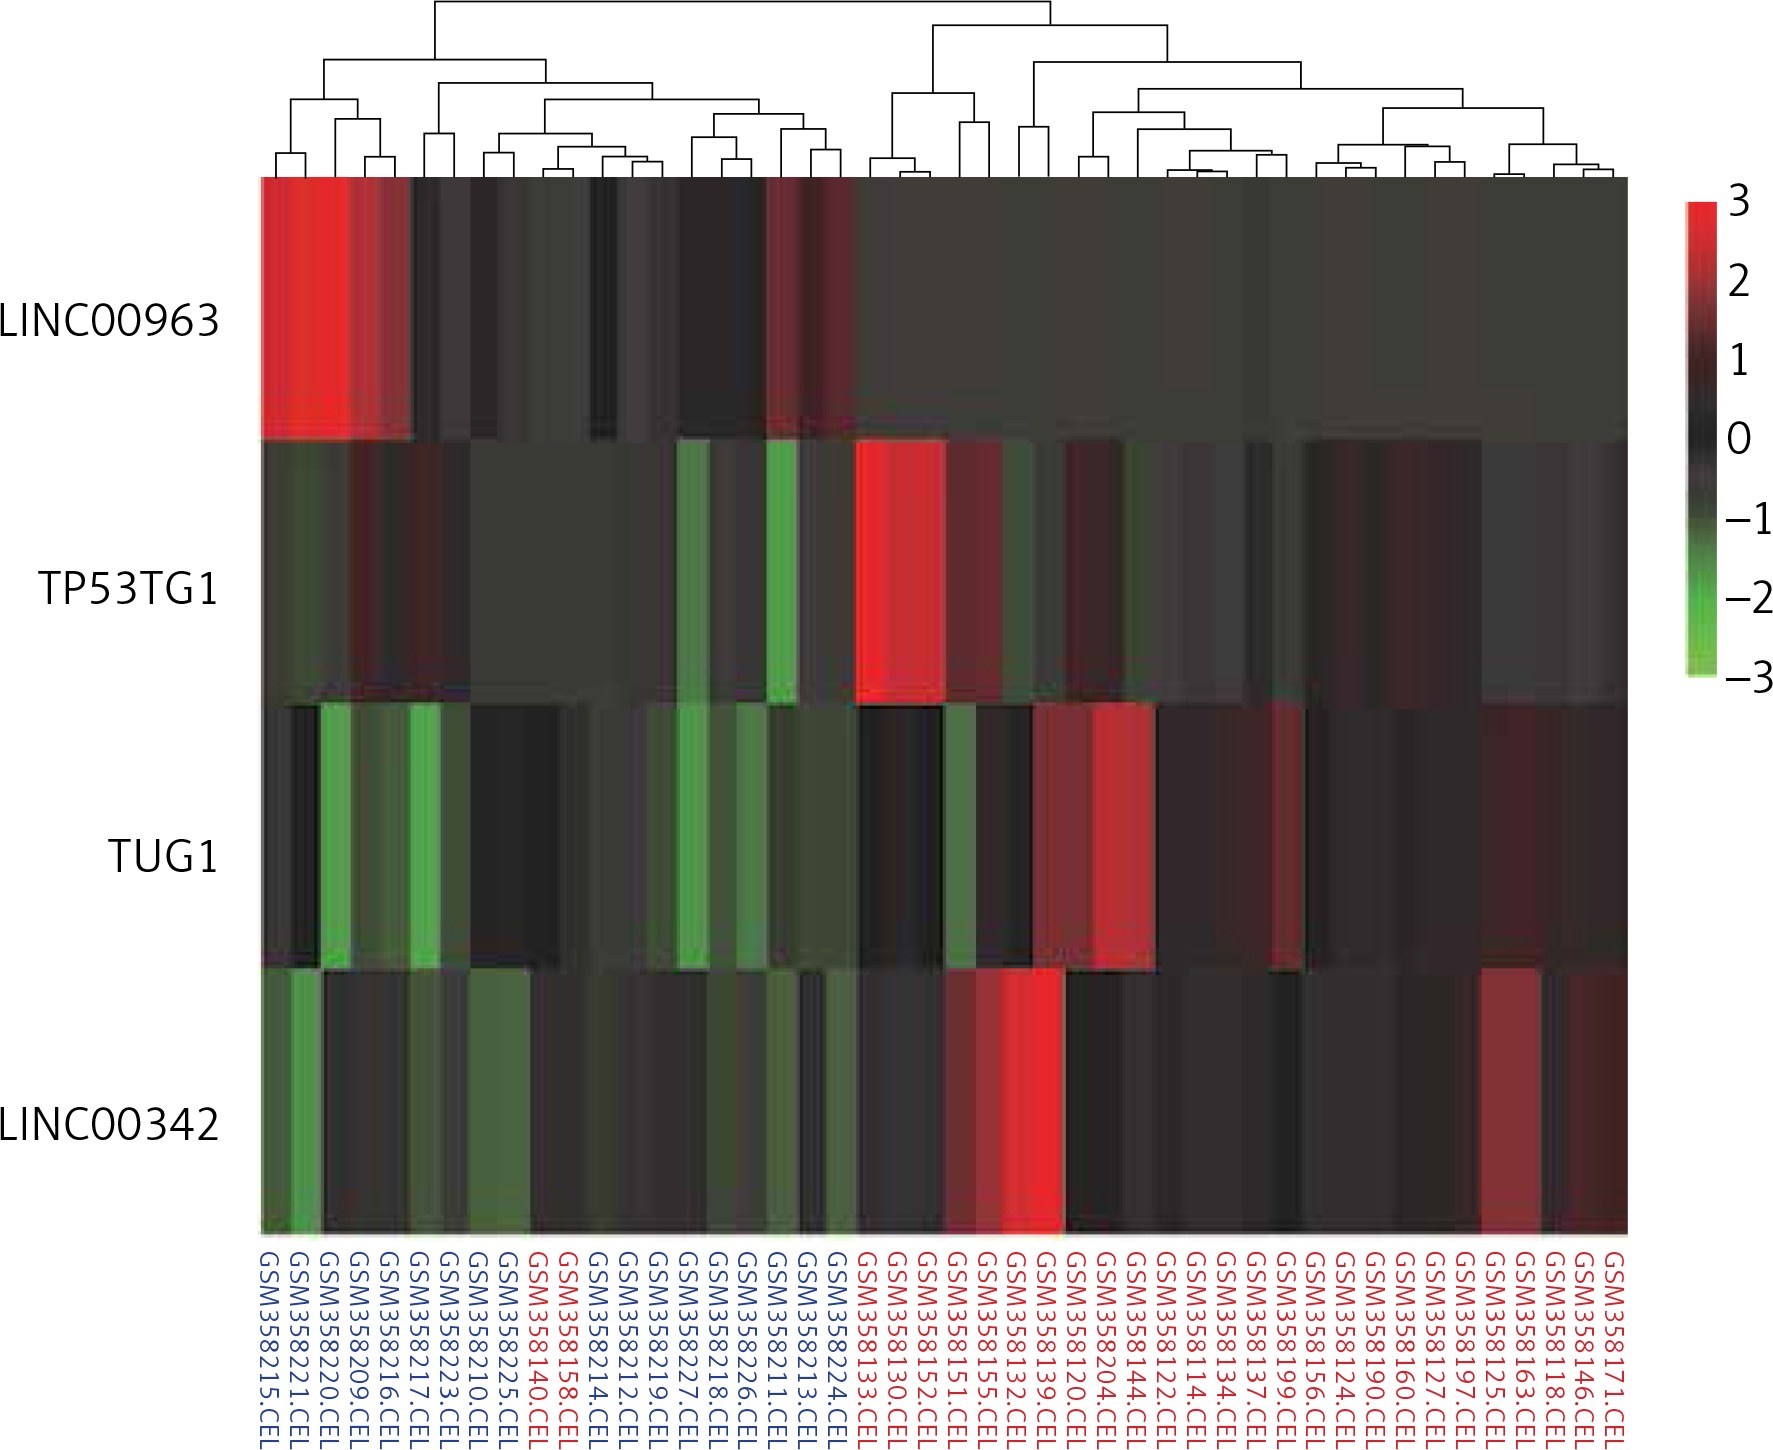
The top four differentially expressed LncRNAs (DELs) were identified in 18 normal samples and in 28 samples of HCC from the GSE14323 dataset, of which the lncRNA LINC00963 was underexpressed and the rest were significantly overexpressed in HCC (p < 0.05). TUG1 was the only lncRNA, with more than double up-regulated expression (Figure 1).
Figure 1
Heat map showing the top four DELs. The rows of the heat map represent genes, and the columns represent samples. Each column is colourised based on the expression level of that gene in that sample. Red bar: up-regulation; green bar: down-regulation; blue labelled sample: controls; red labelled sample: HCC
Identification of TUG1-target genes
A total of 56 miRNAs (including 31 up-regulated and 25 down-regulated miRNAs), which were directly regulated by TUG1, were screened from lncRNA-miRNA interaction databases: RAID, starBase v2.0, and lncBase v2.1. Putative miRNA targets were predicted using miRTarBase and TarBase v7.0, and a total of 5796 TUG1-related genes were obtained from the databases.
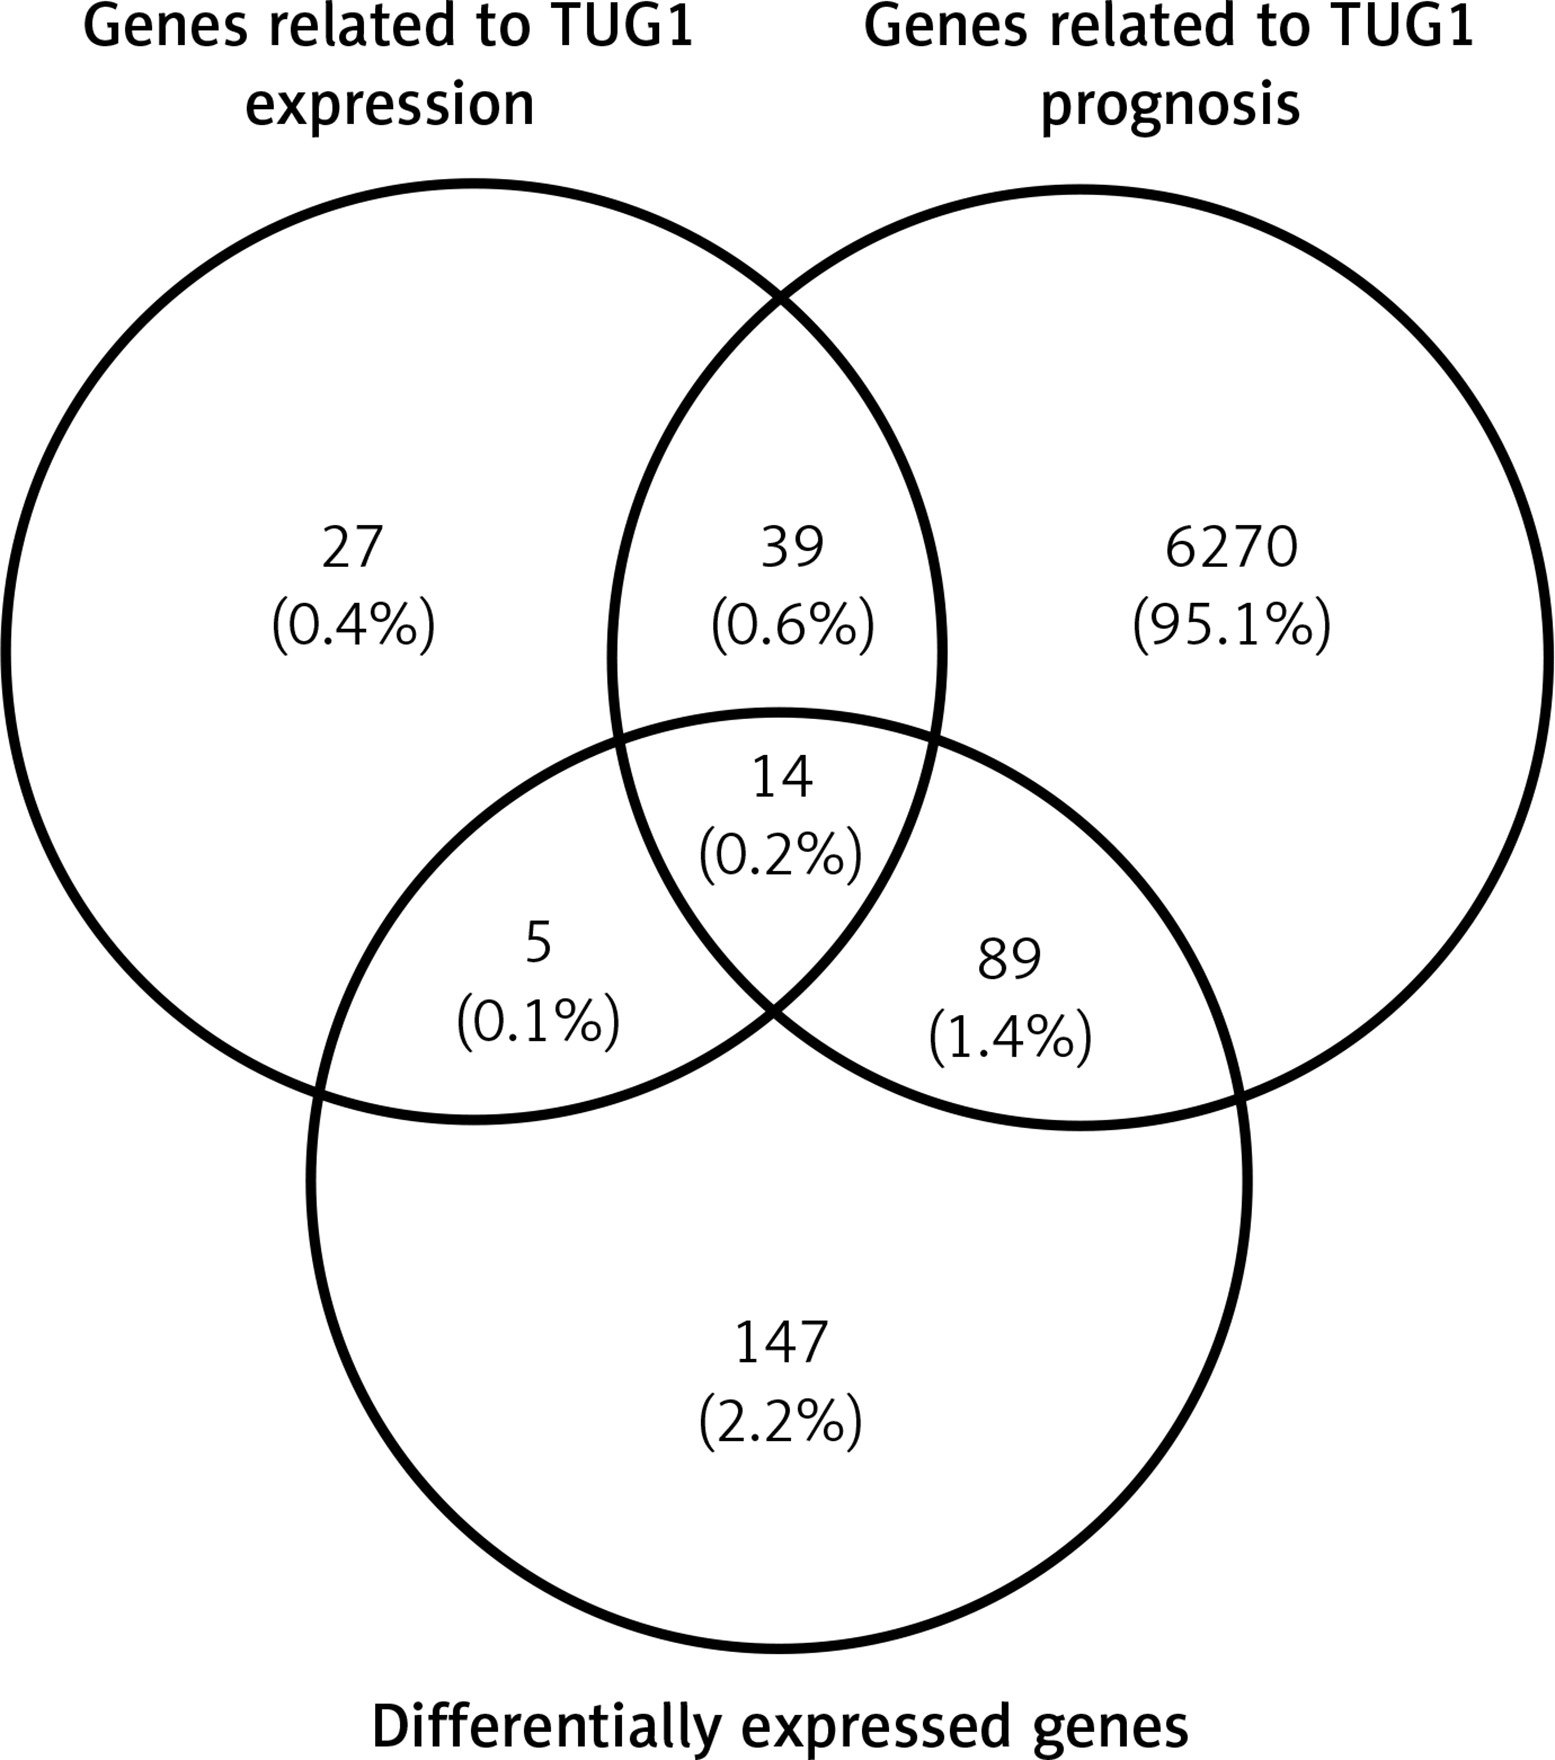
After analysing the GSE14323 gene expression profile and TCGA database, respectively, we found 374 genes and 5476 genes with significant correlation with TUG1 (p < 0.05, |R|0.5). Furthermore, 85 target gene groups associated with TUG1 expression were obtained after the first intersection (p < 0.05, |R|0.5). Through survival analysis of 370 patients with HCC in the TCGA database, 6412 genes were screened out, which were significantly related to undefined patient survival time (p < 0.05). In order to find the TUG1 target genes for the diagnosis of HCC, differential expression analysis was performed on the GSE14323 dataset and TCGA cohort. Finally, 211 co-up-regulated differentially expressed genes (p < 0.05 FC2) and 44 co-down-regulated differentially expressed genes (FC2) were screened out. Thereby, we constructed a Wayne map for subsequent intersection, from which 14 significant target genes were identified (Figure 2).
Construction of lncRNA TUG1 and its target gene interaction network
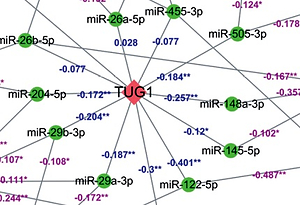
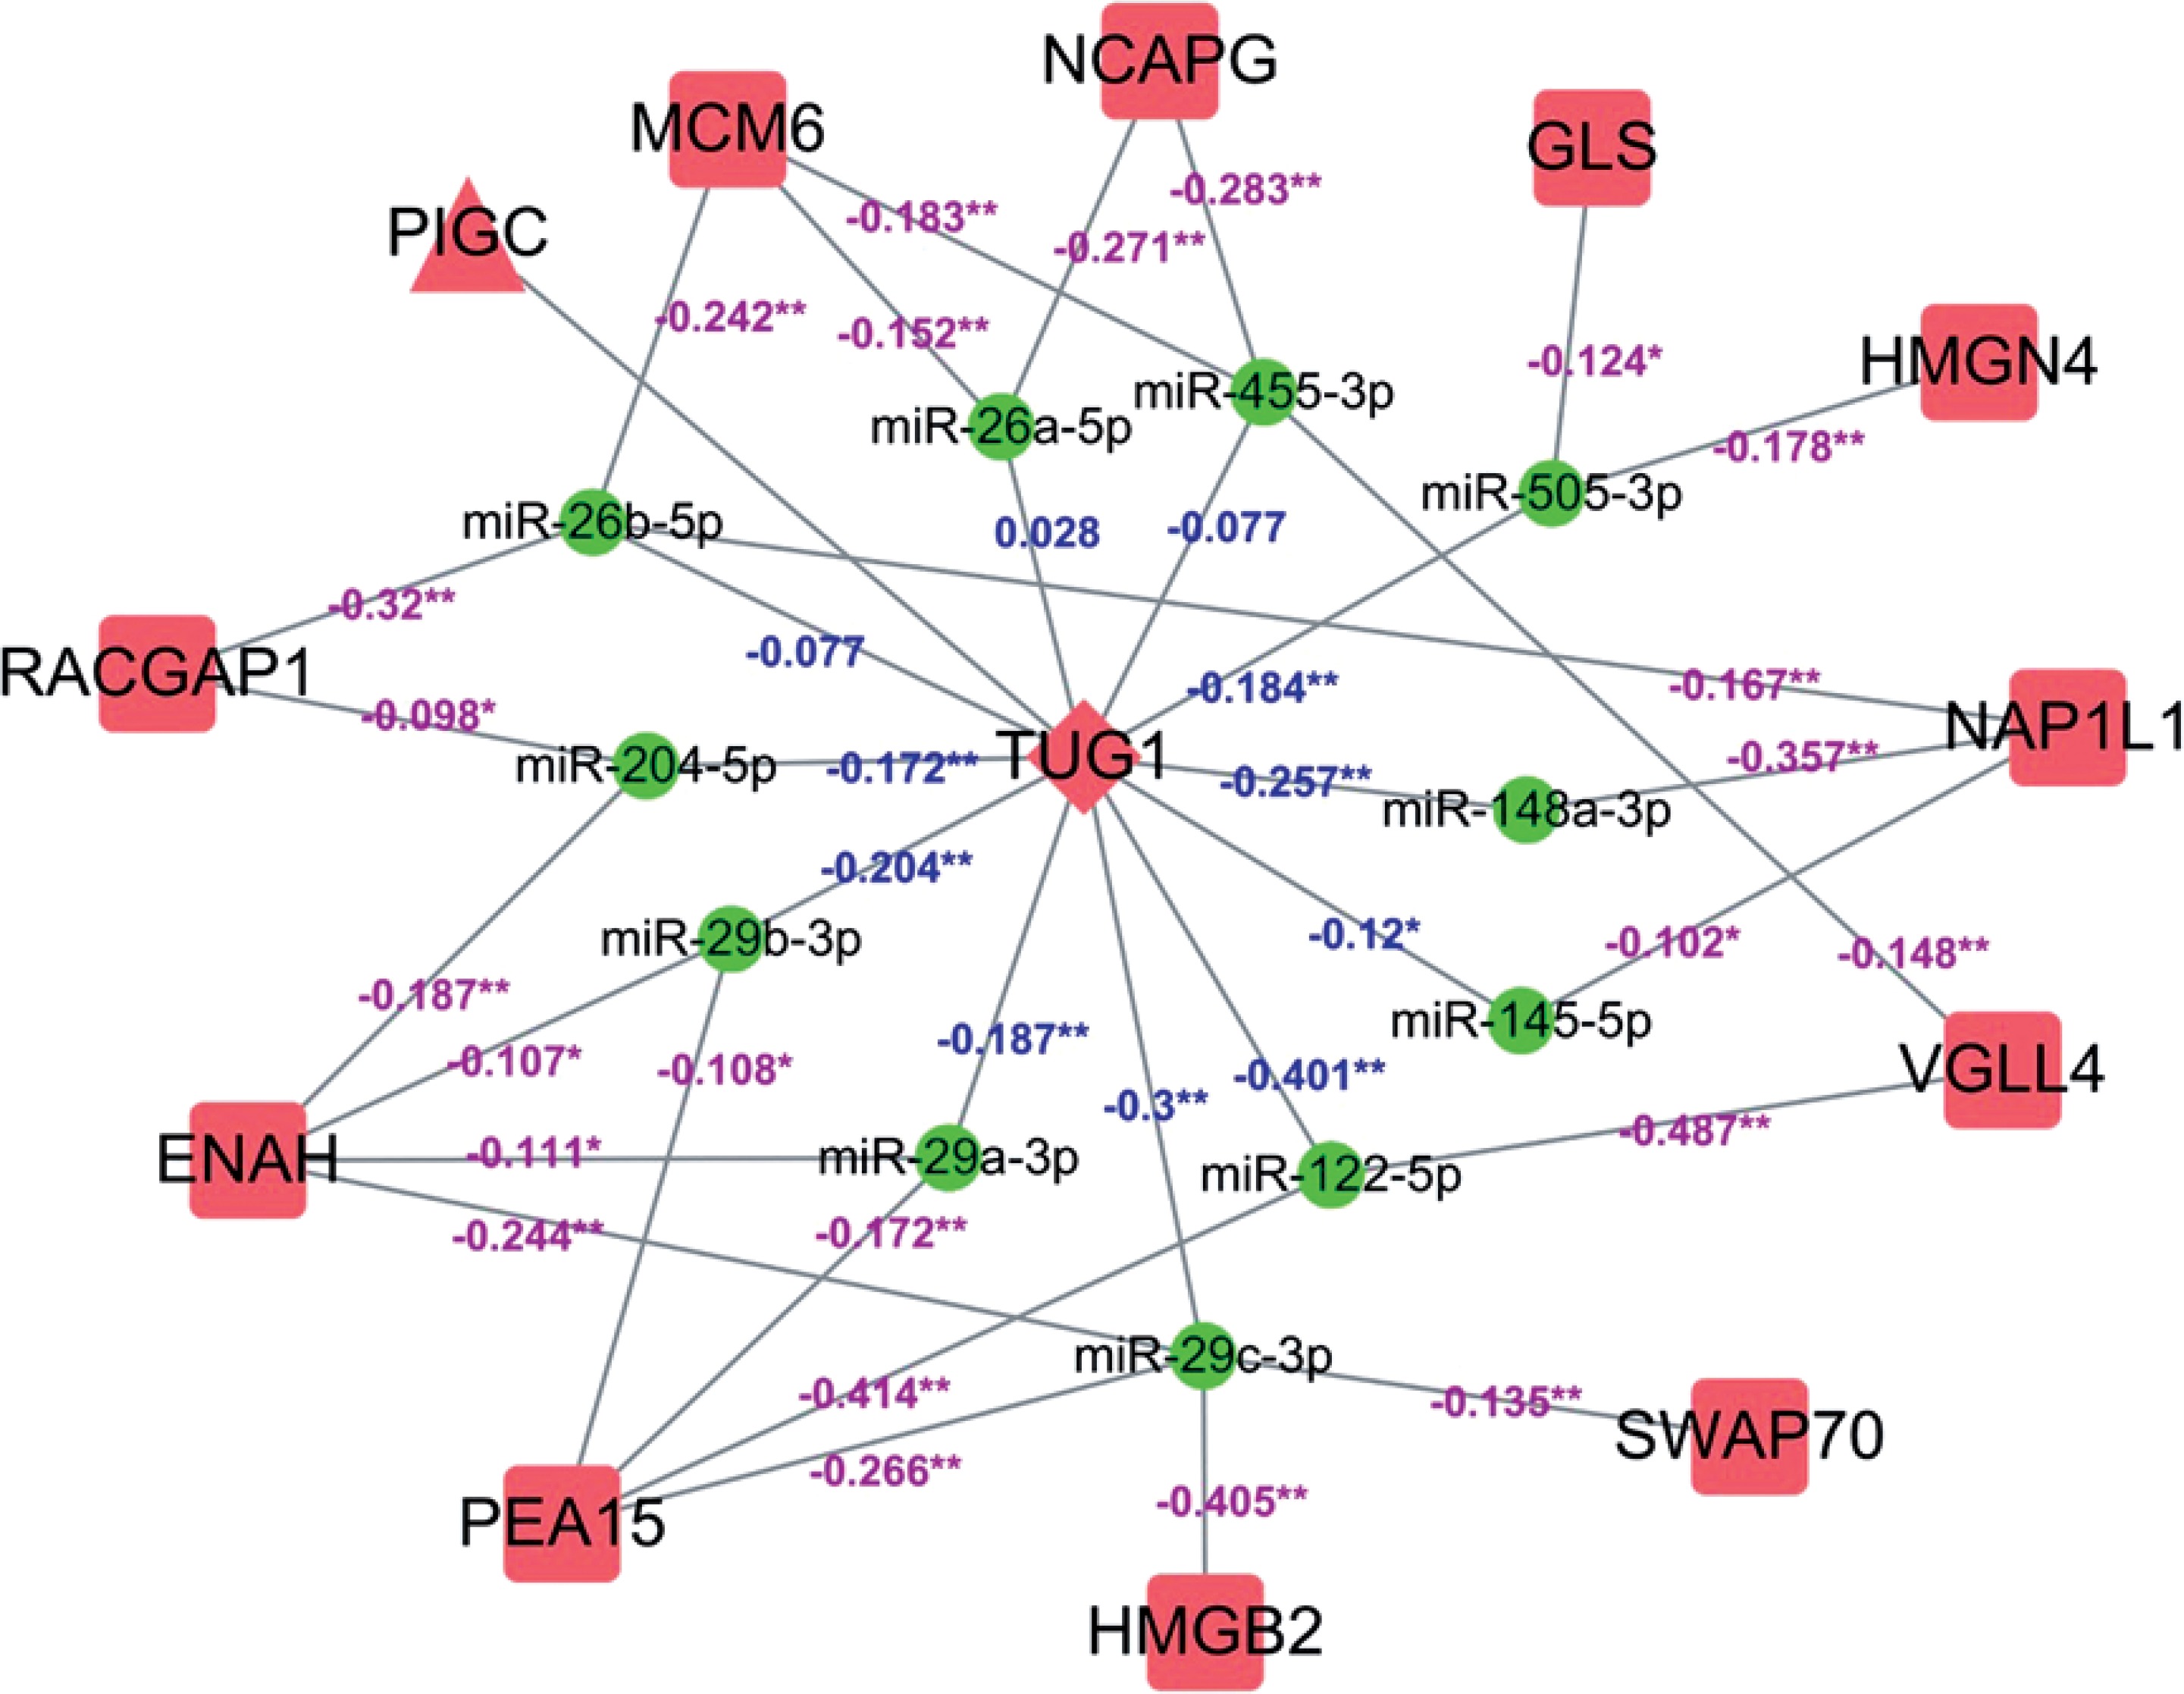
A total of 12 differentially expressed targeted genes related to prognosis of TUG1 were screened after the combination of 5796 and 14 genes mentioned above (p < 0.05, R ≥ 0.5, FC ≥ 2), of which 11 miRNAs were found to be down-regulated from TCGA transcriptome data (p < 0.05, R < 0). A regulatory network of TUG1 and its target genes were constructed with the help of Cytoscape software (Figure 3).
Figure 3
The molecular regulatory network for potential TUG1-driven genes. Square: mRNA; triangle: protein; round: miRNA; rhombus: lncRNA; red: significantly up-regulated expression; green: significantly down-regulated expression; purple number: correlation between miRNA and mRNA expression; blue number: correlation between TUG1 and miRNA expression; *p < 0.05; **p < 0.01
Correlation analysis of TUG1 and its target genes expression
Detecting correlation between TUG1 and its target genes in the
TUG1 database and its target genes were significantly up-regulated in 28 HCC patients from the GSE14323 dataset and 370 HCC patients in TCGA transcriptional sequencing data (p < 0.05, FC ≥ 2, Figures 4 A, B). The above 11 miRNAs were accordingly down-regulated in 364 HCC patients (p < 0.05, Figure 4 C).
Figure 4
Expression and correlation of TUG1 and its target genes in different databases. A – The expression levels of TUG1 and its target genes of 28 HCC patients and 18 corresponding controls in GSE14323 dataset, *p < 0.01. B – The expression levels of TUG1 and its target genes of 370 HCC patients and 50 corresponding controls in TCGA transcriptional sequencing dataset, *p < 0.01. C – The expression levels of miRNAs adsorbed by TUG1 of 364 HCC patients and 50 corresponding controls in TCGA database,*p < 0.01. D – The correlation of TUG1 and its target genes in TCGA transcriptional sequencing data. E – The correlation between four co-expression genes assembles expression levels. Red round: co-expression genes; black number: correlation between co-expression genes
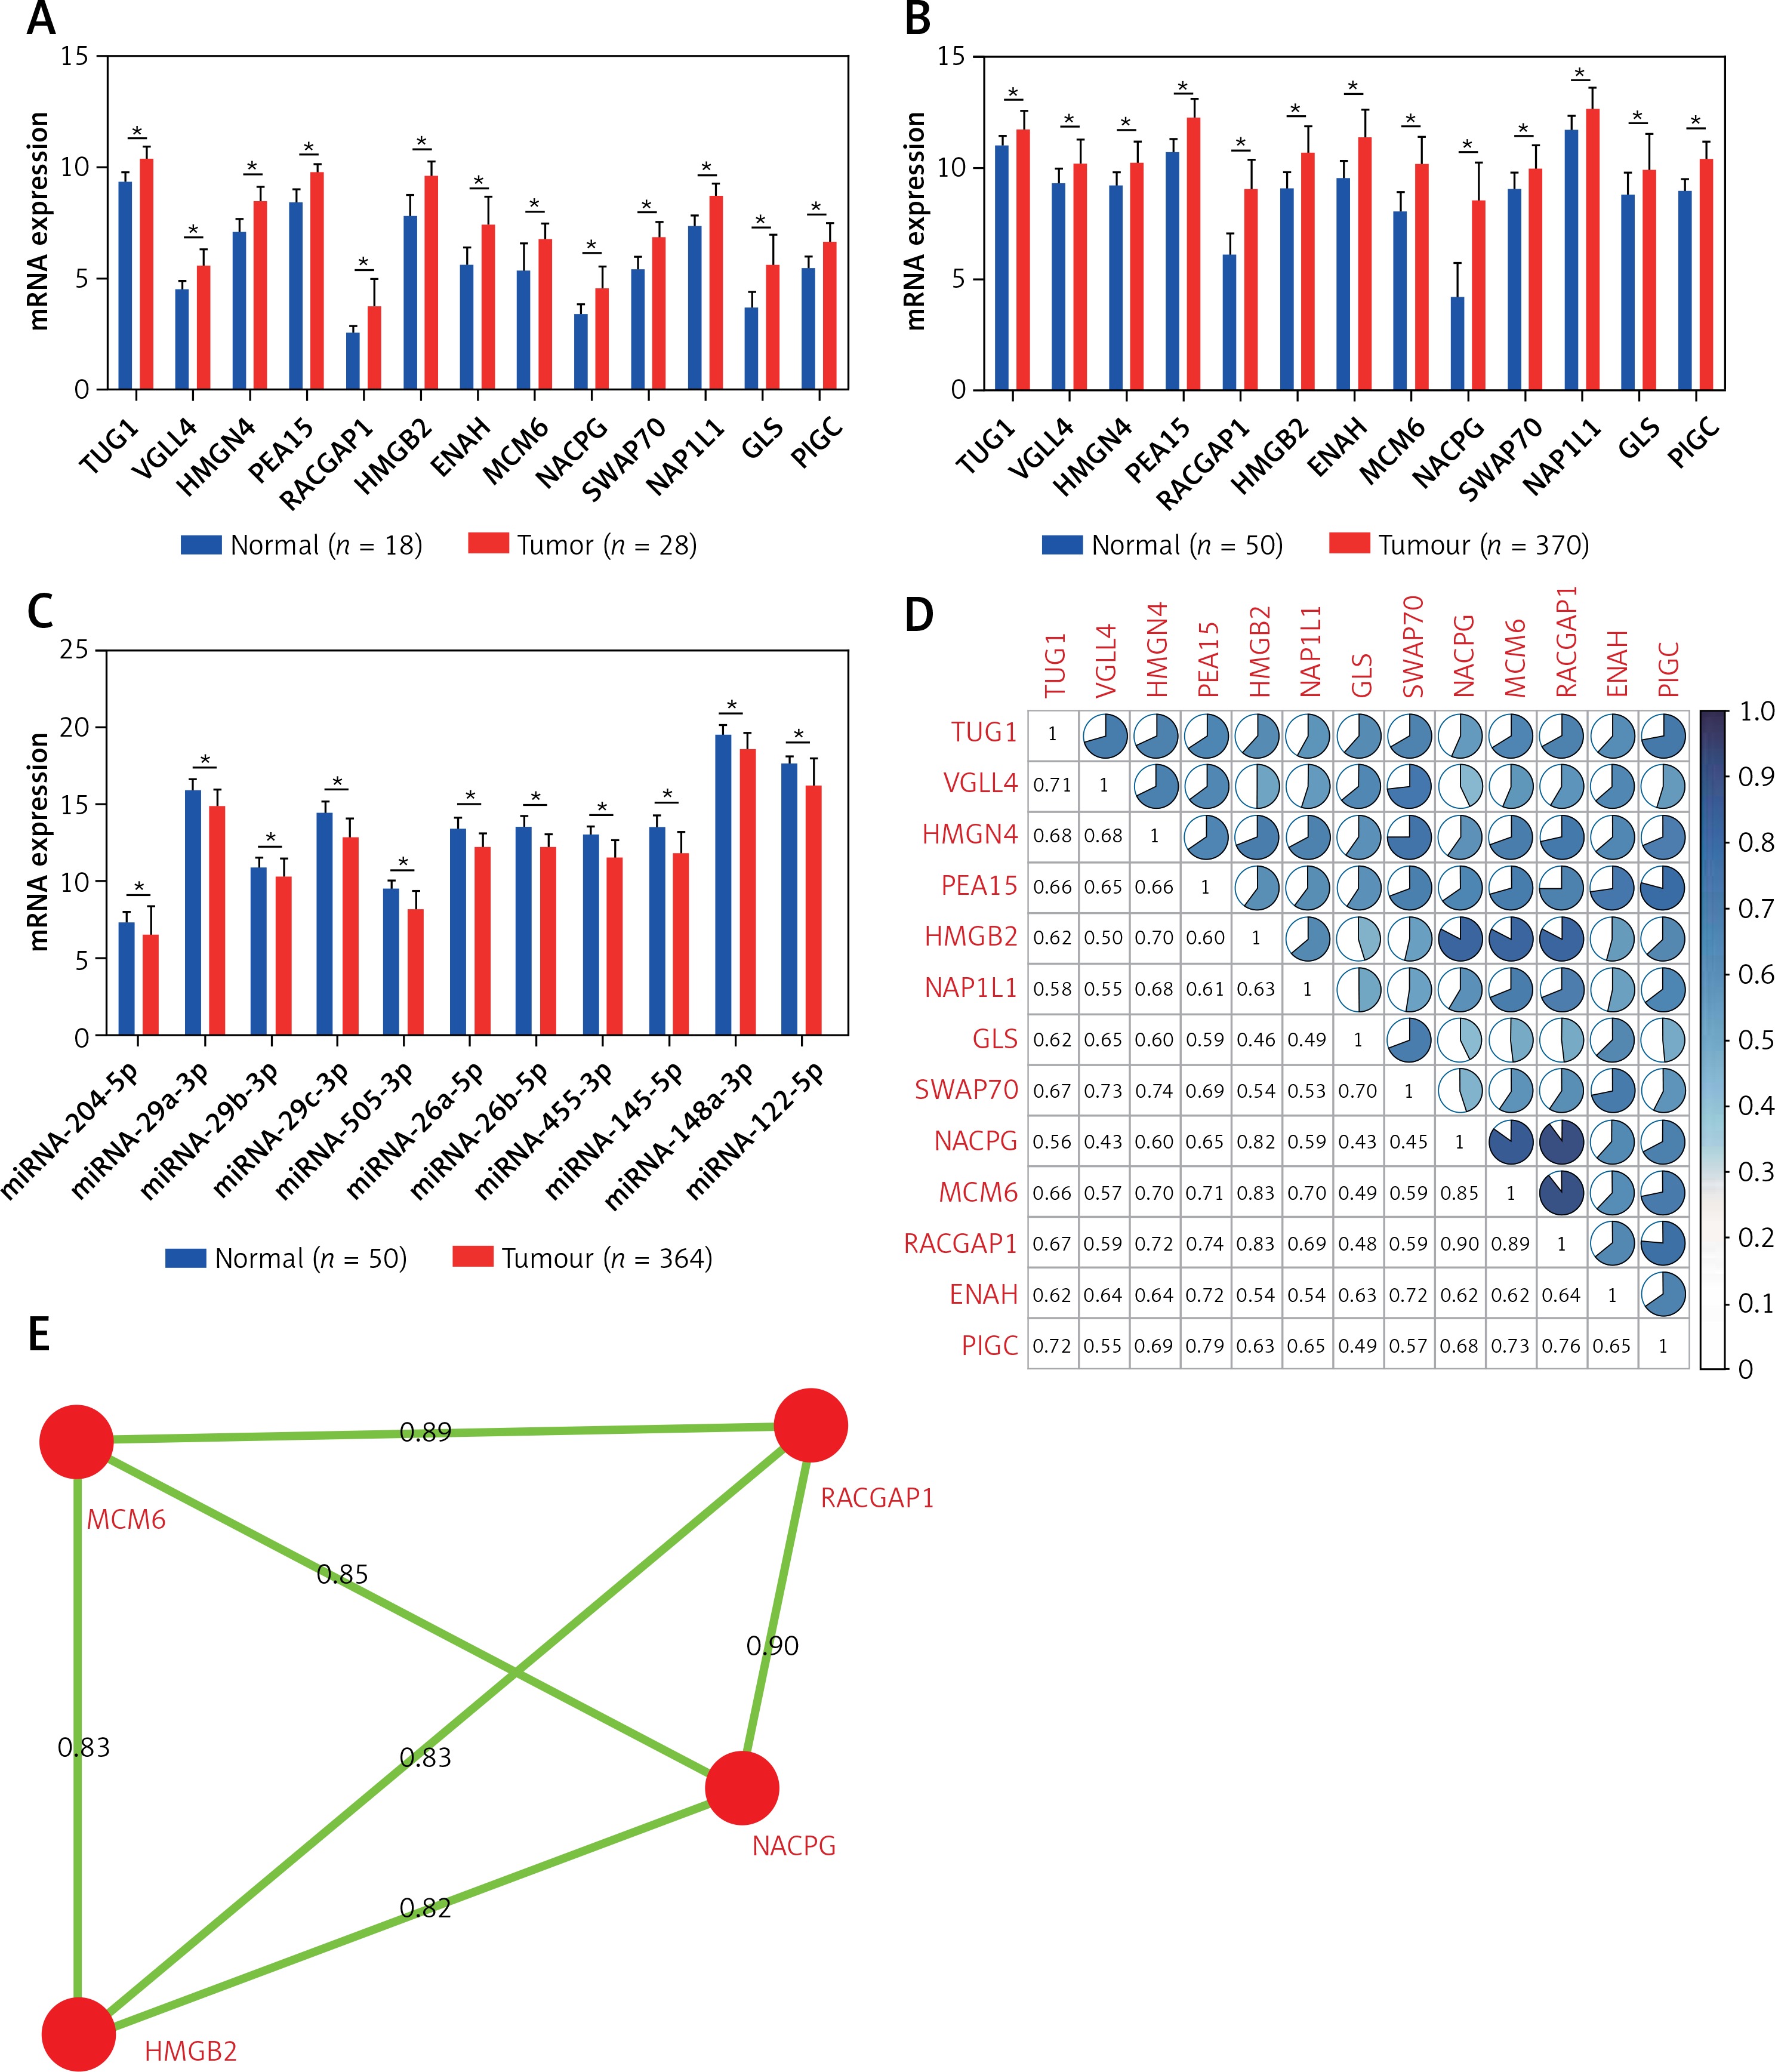
The correlation of TUG1 and its target genes were analysed in 50 normal liver tissues and 370 liver cancer tissues from TCGA transcriptional sequencing data, and the results are shown in Figure 4 D (p < 0.05, R ≥ 0.4). In addition, the top four co-expression gene assemblies including HMGB2 and NCAPG (R = 0.82), MCM6 (R = 0.83), RACGAP1 (R = 0.83), MCM6 and NCAPG (R = 0.85), RACGAP1 and NCAPG (R = 0.9), and MCM6 (R = 0.89) were also found (Figure 4 E). This suggests that HMGB2, NCAPG, MCM6, and RACGAP1 may be regulated by the same upstream regulatory factor, TUG1, and participate in the same or similar pathways in the pathogenesis of HCC.
Detecting correlation between TUG1 and its target genes in cell lines
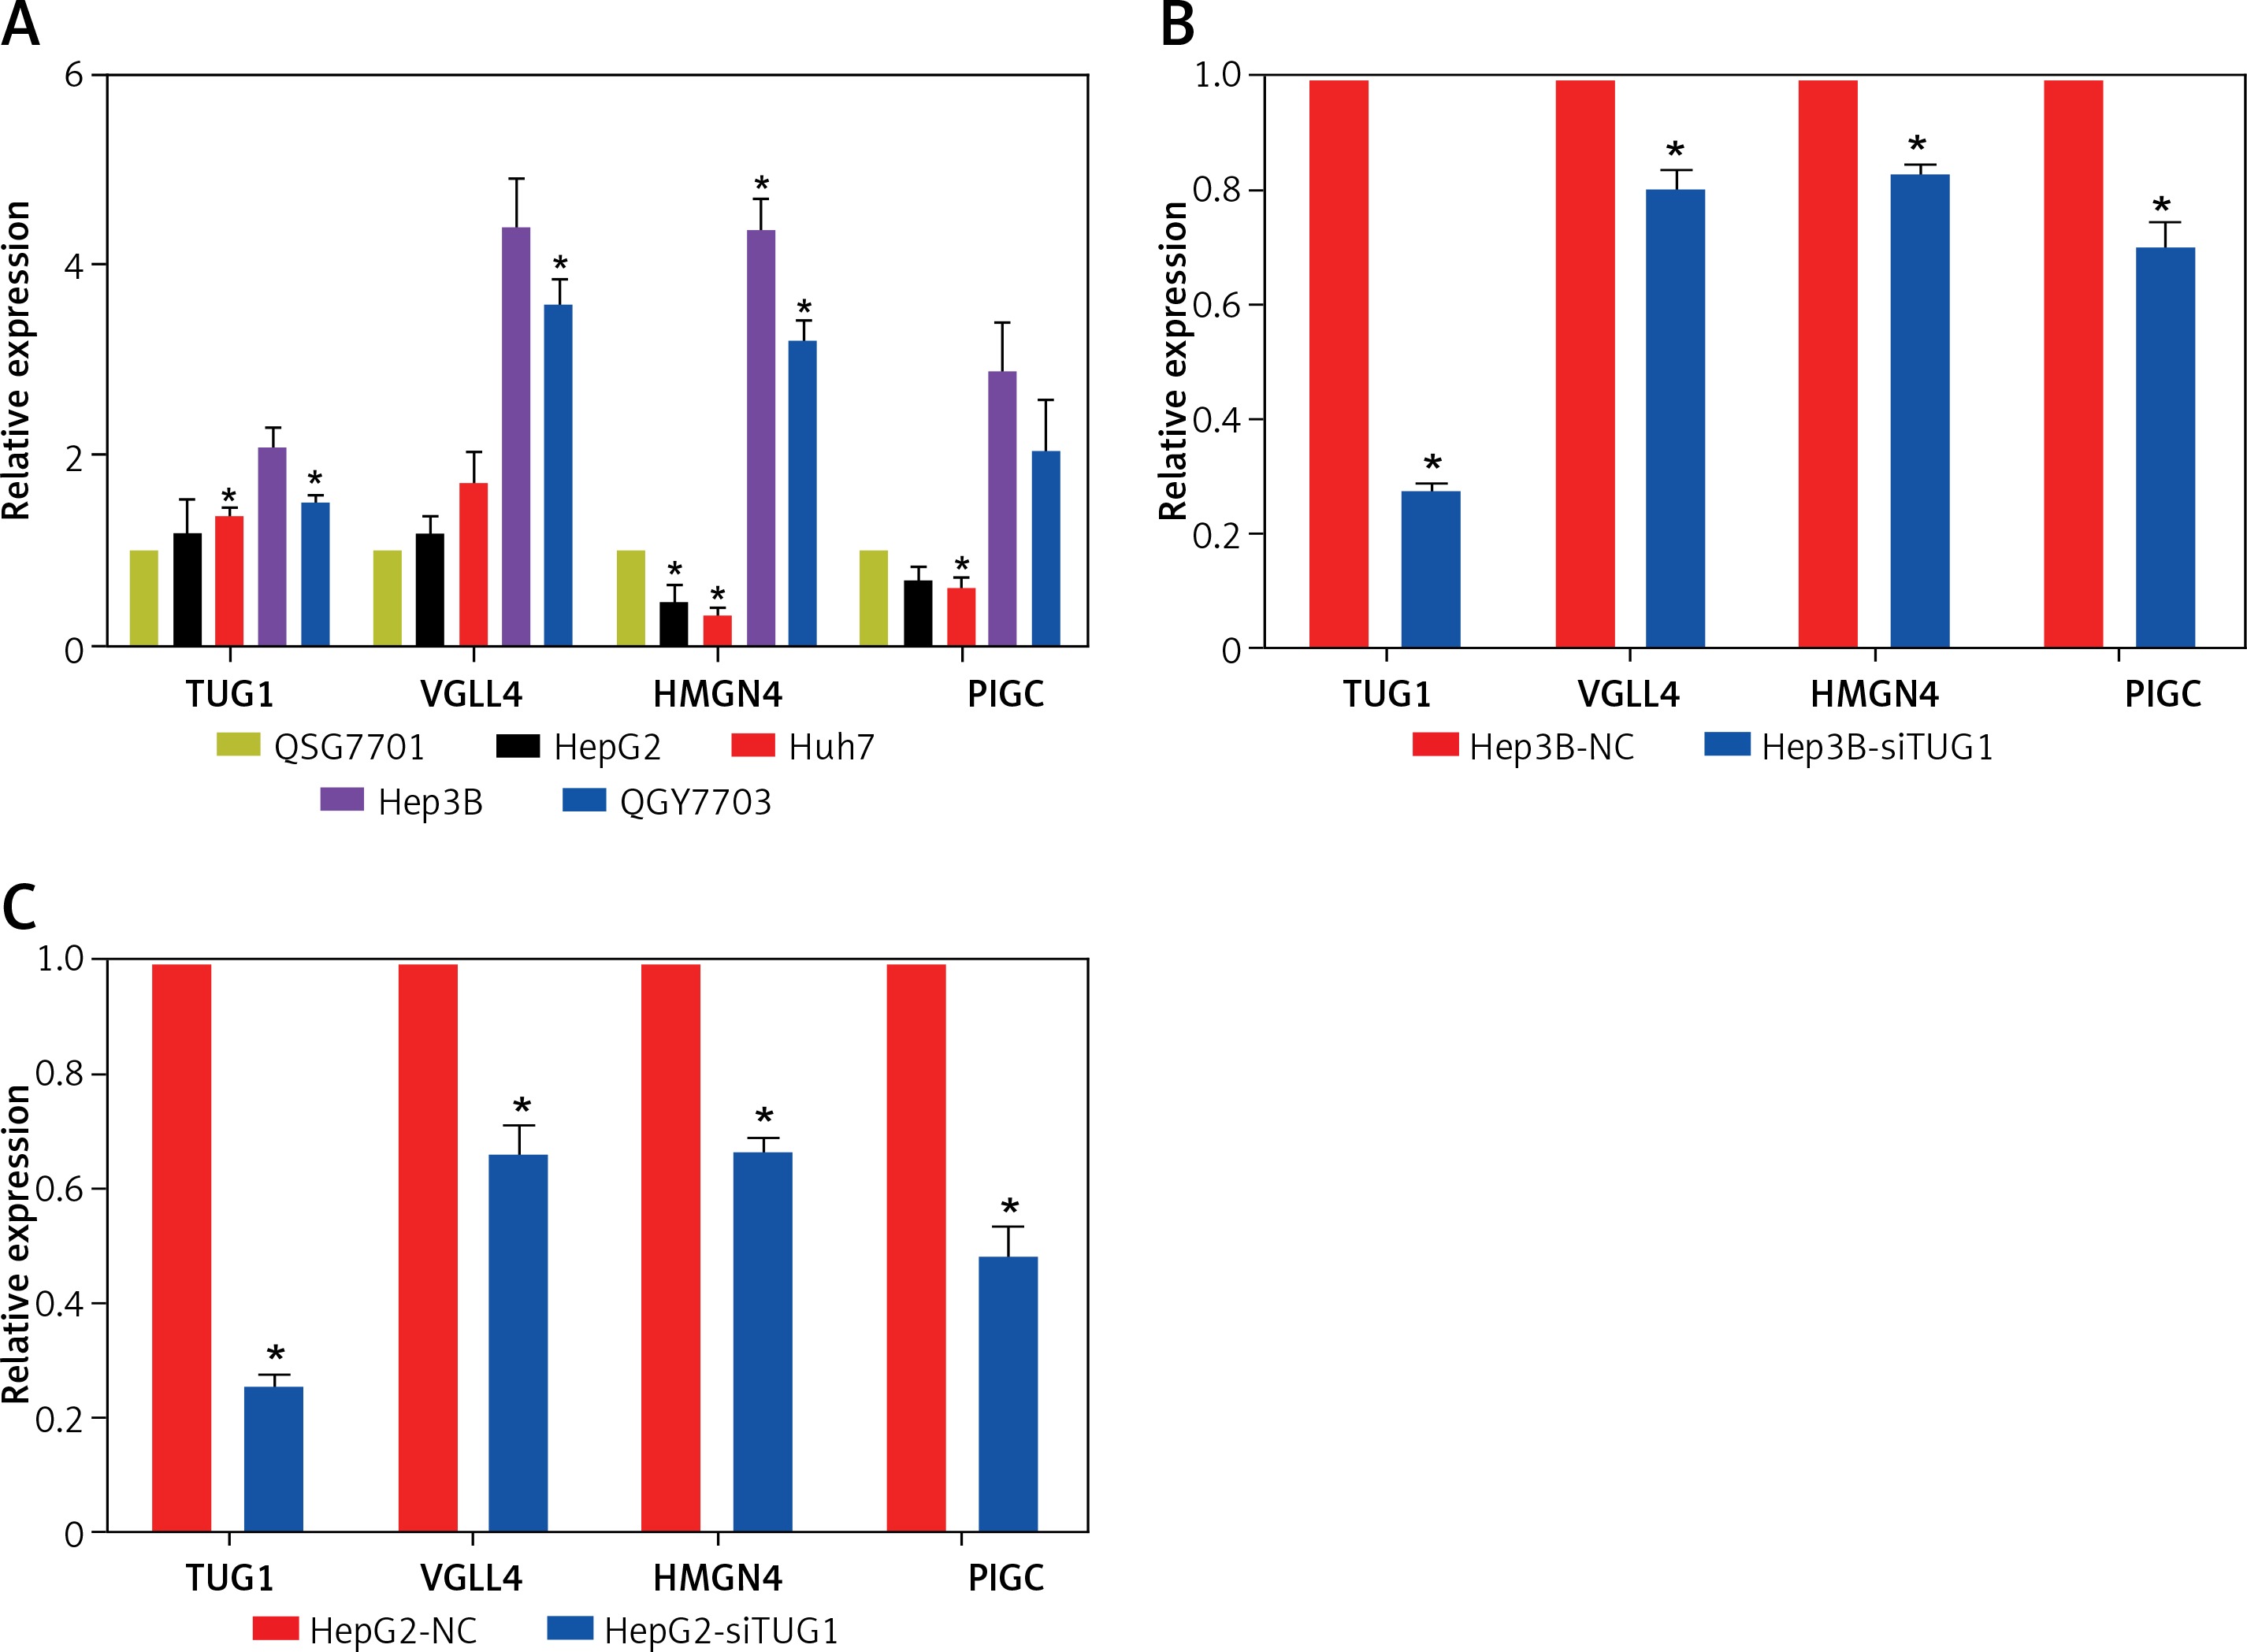
The expression levels of TUG1, VGLL4, PIGC, and HMGN4 mRNA were detected in normal liver cell line and hepatoma cell lines, respectively, and the results of qRT-PCR showed that TUG1 and VGLL4 were highly expressed in HepG2, Huh7, Hep3B, and QGY7703 compared with normal liver cell line (QSG7701). However, as shown in Figure 5 A, HMGN4 and PIGC were down-regulated in HepG2 and Huh7, but up-regulated in QGY7703 and Hep3B. To further demonstrate the interaction of TUG1 and the three target genes, siRNA was used to interfere with the expression of TUG1 in hepatoma cell lines (HepG2 and Hep3B). The results show that VGLL4, PIGC, and HMGN4 expression decreased significantly (p < 0.05, Figures 5 B, C), indicating that TUG1 could regulate the expression of VGLL4, PIGC, and HMGN4.
Figure 5
Expression and correlation of TUG1 and its target genes in different cell lines. A – Expression levels of TUG1, VGLL4, PIGC, and HMGN4 in HepG2, Huh7, Hep3B, QGY7703, and QSG7701 cell lines, *p < 0.05. B – mRNA levels of TUG1 and its three target genes in Hep3B-siTUG1 and control cells as indicated, *p < 0.05. C – mRNA levels of TUG1 and its three target genes in HepG2-siTUG1 and control cells as indicated, *p < 0.05
Detecting correlation between TUG1 and its target genes in tissues
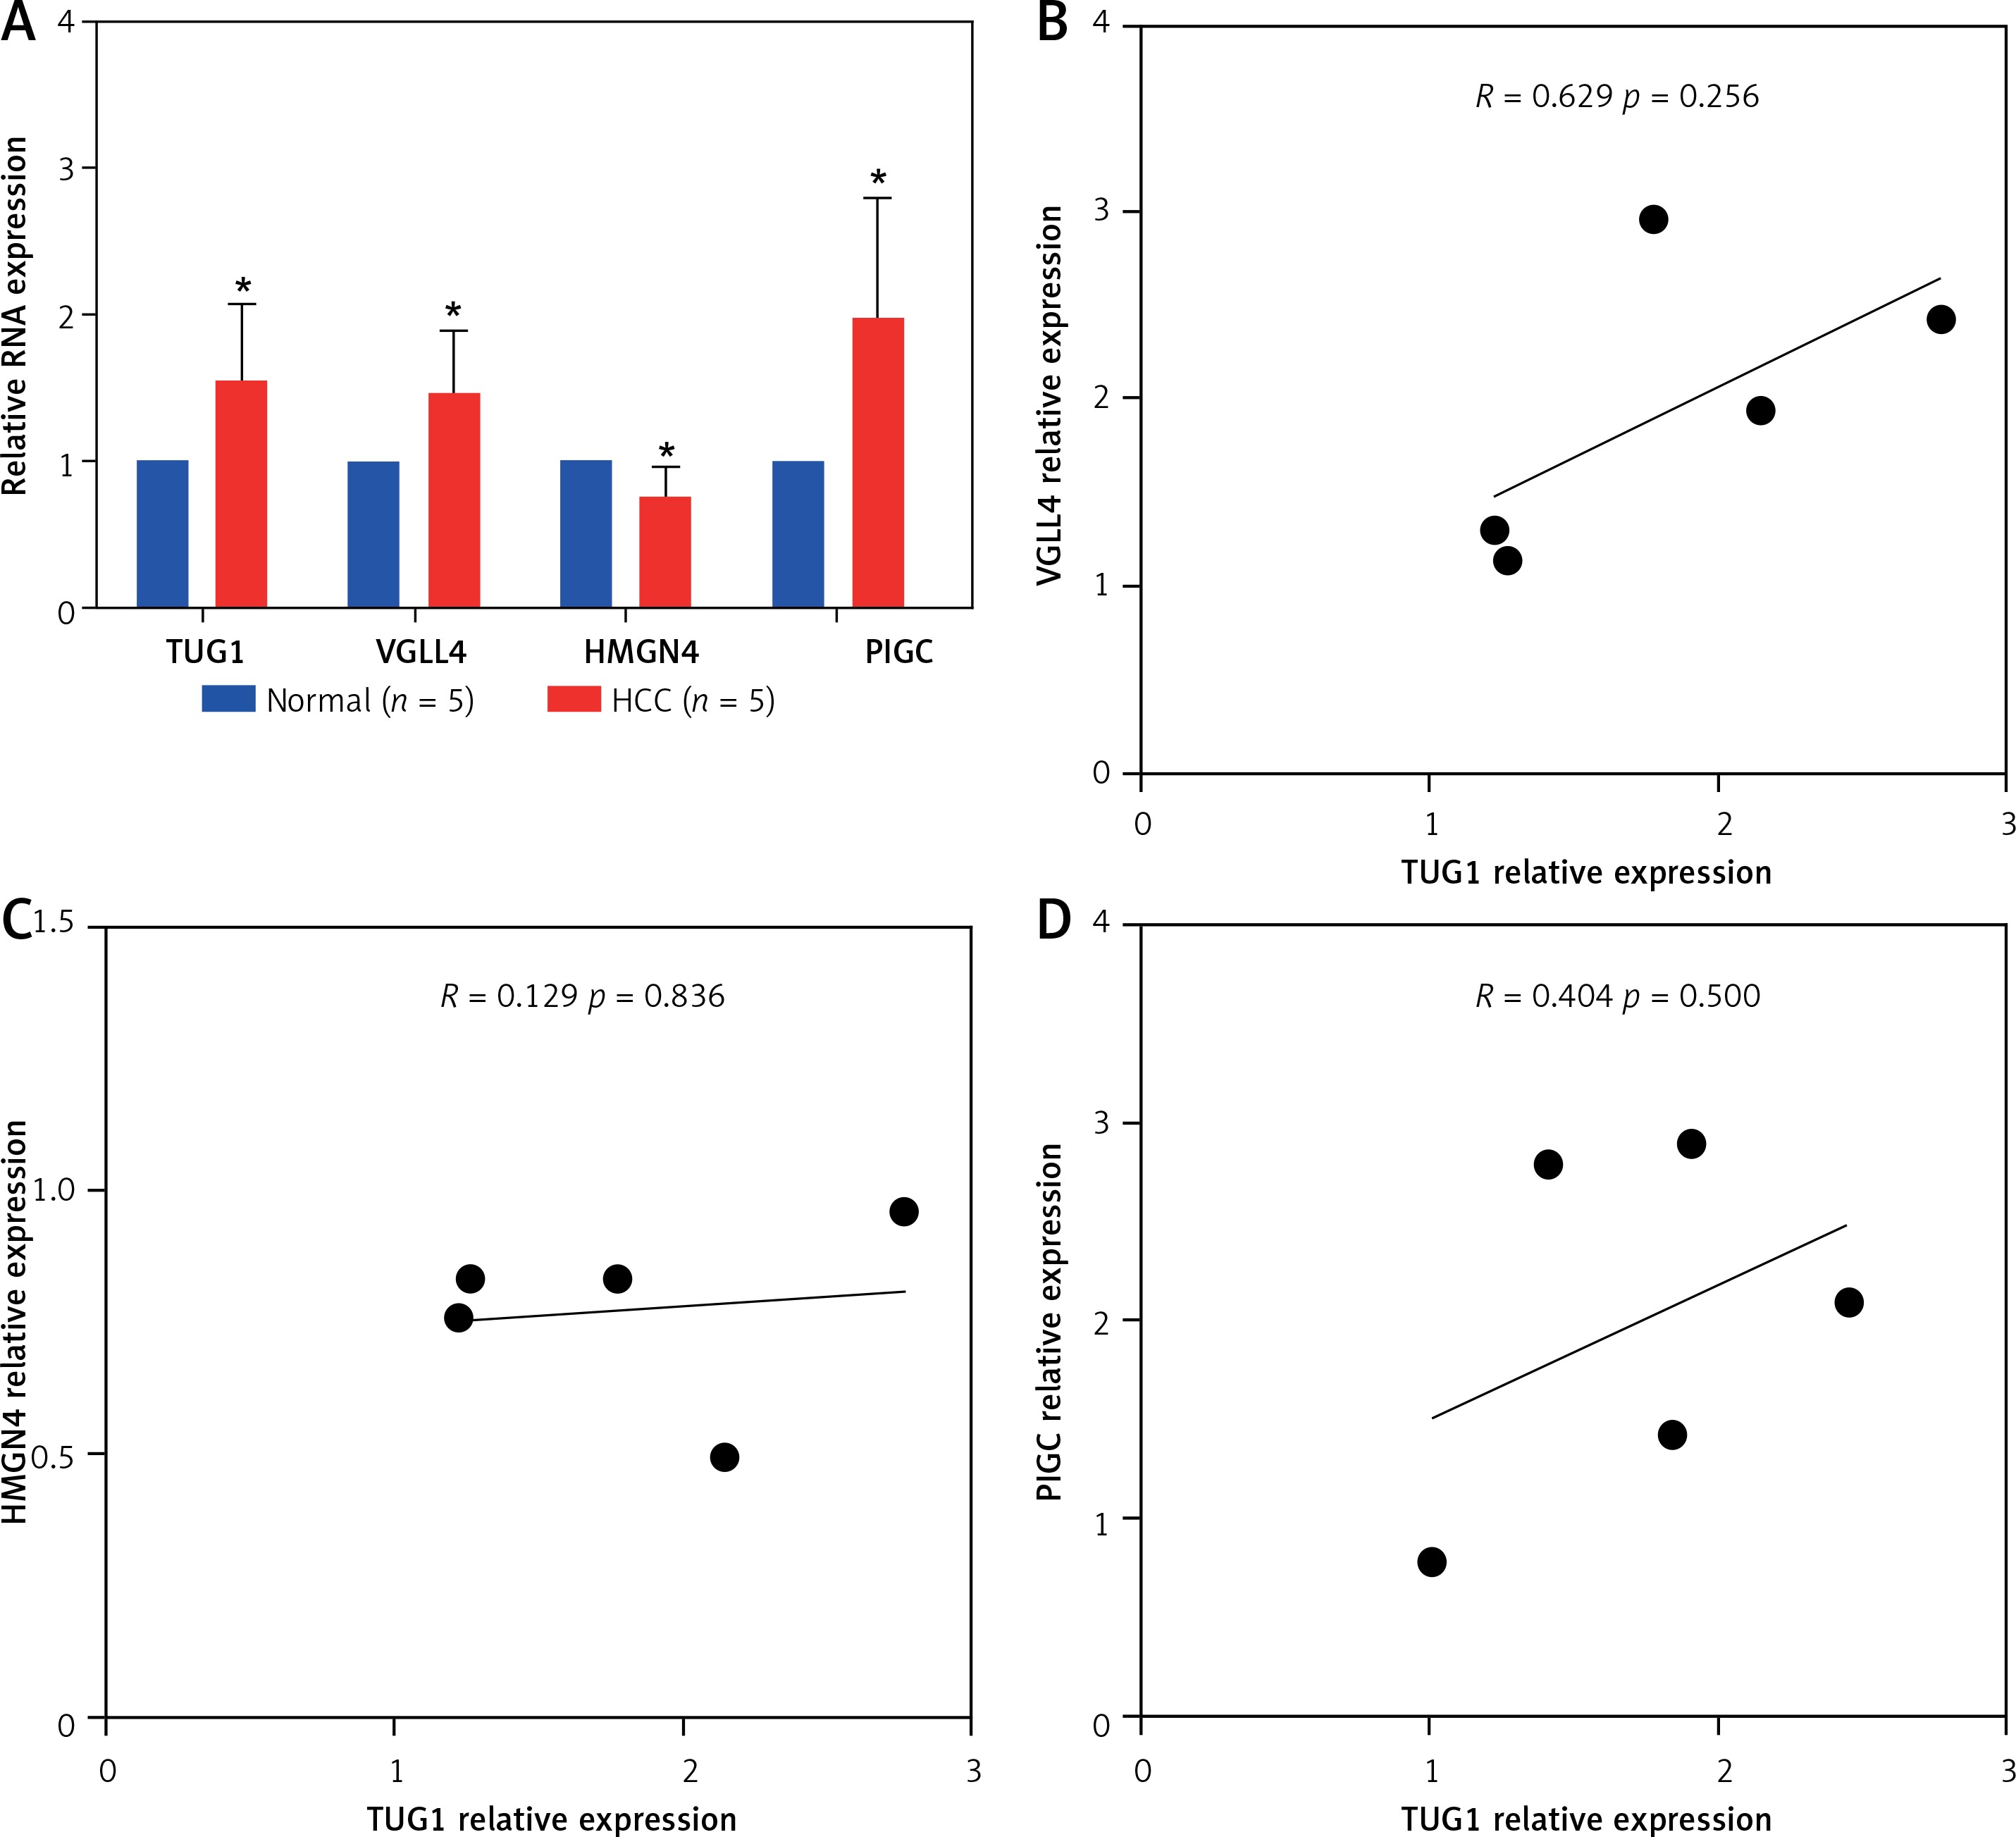
To determine the effect of TUG1 over expression on the target genes, TUG1 and VGLL4, HMGN4, PIGC levels were assessed by qRT-PCR in five HCC tissues and five matched normal tissues, as shown in Figure 6 A. The expression levels of TUG1, VGLL4, and PIGC in HCC tissues were significantly higher than those in normal tissues (p < 0.05), while HMGN4 expression was down-regulated in HCC tissues (p < 0. 05, Figure 6 A). Correlation analysis showed that TUG1 and VGLL4 had a higher correlation than the rest; however, the p value was not significant, but this result requires more samples for validation (Figures 6 B–D).
Figure 6
Expression and correlation of TUG1 and its target genes in HCC. A – Expression levels of TUG1, VGLL4, HMGN4, and PIGC in 5 HCC tissues and 5 matched normal tissues, *p < 0.05. B – The correlation between TUG1 and VGLL4 in 5 HCC tissues, R = 0.629; p = 0.265. C – The correlation between TUG1 and HMGN4 in 5 HCC tissues, R = 0.129; p = 0.836. D – The correlation between TUG1 and PIGC in 5 HCC tissues, relative expression
The function of TUG1 target genes and their clinical significance
Prognostic and diagnostic values of TUG1 and its target genes in HCC
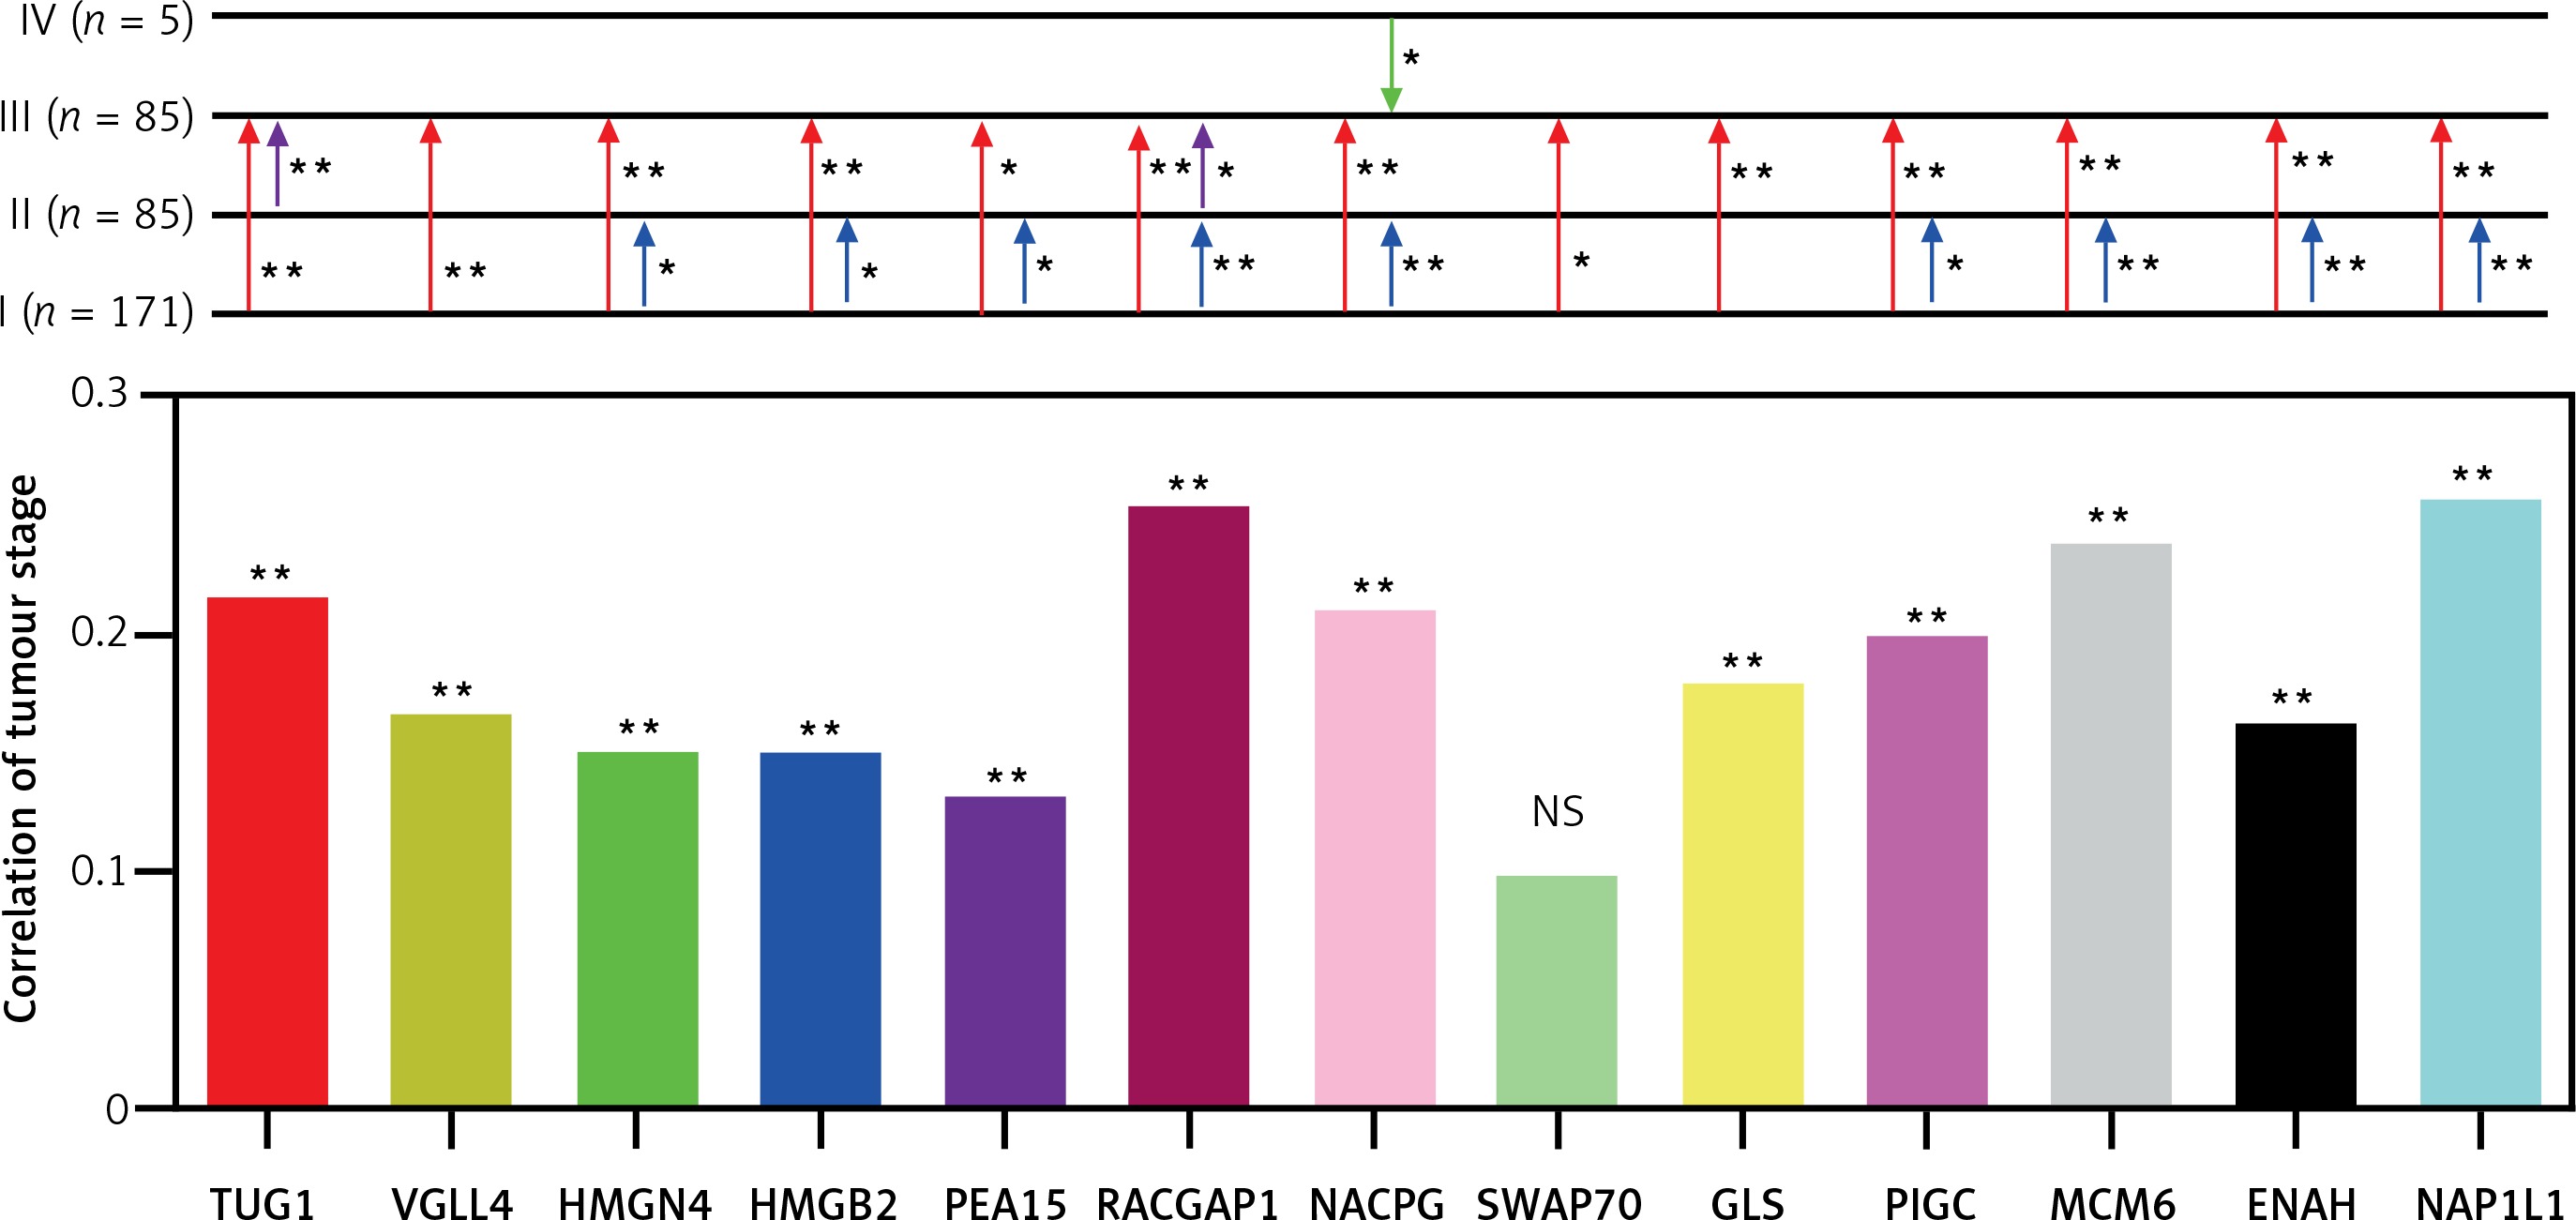
Based on TCGA transcriptome cohort of HCC-indicating patients, a univariate survival analysis was performed to access the clinical features (Table II). We summarised from Table II that features including age, sex, race, and body mass index (BMI) had no significant effect on survival time (p > 0.05), whereas TUG1 and its 12 target genes were independent prognostic risk factors according to univariate COX regression analysis (Table III). At the same time, Kaplan-Meier analysis showed that the higher expression of TUG1 and its 12 target genes could significantly predict shorter survival time (p < 0.05, n = 130, Figures 7 A–M). We also found an interesting fact: that sex and race were significantly associated with the 5-year survival rate of HCC, revealing that the females had higher survival rates than the males and the Asians tended to have the worst 5-year survival rates (p < 0.05, Table II). In order to analyse the correlation between the target genes and tumour stages, we filtered 171 patients with stage I, 85 with stage II, 85 with stage III, and five with stage IV of HCC for Pearson’s correlation analysis, and found that the expression of SWAP70 had no significant correlation with tumour stage, while the expression of TUG1 and its other 11 target genes were positively correlated with tumour stages (p < 0.05, Figure 8), which suggested that TUG1 and its target genes could not only participate in tumour development but also promote the progression of malignancy, thus affecting the survival time of patients with liver cancer.
Table II
Single-variable survival analysis of clinical features of HCC
Table III
Univariate COX regression analysis of TUG1 and its target genes
Figure 7
Kaplan–Meier analysis of TUG1 and its target genes in TCGA transcriptional sequencing dataset of HCC. The high expression of TUG1 and its 12 target genes could significantly predict shorter survival time of HCC patients. A – TUG1, p = 0.001. B – VGLL4, p < 0.001. C – HMGN4, p < 0.001. D – PIGC, p = 0.001. E – SWAP70, p = 0.008. F – RACGAP1, p < 0.001. G – PEA15, p < 0.001. H – NCAPG, p < 0.001. I – NAP1L1, p < 0.001. J – MCM6, p < 0.001. K – HMGN4, p < 0.001. L – GLS, p = 0.02. M – ENAH, p < 0.001
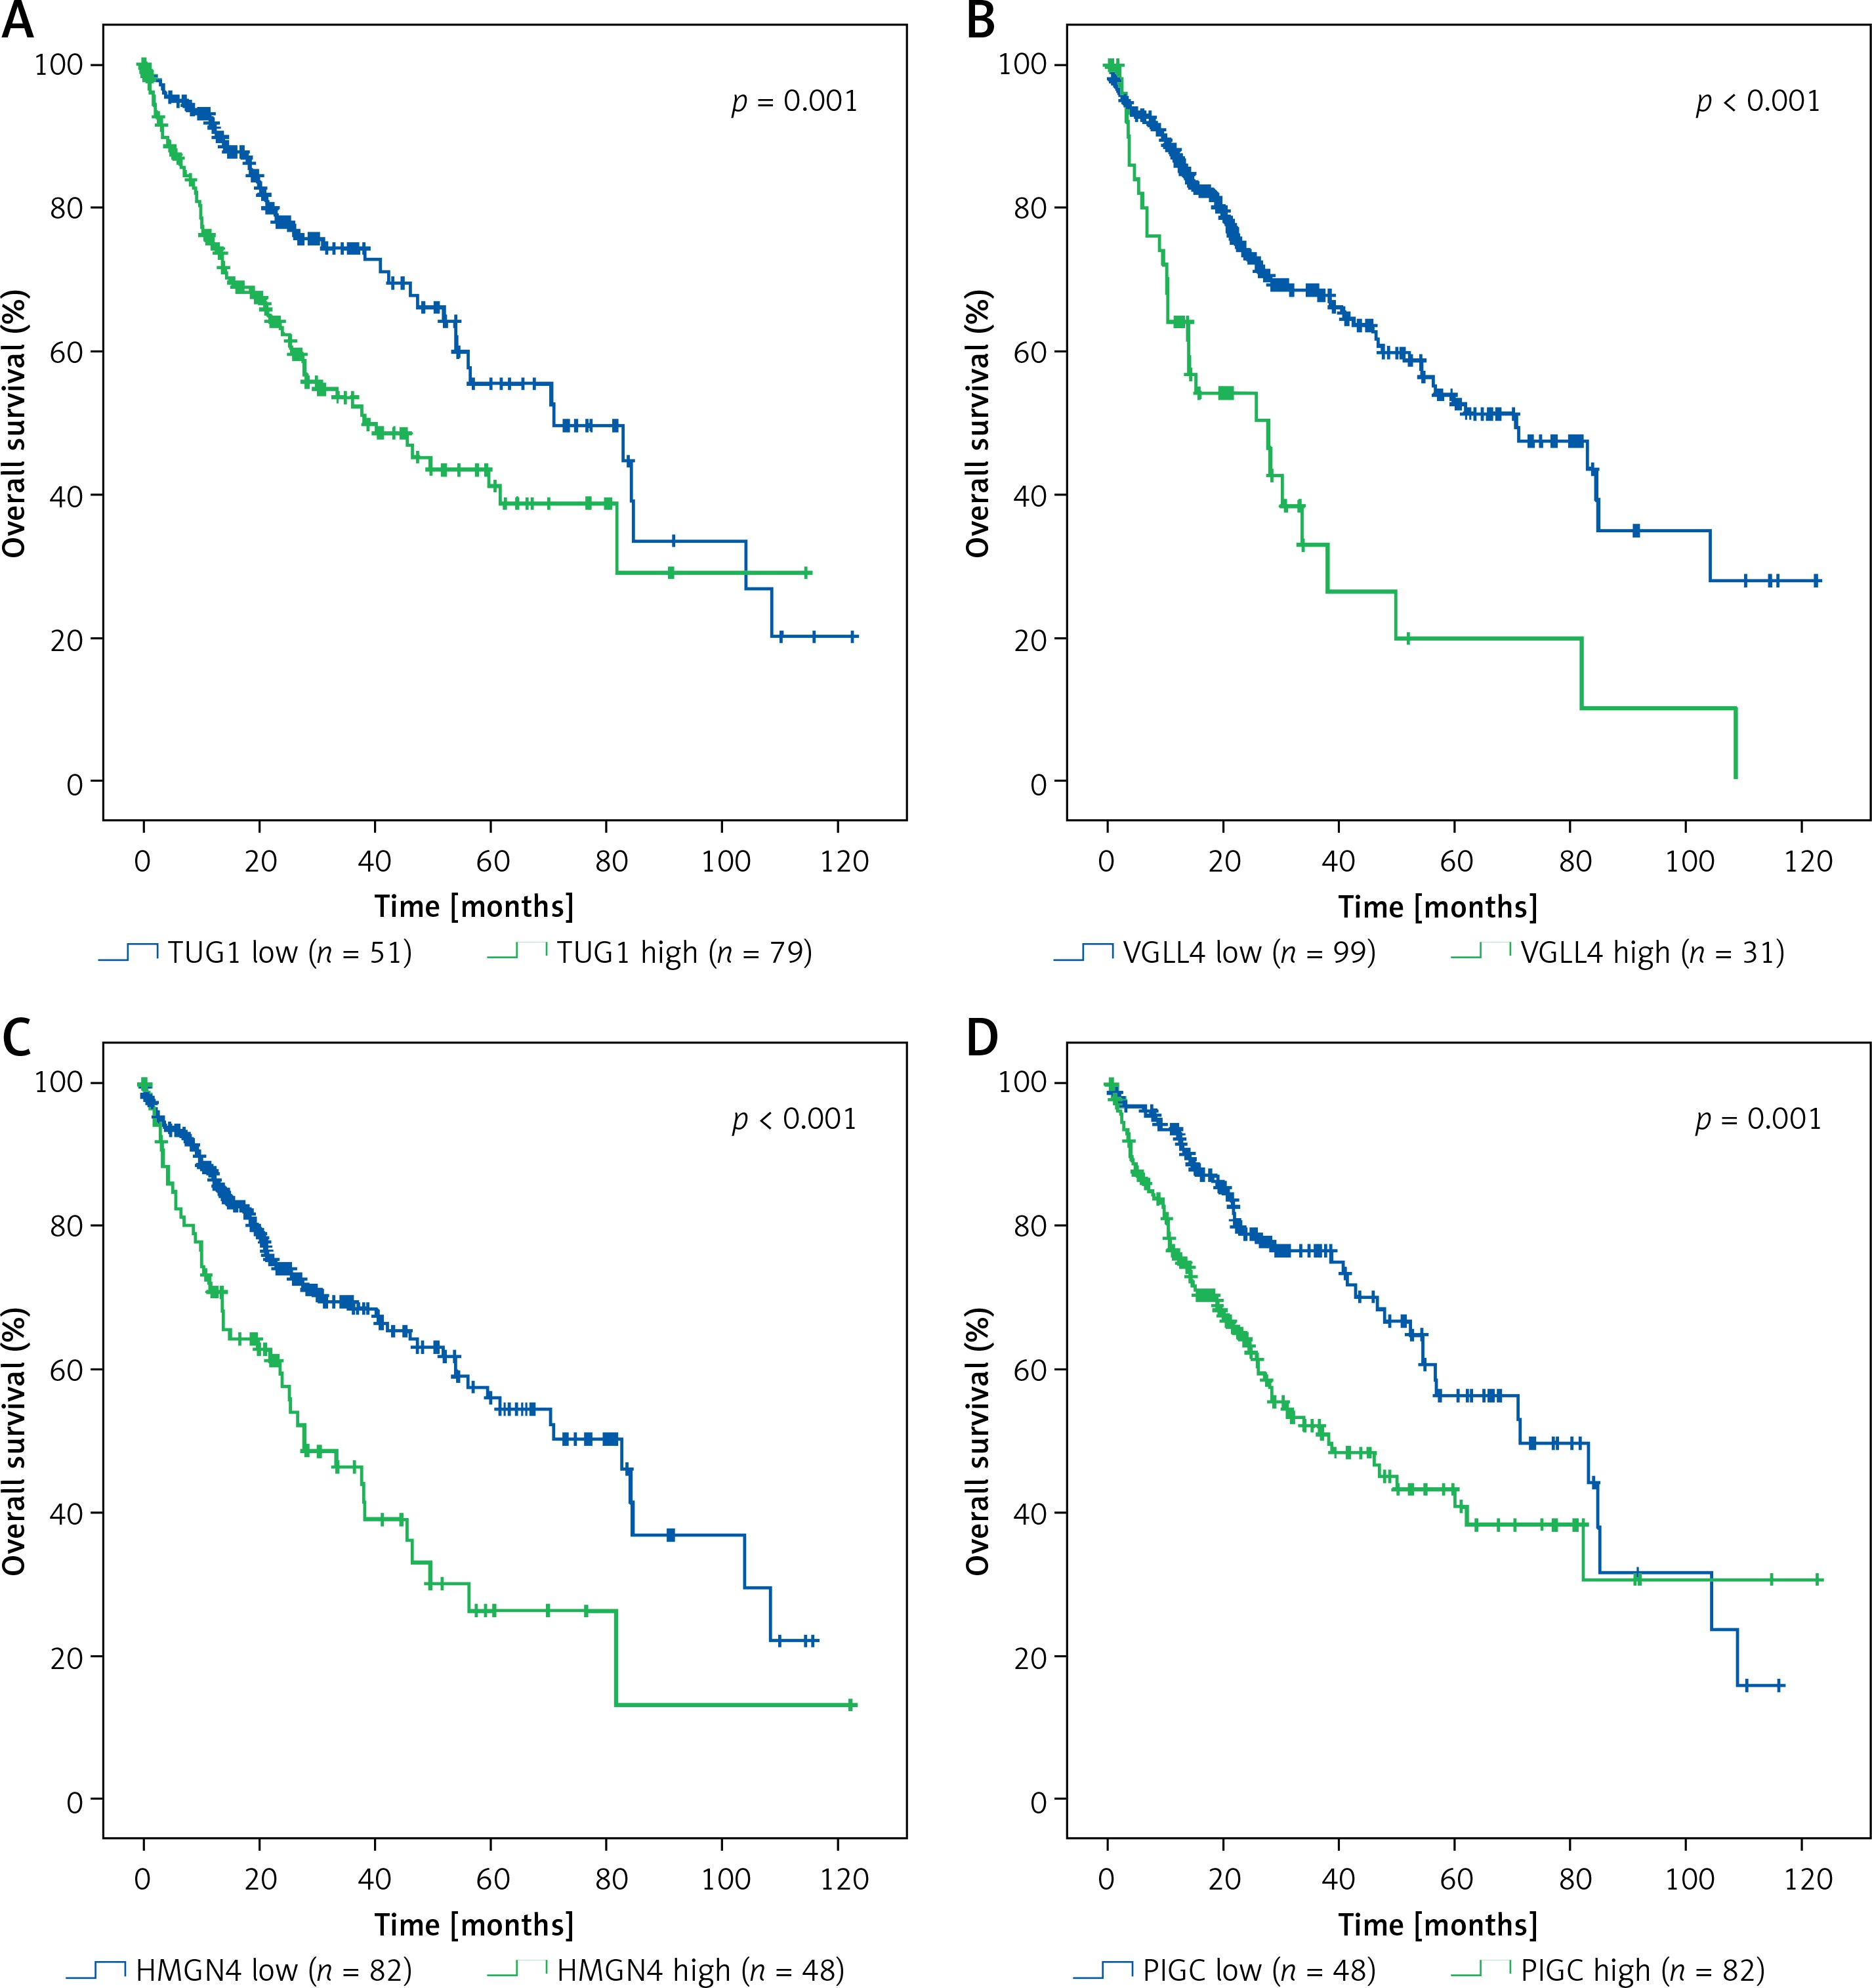
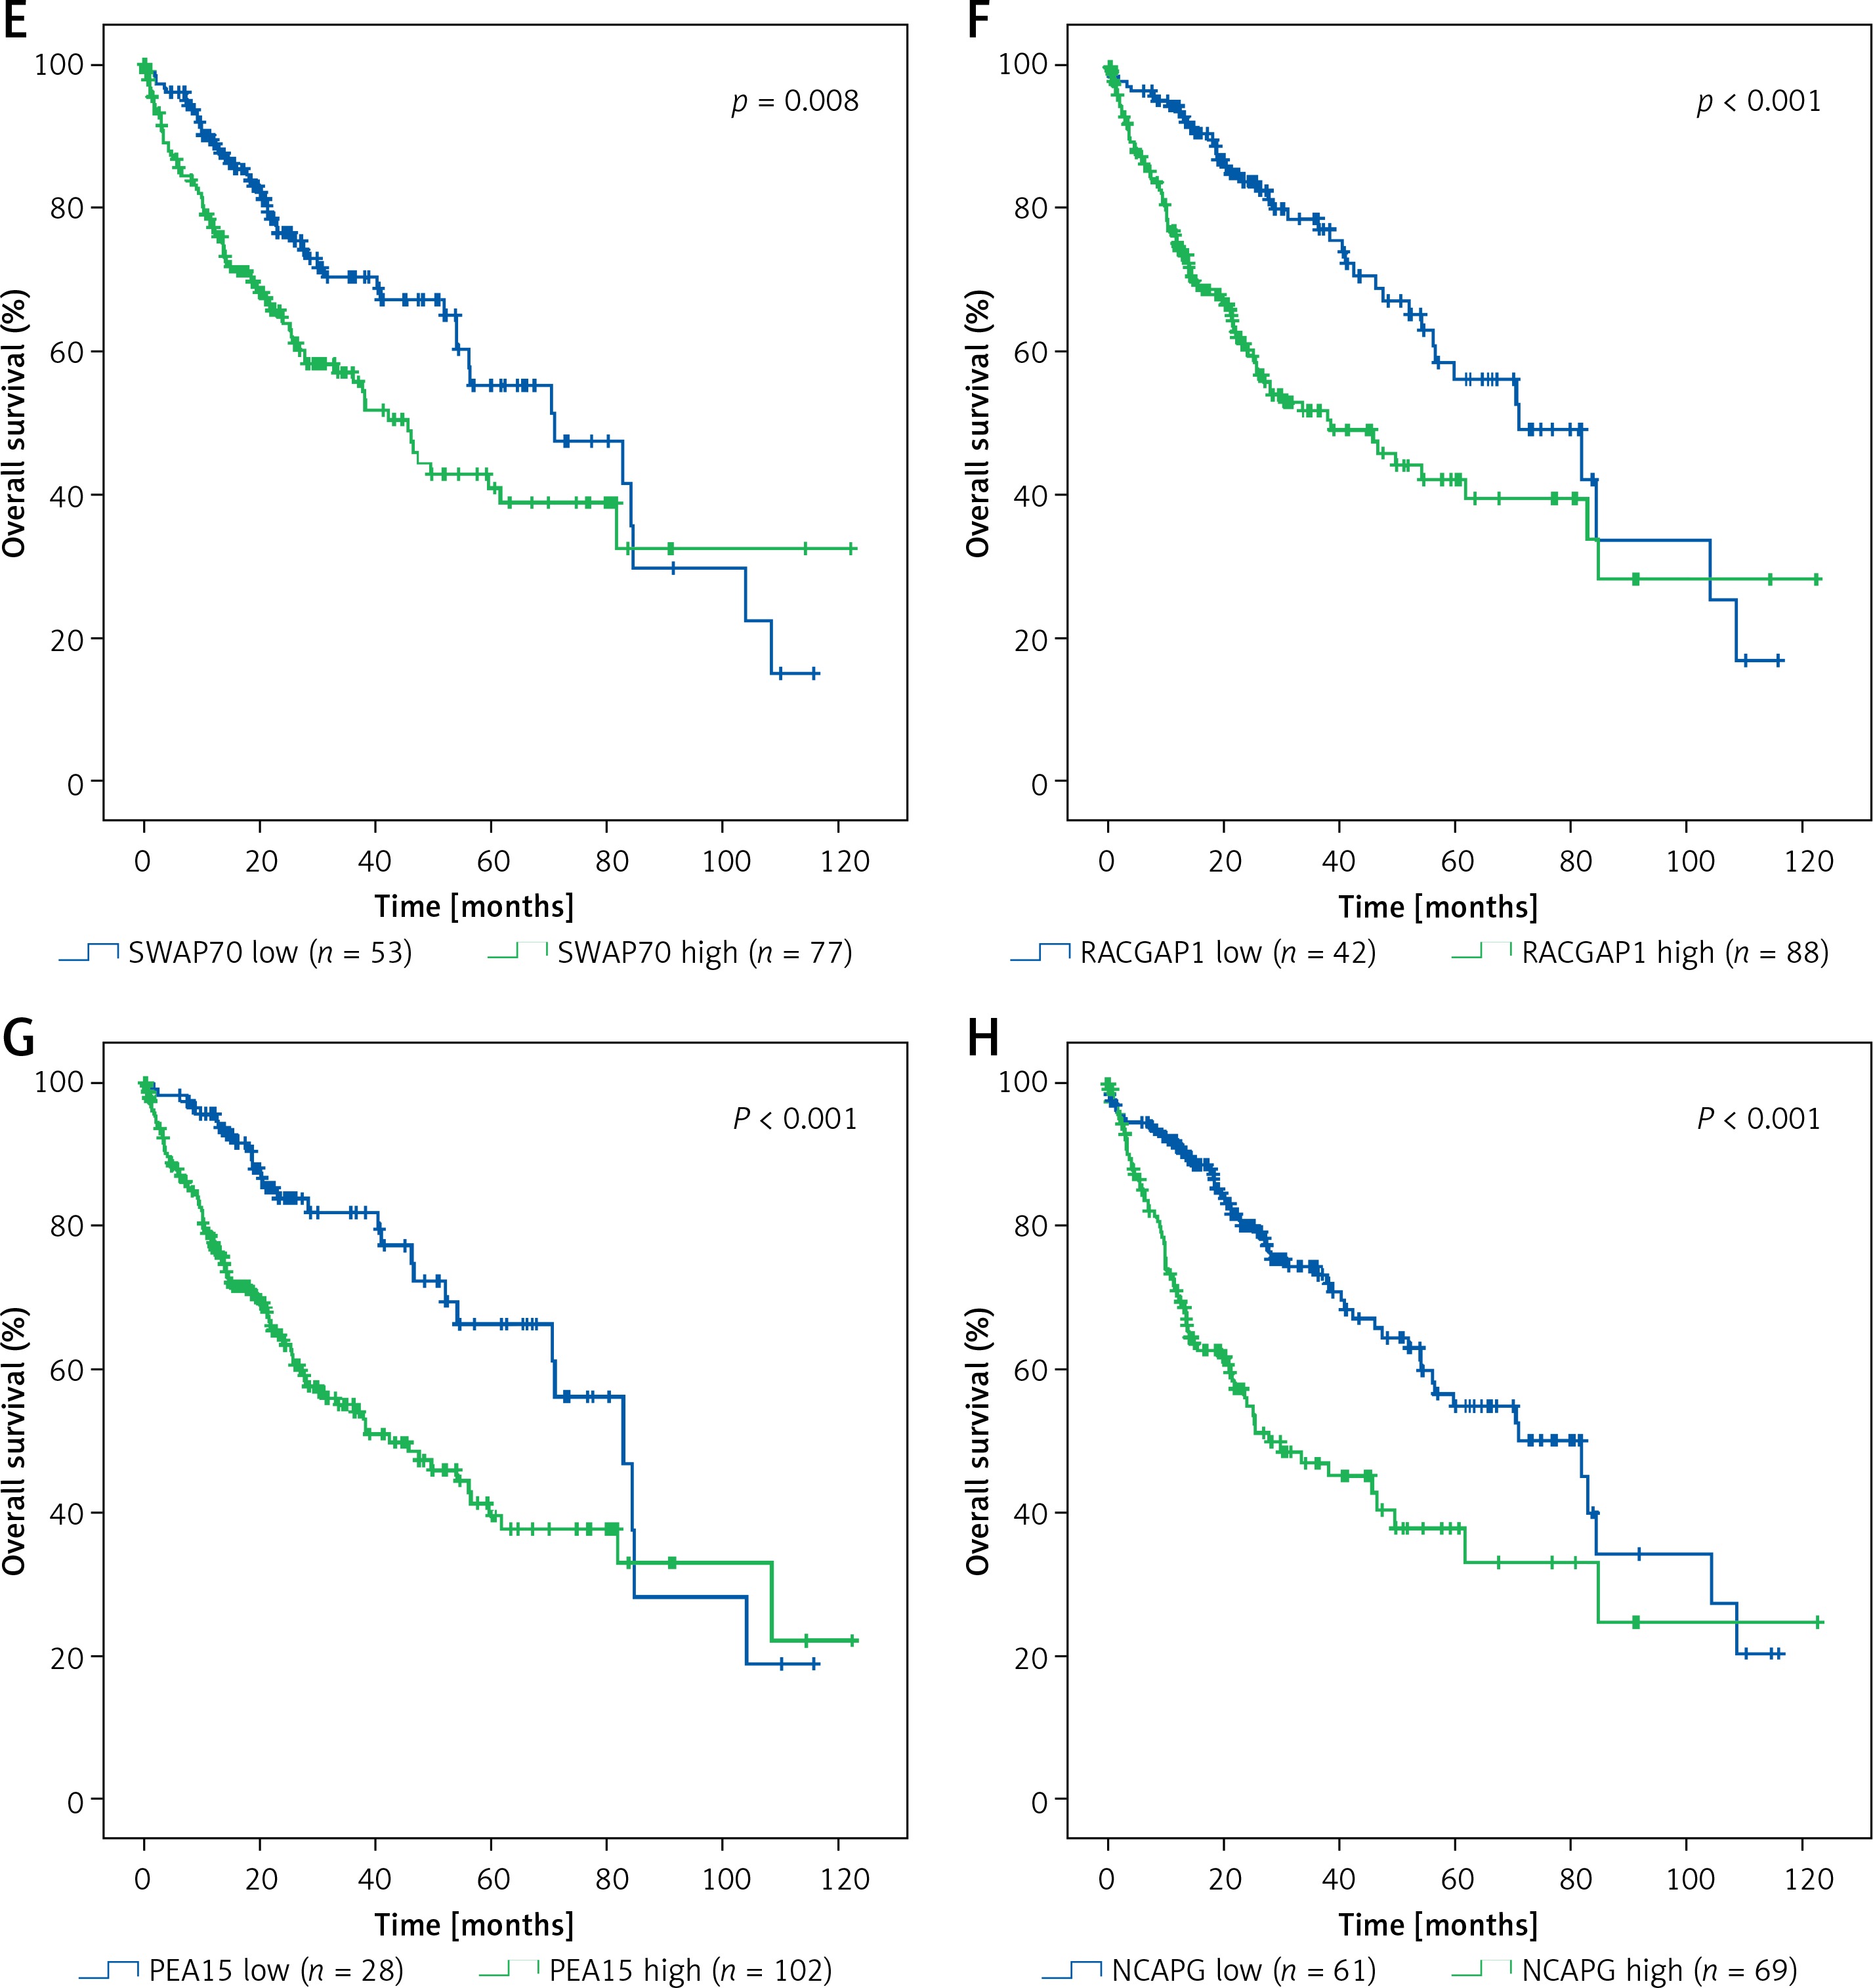
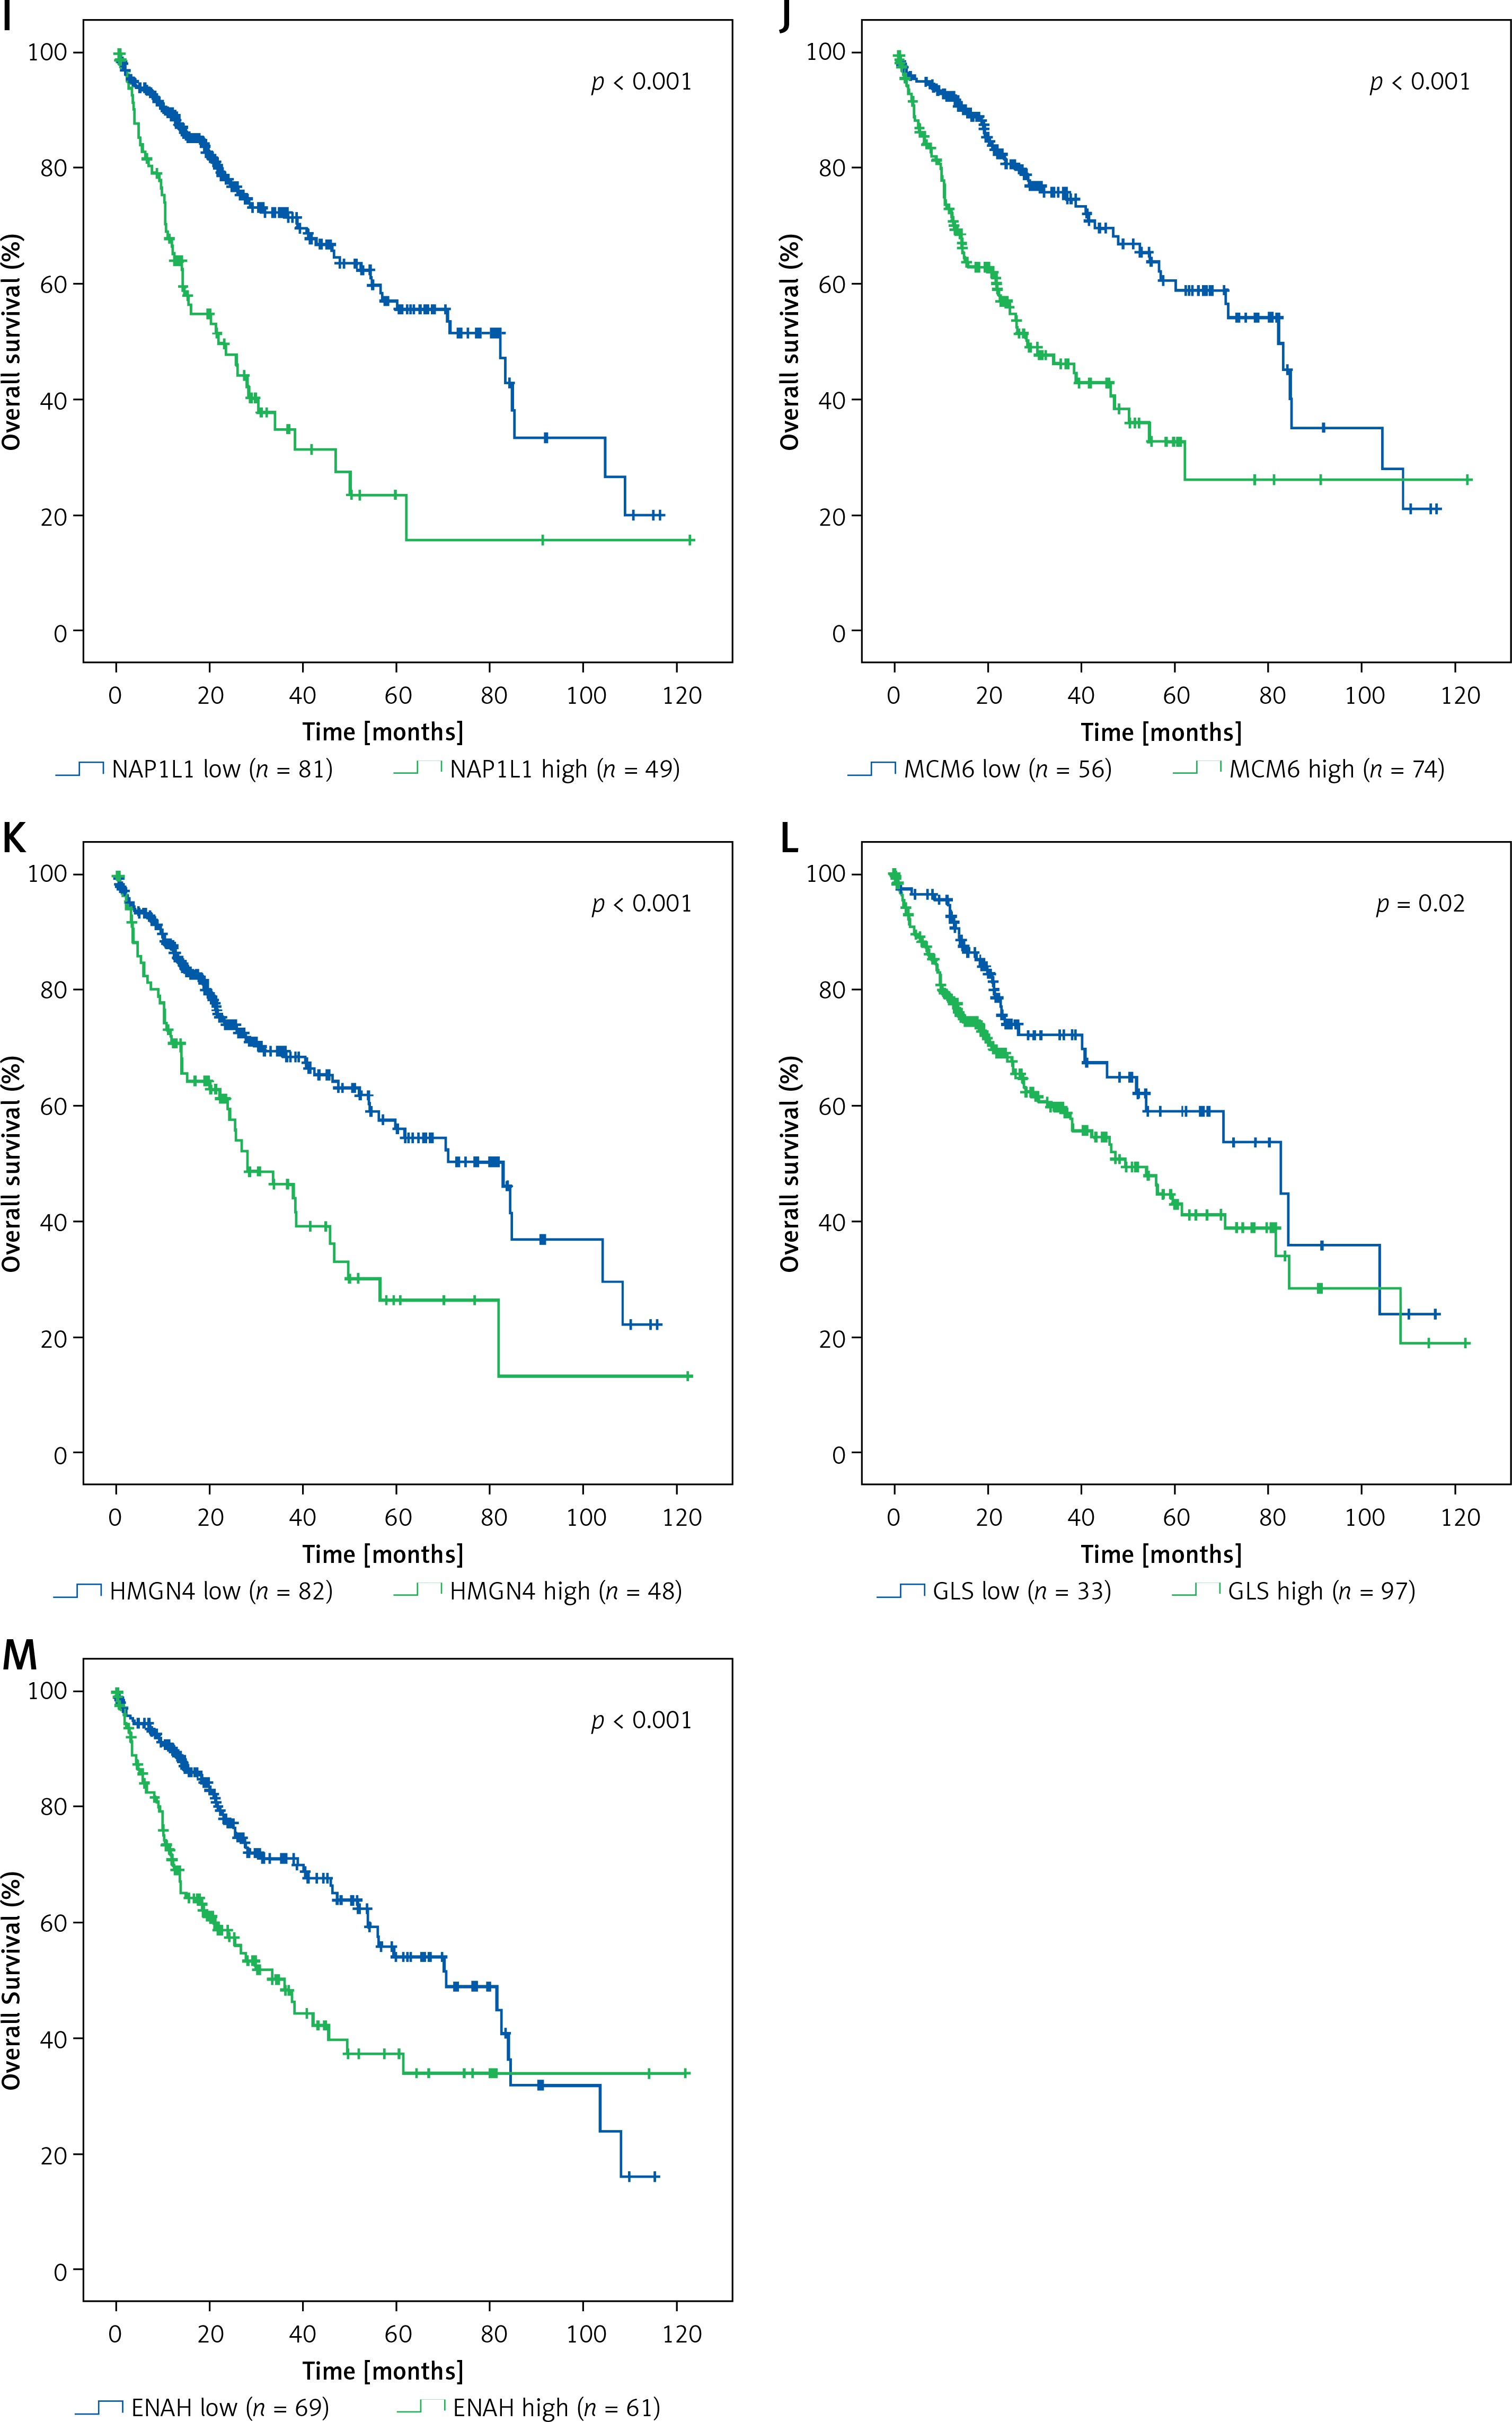
Figure 8
Differential expression and correlation of TUG1 and its target genes among the different stages of HCC. Red arrowhead: Up-regulation of the indicating genes expression from stage I to stage II; purple arrowhead: up-regulation of the indicating genes expression from stage II to stage III; blue arrowhead: up-regulation of the indicating gene expression from stage III to stage IV; green arrowhead: down-regulation of the indicating gene expression from stage IV to stage III; *p < 0.05 and **p < 0.01; NS – no significance
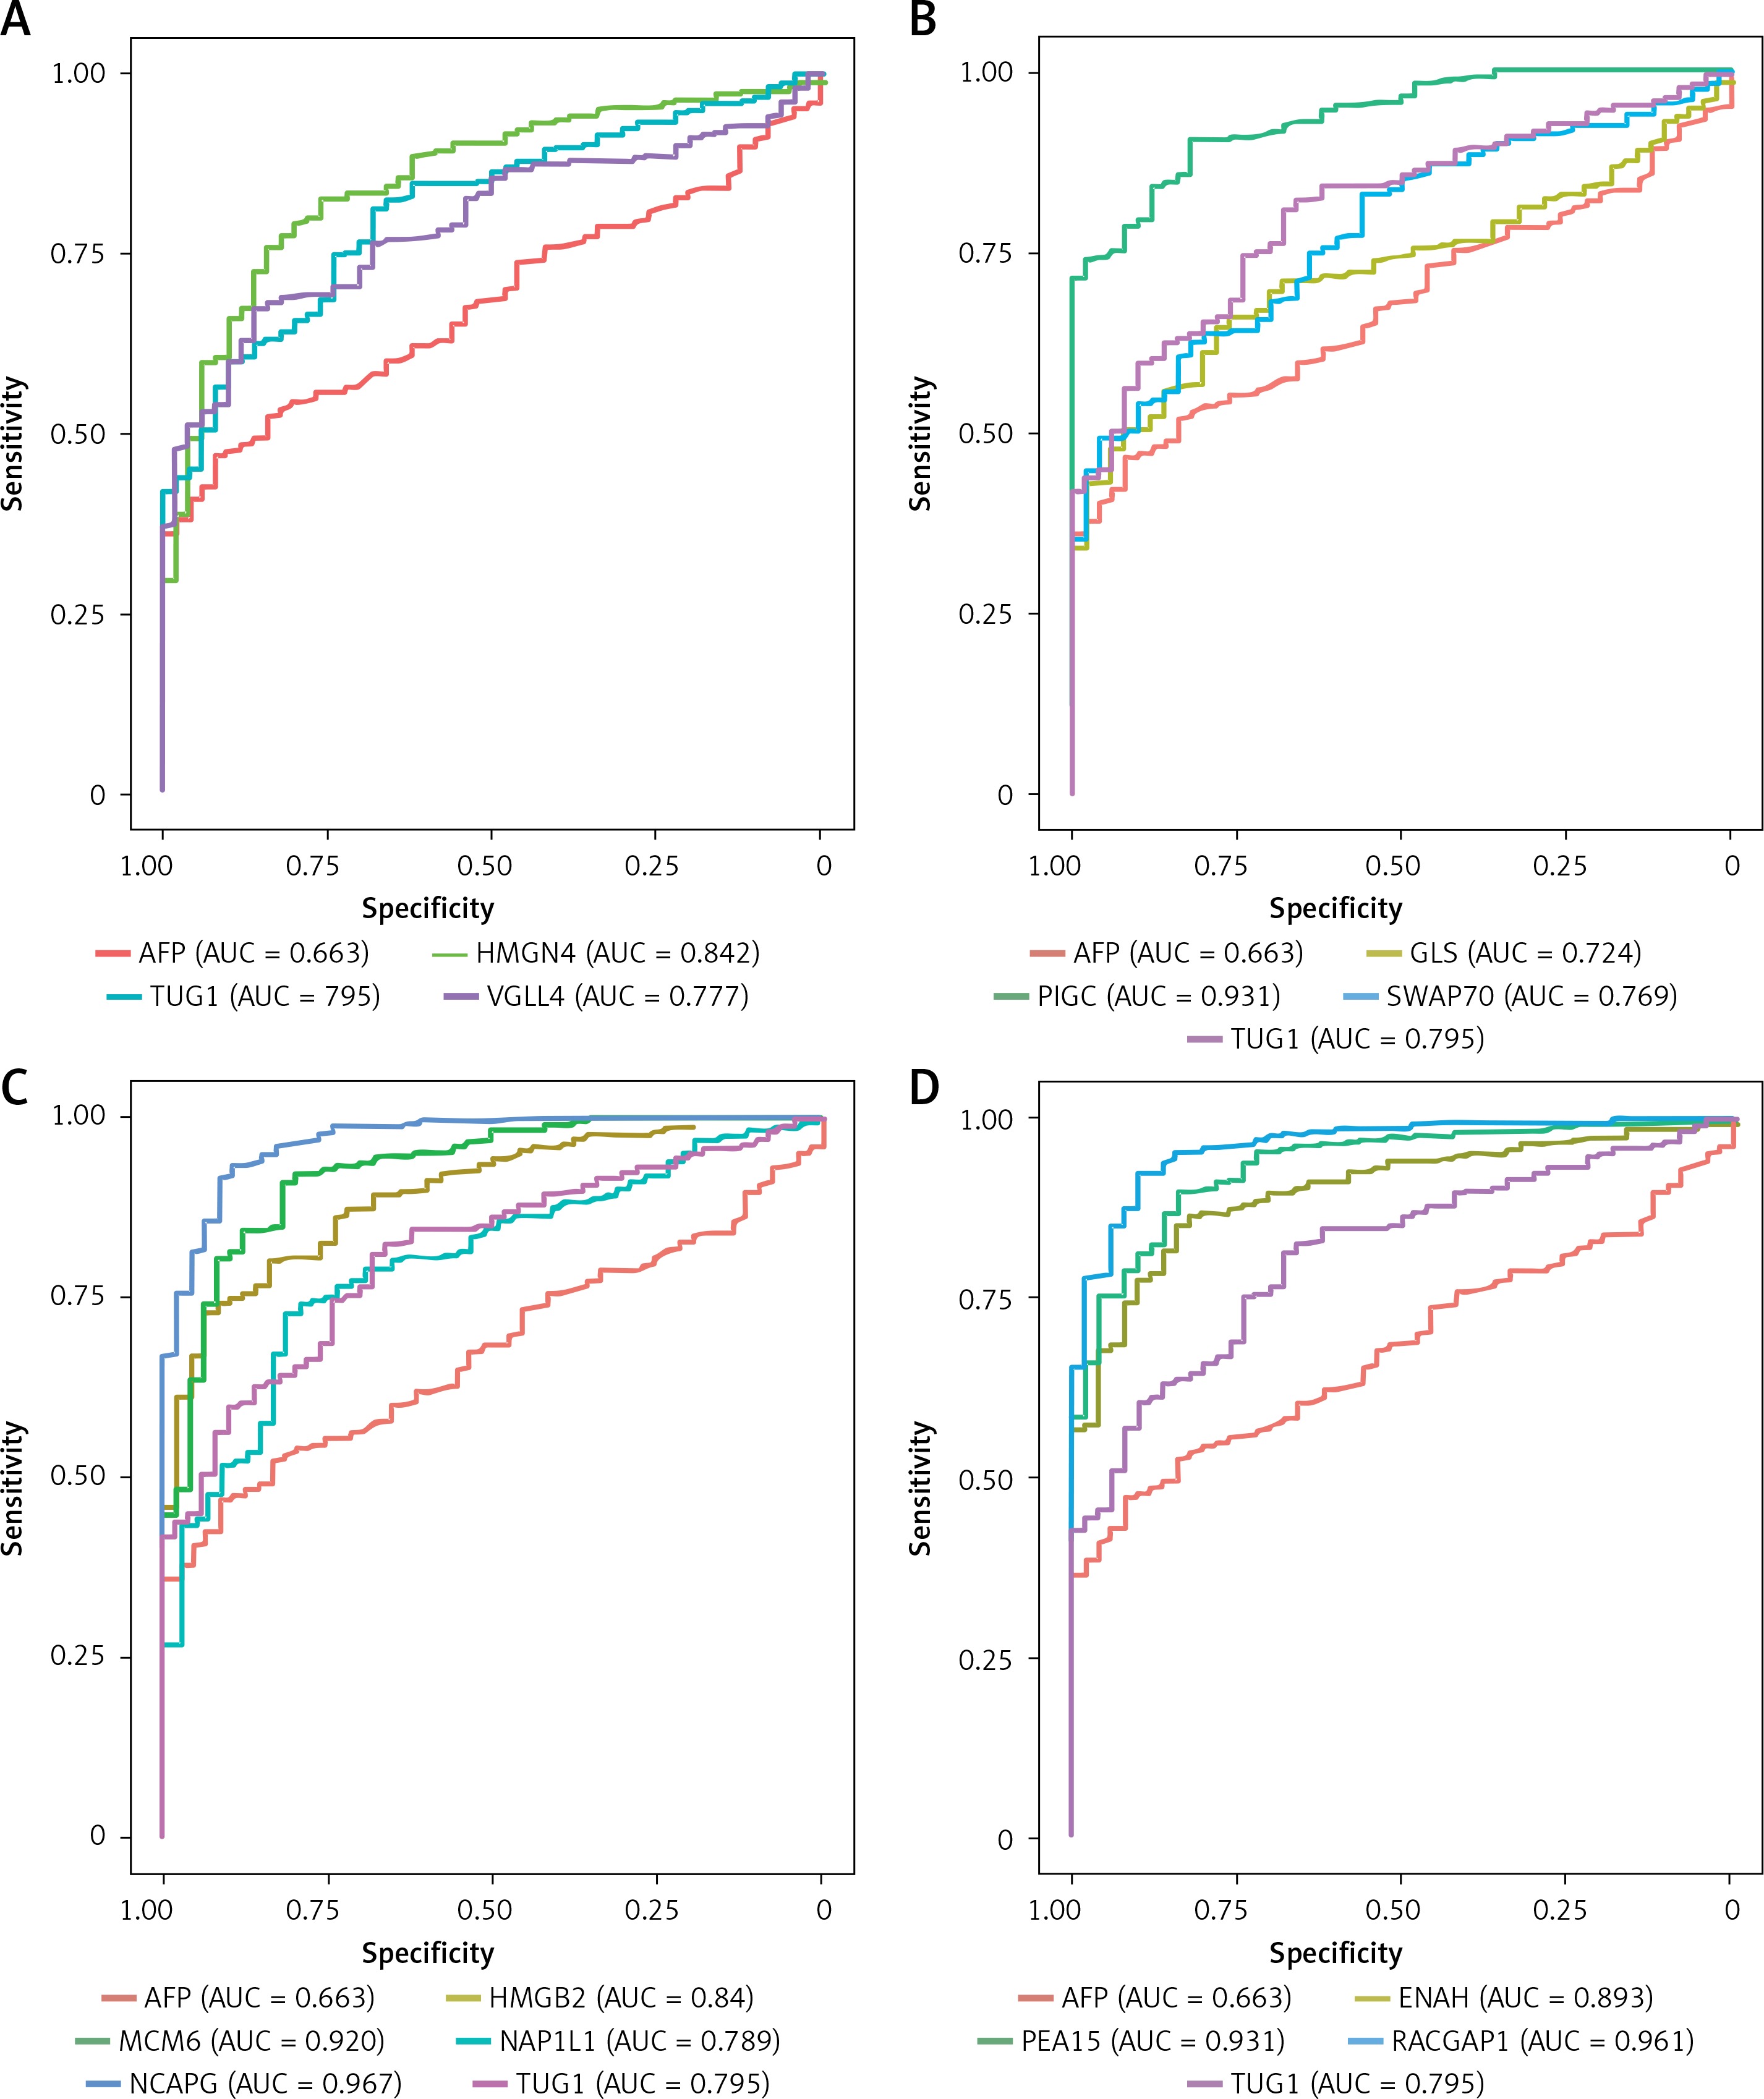
In addition, we performed ROC curve analysis to clarify the clinical diagnostic value of TUG1 and its target genes in HCC from the TCGA cohort. As shown in Figures 9 A–D, we found that the values of area under the curve (AUC) were higher than that of AFP (AUC = 0.663), among which AUC of PIGC (AUC = 0.931), PEA15 (AUC = 0.931), RACGAP1 (AUC = 0.961), MCM6 (AUC = 0.920), and NCAPG (AUC = 0.967) were all higher than 0.9, suggesting their important roles in diagnosis of HCC.
Figure 9
Diagnostic values of TUG1 and its target genes in HCC. A – Diagnostic efficacy of AFP (AUC = 0.663), TUG1 (AUC = 0.795), HMGN4 (AUC = 0.842) and VGLL4 (AUC = 0.777) in HCC. B – Diagnostic efficacy of GLS (AUC = 0.724), PIGC (AUC = 0.931), SWAP70 (AUC = 0.769) in HCC. C – Diagnostic efficacy of HMGB2 (AUC = 0.84), MCM6 (AUC = 0.92), NAP1L1 (AUC = 0.789) and NCAPG (AUC = 0.967) in HCC. D – Diagnostic efficacy of ENAH (AUC = 0.893), PEA15 (AUC = 0.931) and RACGAP1 (AUC = 0.961) in HCC
Discussion
Liver cancer is a common malignancy of the digestive system. The annual incidence of new liver cancer cases is about 748,000 cases worldwide, which has always been a serious threat to public health [10]. Although the medical diagnosis and treatment technology has made significant progress, its incidence is still on the rise. The prognosis of HCC patients is not satisfactory, with a 5-year survival rate of less than 20% and 5-year recurrence and metastasis rate as high as 80% [11–14]. The invasion of HCC is the main cause of the lower five-year survival rate and higher recurrence rate of metastasis. In recent years, there have been a lot of studies on liver cancer, but so far, no highly sensitive and reliable biomarkers have been found for the early diagnosis and prognosis evaluation, nor has it sufficiently clarified the occurrence, growth, and invasion of liver cancer [15]. Therefore, using combined bioinformatics will help us to better understand the relationship between aberrant LncRNA expression and cancers, and more efforts are needed to identify more efficient and sensitive molecular targets for HCC.
In our study, we identified the most significantly differentially expressed lncRNA TUG1 in the GSE14323 dataset. Twelve highly credible target genes of TUG1, screened out based on genetic database and molecular interaction database, were used to construct a TUG1 regulatory network. Seven of these genes had been reported to have been associated with cancer previously. For example, RACGAP1 is an important regulatory factor of cytokinesis [16], involved in the growth and differentiation of haematopoietic cells. Loss of its expression correlates with loss of migration and invasiveness of HCC cells [17]. Patients with RACGAP1 protein expression at the invasive front had significantly poorer prognosis than those without it; RACGAP1 is increasingly recognised as a potential biomarker for identifying patients with lymph node metastasis recurrence and poor prognosis [18, 19]. Researchers have proved that MCM6 is a tumour suppressor affecting the growth and metastasis of HCC. Additionally, it was reported that HMGB2 is regarded as a new marker for the diagnosis and recurrence of HCC [20–22], which is involved in cell migration, localisation, and immunoreactions. High expression of HMGB2 could promote the proliferation and inhibit the apoptosis of HCC cells, as well as predicting poor prognosis [23]. Researchers have demonstrated that NCAPG is associated with the growth of hepatoma cells, apoptosis, and epithelial mesenchymal transformation (EMT) [24]; NAP1L1 was found to be a nucleosome assembly protein in response to nucleosome remodelling through CSB protein and chromatin remodelling [25], promoting tumour progression as a chromatin regulatory factor in liver cancer [26]; PEA15, an essential prognostic marker for HCC, is involved in negative regulation of apoptosis signalling pathway mediated by death receptor, thereby inhibiting apoptosis of hepatoma cells. In addition, PEA15 also participates in transmembrane receptor protein tyrosine kinase signalling pathway, which mediates cell communication and promotes the migration of liver cancer cells, and the high level of ENAH expression promotes the occurrence and metastasis of liver cancer [27–29].
Based on the bioinformatics database, hepatoma cell line, and liver cancer tissue, we detected and analysed the expression and correlation of TUG1 and its target genes, and obtained four highly consistent TUG1 target genes (HMGB2, NCAPG, MCM6, and RACGAP1). We found that the expression levels of TUG1 and its target gene VGLL4 in HCC cell lines were higher than those in normal hepatoma cell line, which was consistent with the results predicted by bioinformatics method, but the expressions of PIGC and HMGN4 in different hepatoma cell lines were not consistent. These results suggest that the expression levels of these two genes are related to the genetic background and malignancy of different hepatoma cell lines. In addition, after interfering with TUG1, VGLL4, PIGC, and HMGN4 were all down-regulated, but the percentages of down-regulated expression were relatively low, indicating that TUG1 had a weak regulatory effect on VGLL4, PIGC, and HMGN4, and there were other molecules involved in their expression regulation. Next, it was found that the RNA levels of TUG1 and its target genes VGLL4, PIGC, PEA15, and ENAH were significantly increased in HCC tissues (p < 0. 05), while the expression of VGLL4 protein was significantly higher in HCC tissues (p < 0. 05), indicating that the target genes regulated by TUG1 played a role in the promotion of HCC, and PEA15 and ENAH were regulated by TUG1 to some extent. However, the expression of HMGN4 was inconsistent with our previous prediction, indicating the high heterogeneity of HMGN4 in different HCC patients, which needs to be further investigated by increasing the sample size. Through the correlation analysis, we found that the expression of TUG1 and its target genes VGLL4, PEA15, and ENAH were highly correlated in HCC tissues, but the correlations between TUG1 and PIGC and HMGN4 were weak.
Finally, we studied the diagnostic and prognostic values of TUG1 and its target genes based on TCGA database. The analysis of transcriptome sequencing data and clinical data from the TCGA database showed that the high expression of TUG1 and its 12 target genes could significantly predict the shorter survival time. Results obtained from this study are consistent with other studies; however, existing studies have only reported that NCAPG, HMGB2, and ENAH have significant prognostic effects. For instance, the knockdown of NCAPG expression reduced HCC cell viability but induced apoptosis and cell cycle arrest at S phase, and suppressed tumour cell EMT. Moreover, high levels of NCAPG expression are associated with the clinicopathological characteristics, recurrence, time of recurrence, metastasis, differentiation, and TNM stage in human HCC. Therefore, NCAPG can be a potential target for the diagnosis and therapy of patients with HCC [23, 24, 27]. We found that TUG1 target genes NCAPG, VGLL4, HMGN4, PIGC, MCM6, NAP1L1, PEA15, GLS, HMGB2, PEA15, and ENAH were positively correlated with tumour stages (p < 0.05), suggesting that these target genes not only play a role in the development of liver cancer but also participate in tumour progression. For example, MCM6, PEA15, RACGAP1, and ENAH have been reported to promote the metastasis of HCC [17, 20–30]. The diagnostic effect analysis shows that TUG1 and its target genes have higher diagnostic efficacy than the traditional marker AFP in clinics, so further clinical trials are needed.
In the present study, we identified differentially expressed lncRNA–TUG1 and its target genes (VGLL4, HMGN4, PIGC, MCM6, PEA15, RACGAP1, GLS, NAP1L1, HMGB2, NCAPG, ENAH, and SWAP70) by using bioinformatics methods.
The high expression of TUG1 and its target genes can significantly predict shorter survival time of HCC patients and can be used as potentially effective prognostic biomarkers. NCAPG, MCM6, PIGC, PEA15, and RACGAP1 could be useful in the diagnosis of HCC.