Introduction
Frailty is commonly defined as a clinical condition characterized by higher susceptibility to inadequate restoration of homeostasis after exposure to a stressor event, which increases the likelihood of unfavourable consequences such as falls, delirium, disability, and mortality [1, 2]. The literature reports varying incidences of frailty across different populations, including 53% in long-term patients, 5–29% among HIV-infected patients, and 37% among individuals with end-stage renal disease [3]. Furthermore, frailty correlates with escalated health care expenditures and unfavourable predictions for surgical patients, in addition to chronic kidney ailment, liver disease, or heart disease [4]. Therefore, it is imperative to develop novel strategies for prevention and treatment of frailty to mitigate the socioeconomic ramifications associated with its onset and progression.
Osteoarthritis (OA) is a degenerative disease characterized by osteophytes, mild synovial inflammation, subchondral sclerosis, and cartilage degradation. As the predominant chronic musculoskeletal disorder, OA induces pain and significantly reduces the functionality of the affected joint, and the knee and hip articulations are common sites. In the United States, the fiscal expenditure incurred in treatment and provision of care for osteoarthritis alone amounts to a staggering $27 billion [5, 6]. Recently, several pieces of evidence have emerged indicating that hip osteoarthritis (HOA) and knee osteoarthritis (KOA) represent significant risk factors associated with frailty. Meessen et al. administered the Groningen Frailty Index questionnaire to a sample of 3,275 patients and noted that 35.9% of patients with HOA and 24.1% of patients with KOA met the criteria for frailty [7]. Castell et al. found that participants had a significantly higher likelihood of showing frailty when they had osteoarthritis affecting their hips, knees, and hands (odds ratio: 8.95) [8]. However, the perspective afforded by these clinical inquiries remains limited to conventional observational epidemiology and is vulnerable to the influence of confounding variables such as metabolic disorders and the phenomenon of retrograde causality [9]. Therefore, more research is needed to definitively determine whether HOA/KOA truly serve as precise risk factors for frailty.
Mendelian randomization (MR) represents a promising alternative strategy that facilitates evaluation of potential causal relationships between an exposure and an outcome by employing genetic variants as instrumental variables. Since genotypes precede the onset of the disease and are mainly unaffected by the environment or individual behaviours, this methodology can reduce the impact of confounding variables and alleviate the risk of reverse causality bias. In this study, we employed a two-sample MR analysis to assess the plausible causal nexus between hip or knee osteoarthritis and frailty. It is hoped that through systematic and effective intervention on hip or knee osteoarthritis, we can delay progression of ageing and further reduce the economic pressure on society and the health system.
Material and methods
Study design
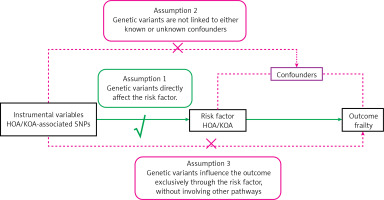
Two-sample MR serves as an analytical approach deployed to illuminate the causal nexus between the exposed phenotype and the potential outcome. This methodology utilizes genetic variants related to target exposure as instrumental variables (IVs), making efficient use of the abundant data provided by publicly accessible genome-wide association study (GWAS) datasets. As Figure 1 illustrates, this investigation was formulated on the following tripartite postulates: (1) the chosen IVs should show a strong association with the exposure; (2) the selected IVs should exhibit autonomy from the confounding factors entangled within the linkage that connects exposure and outcome; and (3) the selected IVs should not exert any direct influence on the outcome; instead, their effects should be solely mediated by their association with the exposure [10, 11].
Data source
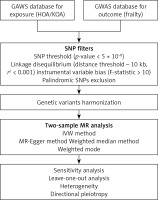
An illustrative diagram of the two-sample MR analysis procedure is presented in Figure 2. We conducted a thorough search of publicly available GWAS databases to obtain suitable datasets that cover both exposure and outcomes, with a special emphasis on incorporating the prestigious UK Biobank resource. Consequently, no additional ethical authorizations were deemed necessary. We restricted the genetic composition of the study cohort strictly to individuals of European ancestry, thus mitigating the risk of bias resulting from interpopulation admixture.
Data concerning HOA and KOA were acquired through an extensive genome-wide analysis of the UK Biobank dataset [12]. This dataset includes a cohort of 417,596 individuals with European heritage, consisting of 39,427 cases of European ancestry and 378,169 control subjects. Primary outcome data were obtained from publicly available GWAS data [13], which included a cohort comprising 175,226 individuals of European ancestry. Furthermore, this dataset meticulously catalogues a total of 7,589,717 single-nucleotide polymorphisms (SNPs).
SNPs in exposure and outcome selection
Only SNPs meeting the genome-wide significance threshold (p < 5 × 10⁻⁸) were used as instrumental variables (IVs) in the OA-focused GWAS. We performed a detailed evaluation of SNPs to verify their independent inheritance, confirming their minimal linkage disequilibrium (r2 < 0.001) and substantial physical separation, with more than 10,000 kilobases between each pair of SNPs [14, 15]. Furthermore, we computed the F-statistic for each SNP to gauge the potency of the instrumental variables. An F-statistic > 10 signifies the absence of susceptibility to weak IV bias, indicating a robust correlation between IVs and exposure factors [16]. Comprehensive information on these IVs is available in Table I.
Table I
Association of 25 HOA/KOA and frailty SNPs
Statistical analysis
To investigate possible causal links between HOA/KOA and risk of frailty, we used the “TwoSampleMR” package (version 0.5.7) within the R program (version 4.2.2). The primary analysis to establish the causal association between HOA/KOA and the risk of frailty involved use of the inverse variance weighted (IVW) method. This methodology employs a meta-analytical approach to amalgamate the Wald ratio estimates of the causal effect derived from various SNPs, yielding a consistent estimate for evaluating the causal influence of an exposure on the outcome. This approach ensures a tailored and effective analysis based on the number of IVs available. Additionally, our MR analysis incorporated MR–Egger regression, weighted median estimation (WME), weighted mode methods, and simple mode, providing a robust evaluation of the causal relationship [10, 16–18].
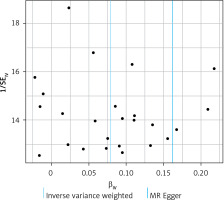
Furthermore, we conducted Cochran’s Q test to evaluate statistical heterogeneity among SNPs in both the IVW and MR Egger methods. A significance level of p < 0.05 was considered indicative of significant heterogeneity. Horizontal pleiotropy occurs when a genetic variant exhibits association with multiple phenotypes along distinct pathways, which has the potential to compromise the validity of MR analyses [12, 19]. To investigate and correct for horizontal pleiotropy, we applied MR–Egger regression, which proficiently identifies and sheds light on potential confounding variables that can introduce bias into MR analyses. In the graphical representation of the MR–Egger regression, it should be noted that the intercept serves as a reflection of the mean pleiotropic effect that encompasses all genetic variants involved. Additionally, we conducted a leave-one-out analysis in conjunction with sensitivity analysis to determine whether any individual IV significantly influences the causal association between exposure and outcome. Moreover, we calculated F-statistics to assess the statistical robustness of IVs [20].
Results
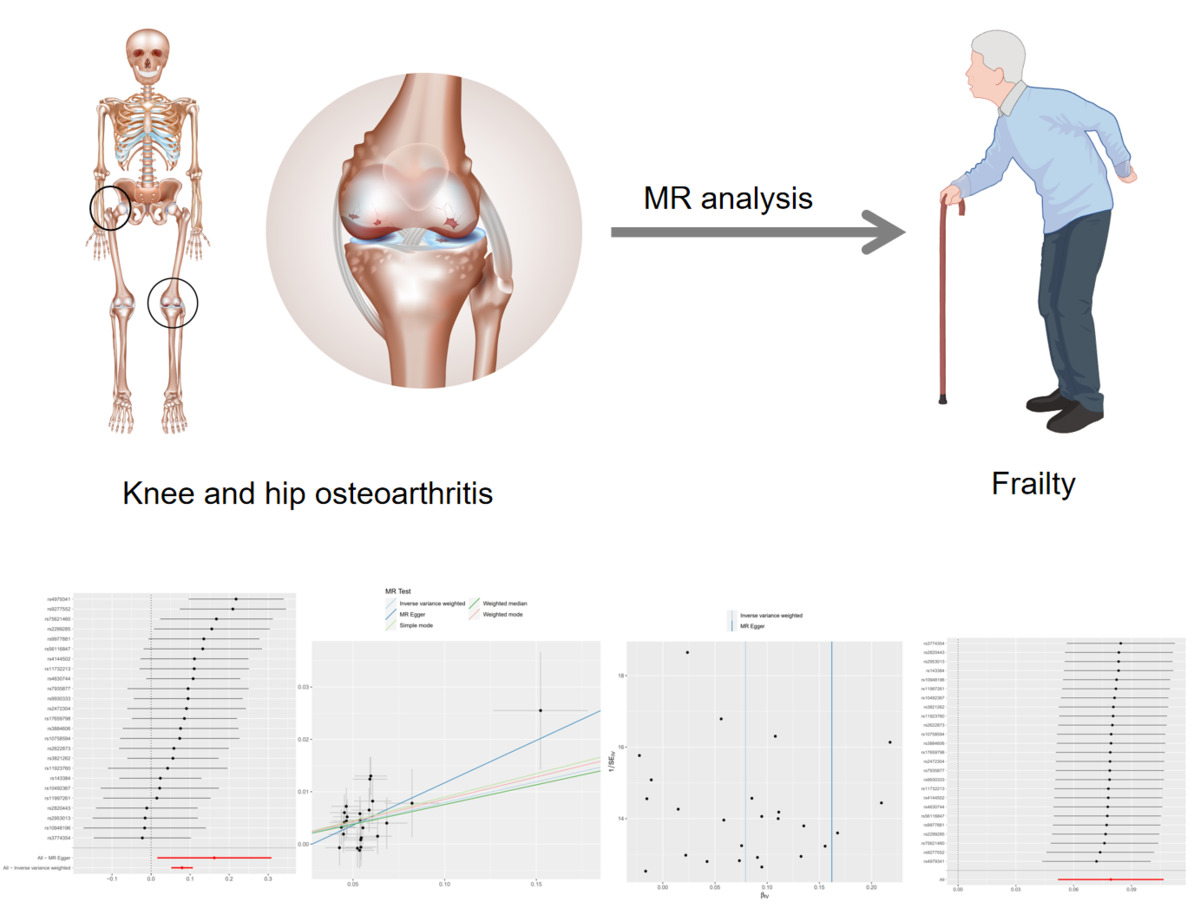
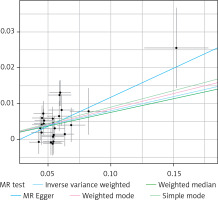
Through a meticulous screening and selection process that adhered to the specified criteria, we successfully identified a total of 25 SNPs that served as IVs for KOA/HOA, as illustrated in Figure 3. It is essential to emphasize that all F-statistics corresponding to IVs related to HOA/KOA exceeded the threshold of 30, indicative of a strong and substantial correlation between each IV and the exposure factors. However, one SNP (rs12470967) was excluded due to its palindromic nature and intermediate allele frequencies in this study. MR analysis revealed that a robust and consistent causal connection between HOA/KOA and frailty remained robust and consistent across multiple calculation methods, including IVW, MR–Egger, weighted median, weighted mode and simple mode approaches. These results strongly suggest that the presence of hip osteoarthritis or knee osteoarthritis is associated with an elevated risk of frailty. As the prevailing measurement method, IVW analysis distinctly demonstrated a statistically significant association between hip osteoarthritis and knee osteoarthritis with frailty (OR = 1.082, 95% CI: 1.0532–1.1125, p = 1.36 × 10⁻⁸). Furthermore, as succinctly summarized in Table II and illustrated in Figure 4, MR–Egger regression (OR = 1.175, 95% CI: 1.0162–1.3604, p = 0.040), weighted median estimation (OR = 1.078, 95% CI: 1.0365–1.1219, p = 1.831 × 10⁻⁴), weighted mode analysis (OR = 1.089, 95% CI: 1.0078–1.1771, p = 0.041) and simple mode (OR = 1.093, 95% CI: 1.0112–1.1830, p = 0.034) consistently indicated that the presence of HOA and KOA was associated with an elevated risk of frailty. The scatterplot in Figure 5 serves as a visual representation of the SNPs and their respective effects, illustrating the relationship between HOA/KOA and frailty.
Table II
Two-sample Mendelian randomized analyses for the associations of knee or hip osteoarthritis with the frailty (number of SNPs = 25)
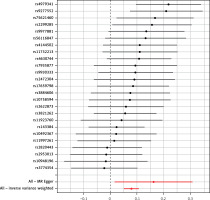
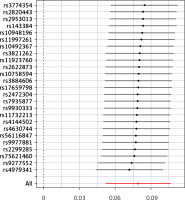
Based on comprehensive findings obtained from the five analyses, we confidently conclude that there exists a significant and causal relationship between HOA/KOA and frailty. The Cochran’s Q test showed no evidence of heterogeneity between the IV estimates derived from individual variants (Table III). MR–Egger regression analysis indicated that the presence of horizontal pleiotropy was unlikely to introduce bias into the results (intercept: –0.0044, p = 0.549). Ultimately, the results of a “leave-one-out” analysis convincingly demonstrated that no one SNP had an excessive impact on the IVW point estimate, as depicted in Figure 6.
Table III
Heterogeneity and pleiotropy analysis by MR Egger, IVW (number of SNPs = 25)
Discussion
In our research, we used a two-sample MR analysis to investigate the causal relationship between osteoarthritis and frailty with two publicly available databases. The results suggested that the presence of hip osteoarthritis or knee osteoarthritis is associated with an elevated risk of frailty. These results are consistent with the conclusions derived from numerous previous studies [8, 21, 22].
As a predominant ailment that affects the synovial joints, OA places a substantial and continually growing burden on socioeconomic resources. Today, a remarkable 240 million individuals across the globe have osteoarthritis, with knee and hip osteoarthritis together comprising 4.7% of the worldwide total cases [5, 6]. A systematic review by Salmon et al. revealed that the mean total, direct and indirect expenses per individual per annum for HOA/KOA patients across the world were £11.1k, £9.5k and £4.4k, respectively [23]. Therefore, it is crucial for clinicians to prioritize prevention and early management of HOA/KOA to alleviate socioeconomic burdens. As the ageing population continues to grow, frailty will affect millions of older individuals worldwide. The significant variation in the reported incidence of frailty, which ranges from 4% to 59% in numerous studies, can be attributed to the lack of a standardized conceptual framework and a consistent method for measuring frailty [3]. A systematic assessment of the vulnerability phenotype and the vulnerability index criteria in patients from six countries by Biritwum et al. showed a prevalence of 8–15% for the former and 13–56% for the latter [24]. At a 1-year follow-up, Mondor et al. discovered that patients with frailty experienced an additional medical financial burden of $12,360 to $10,845 per annum [4]. Therefore, physicians should pay more attention to diagnosis and prevention of frailty to decrease the social economic burden, particularly in the management of specific diseases linked to frailty.
Previous studies have shown an association between osteoarthritis and frailty.
Some literature suggests that the prevalence of frailty among individuals with OA ranges from 24% to 60% [21]. Castell et al. conducted a cross-sectional study involving 2,455 European participants and concluded that the risk of frailty among patients with OA was 2.96 times higher (95% CI: 2.11–4.16) than that among patients without OA [8]. Misra et al. also found that people with HOA exhibit a notably higher risk of frailty than those with KOA [25]. According to survey statistics by Veronese et al., individuals experiencing the burden of OA pain exhibit an elevated proclivity to frailty compared to those without significant OA pain [26]. Sibille et al. obtained similar results at a microscopic level, whereby individuals with severe chronic KOA pain tended to have shorter telomeres in comparison to those with no or milder KOA pain [27]. Hence, OA may contribute to frailty by activating pathological activity associated with pain. Furthermore, persistent pain can result in decreased physical activity and contribute to adverse mental health outcomes, resulting in a decline in overall skeletal muscle mass and an increased risk of frailty.
Certainly, the field of microscopic investigations exploring the causal link between osteoarthritis and frailty/ageing is currently quite restricted in scope. In contrast to their normal isolated chondrocyte counterparts, chondrocytes isolated from OA patients exhibit various senescence-related phenomena, such as telomere shortening and increased activation of the DNA damage response [28]. These manifestations are closely associated with oxidative stress, especially in the presence of elevated levels of CRP, IL-6, IL-18, IL-20, and TNF-α, which are significantly increased in OA patients [29, 30]. Zhai et al. found that women with OA of the hand had significantly shorter leukocyte telomere lengths, with a reduction of 178 base pairs compared to women without hand OA [31]. Rose et al. compared OA cartilage with normal cartilage and reported a higher degree of genomic DNA damage in OA cartilage [32].
Despite numerous observational studies consistently revealing a strong correlation between osteoarthritis and frailty, determining whether osteoarthritis directly initiates frailty remains a challenging undertaking. Moreover, it is essential to recognize that observational studies are vulnerable to inherent biases and confounders, including variables such as age, physical activity, the possibility of reverse causation, and selection bias. These intricacies emphasize the need for further research to clarify the complex relationship between osteoarthritis and frailty while judiciously addressing the inherent limitations of observational research.
MR minimizes the potential for bias that exists in observational studies by using exposure-related genetic variants as a proxy for exposure. Indeed, the merit of MR lies in the random allocation of alleles during gametogenesis and conception, which effectively severs the inherent associations between OA-associated alleles and lifestyle or demographic variables, which would potentially introduce distortion to the association between OA and frailty. In our study, the selection of instrumental variables was thorough, comprehensive, and trustworthy. Furthermore, use of multiple IVs improved the specificity of the SNPs and increased the precision of inferences.
However, it is essential to acknowledge that our study is not without inherent limitations. First, the study was conducted within a European population, and it is important to recognize that ethnicity and the possibility of selection bias can indirectly influence the causal inferences drawn from the study. Therefore, further MR studies that encompass diverse populations, with the aim of improving the generalizability and completeness of our understanding, are needed. Second, our MR analysis focused exclusively on knee osteoarthritis and hip osteoarthritis. More research is needed to investigate potential causal relationships between frailty and osteoarthritis that occur in different anatomical locations. Third, our assessment of frailty was predominantly based on the frailty index, a subjective metric. Objective indicators, such as telomere length or genomic DNA damage, were notably absent from this analysis and deserve further exploration to provide a more comprehensive perspective on frailty in the context of osteoarthritis.
In conclusion, this study used a two-sample Mendelian randomization methodology to attempt to establish a causal relationship between osteoarthritis and frailty. The preliminary findings suggest a causal association, indicating that knee and/or hip osteoarthritis may contribute to development of frailty. Consequently, orthopaedic surgeons must focus on detecting signs of frailty during the diagnosis and treatment of hip or knee osteoarthritis. It is hoped that through systematic and effective intervention on hip or knee osteoarthritis, we can delay progression of ageing and further reduce the economic pressure on families, society and the health system.


