Introduction
Type 2 diabetes is a common and increasingly prevalent metabolic illness characterized by an imbalance in blood glucose levels. The incidence and number of persons affected are rapidly growing, with alarming global trends [1, 2]. Type 2 diabetes is also a substantial chronic condition, contributing to a large amount of the disease burden around the world [3]. Individuals diagnosed with type 2 diabetes are at a heightened risk of hospitalization, disability, and death, hence exerting a substantial influence on worldwide public health [4]. Type 2 diabetes is a complicated, heterogeneous, chronic disease, and multi-factor behavioral modification could aid in diabetes prevention [5]. It is widely acknowledged in the academic community that a sedentary lifestyle, high-fat and high-energy dietary habits, and hereditary factors are the three main variables that may raise the risk of type 2 diabetes [6]. Therefore, maintaining a healthy diet and implementing positive changes to dietary habits and behaviors on a daily basis are crucial steps towards preventing the onset of type 2 diabetes [7].
Cheese is a byproduct of ancient biotechnological processes and is a popular functional food in many regions of the world [8]. As a result, any biological consequences of cheese consumption could have a considerable impact on public health, and the impacts of cheese consumption on health outcomes are of interest and significance. A new comprehensive review and dose-response meta-analysis revealed an inverse linear relationship between cheese consumption and the risk of type 2 diabetes, with pooled risk ratios of 0.80 (95% CI: 0.63–0.93) for 30 g/day of cheese consumption [9]. Similarly, another meta-analysis found that eating 50 g of cheese daily reduced the incidence of type 2 diabetes by 8% [10]. Furthermore, a meta-analysis discovered a moderate link between cheese consumption and type 2 diabetes [11]. Nonetheless, certain epidemiological or cohort studies have demonstrated that eating cheese was unrelated to type 2 diabetes [12–14]. There are several possible reasons for conflicting results in observational epidemiological studies, such as variations in the study population, sample size, and methodologies for assessing cheese consumption, as well as factors adjusted in statistical models. Furthermore, estimating cheese consumption may be skewed due to bias and reverse causality inherent in traditional epidemiological studies. Because the results of observational research were frequently skewed by confounding factors, a novel Mendelian randomization (MR) method has been widely employed to determine causality. With the advancement of life sciences and statistics, as well as the release and sharing of a significant quantity of publicly available genetic data from large cohorts, two-sample MR studies have grown in popularity in recent years. The earliest gene-dietary behavior mapping research used genetic linkage and candidate gene analysis, but these methods have mostly been replaced by genome-wide association studies (GWAS), which have revealed a number of putative biological loci underlying dietary behaviors [15], and a huge amount of publicly available GWAS data are now available, providing a rich source of prospective instruments and greatly facilitating MR analysis [16]. MR has the advantage of minimizing confounding over traditional observational studies by using genetic variants associated with exposure as instrumental variables to infer the causality of the risk factor with respect to outcome diseases, independent of any potential known or unknown confounding factors [17]. Importantly, the MR method prevents reverse causation bias because the genotype cannot be changed by diseases [17].
Therefore, in order to offer some support for diabetes prevention in the future, we carried out a two-sample MR study to investigate the causal association between cheese intake and type 2 diabetes.
Material and methods
Study design
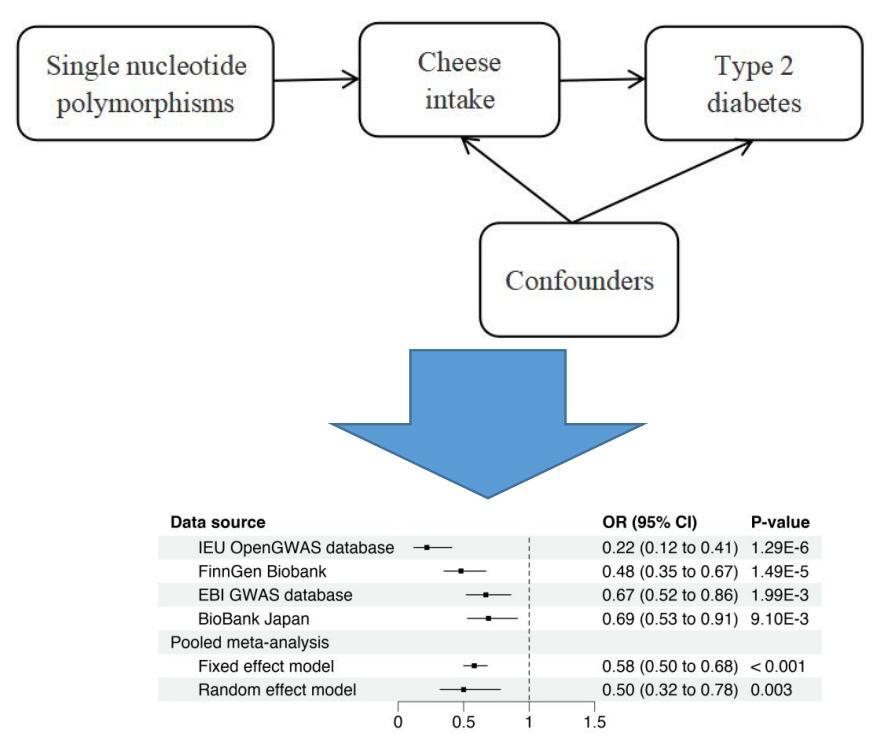
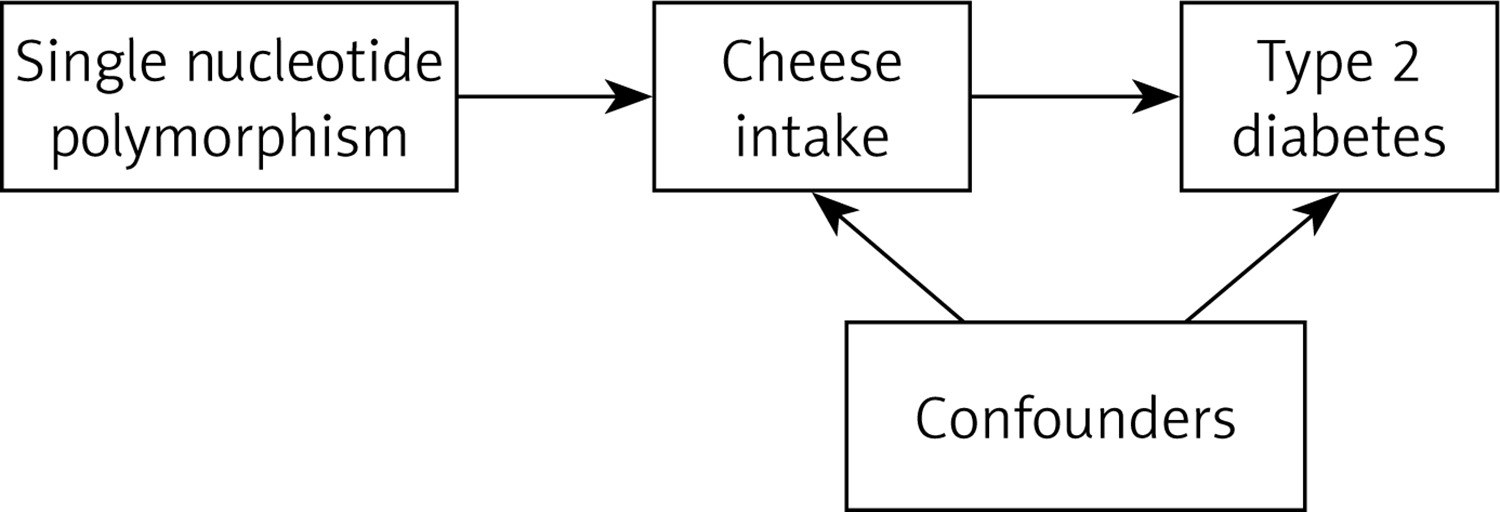
A two-sample MR analysis was designed to examine whether cheese intake traits were causally connected to type 2 diabetes. This study was carried out in accordance with the Strengthening the Reporting of Observational Studies in Epidemiology Using MR Statement (https://pubmed.ncbi.nlm.nih.gov/34698778/). Before causal inferences could be made based on this MR design, three assumptions needed to be satisfied: (1) after adjusting for confounding variables and cheese consumption characteristics, the selected genetic variant was found to be strongly correlated with cheese consumption; (2) confounding factors were found to be strongly correlated with the selected genetic variant; and (3) type 2 diabetes was not found to be correlated with the selected genetic variant. The relevant hypothetical process for this two-sample MR study is demonstrated in Figure 1. Since the data utilized in this investigation were summary-level data from publicly accessible sources, the original study obtained informed permission and ethical approval. The Guangdong Provincial People’s Hospital Ethics Committee also approved this analysis (KY-Q-2021-244-01).
Cheese intake assessment
The UK Biobank provided the summary-level genetic data on cheese intake. The UK Biobank also used food frequency questionnaires tailored to each center or diet histories assessed through in-person interviews or self-administered to estimate habitual food consumption over the preceding year. Five web-based 24-hour recalls (Oxford WebQ) were used to assess food consumption, allowing for seasonal variations.
Genetic instrument selection
To select all single nucleotide polymorphisms (SNPs), three requirements had to be met: a clumping distance greater than 10,000 kb, a genome-wide significance level (p < 5 × 10⁻⁸), and a lack of linkage disequilibrium (LD) at a threshold of R2 < 0.001. In the literature on instrumental variables, the relevance assumption was generally supported by an F-statistic value above 10. If an exposure SNP was missing from an outcome dataset, proxy SNPs with a minimum LD R2 value of more than 0.8 and a minor allele frequency (MAF) threshold for matching palindromes greater than 0.3 should be used instead.
Data sources for exposure and outcome
All analyses were conducted on publicly accessible genetic association summary data. The IEU OpenGWAS database (https://gwas.mrcieu.ac.uk/) provided all of the summary-level genetic information for type 2 diabetes and the relevant outcome information related to cheese consumption as exposure. Using a total of 9,851,867 SNPs, summary-level genetic data on cheese consumption was obtained from UK Biobank (451,486 individuals). Type 2 diabetes was the outcome variable for this MR investigation. The keyword utilized in the GWAS database search was type 2 diabetes, and the trait with the greatest sample size was chosen as the enrolled dataset. Finally, summary-level data on type 2 diabetes were derived from four datasets: (1) IEU OpenGWAS database with the trait “ieu-a-24” (149,821 cases, 34,840 cases/control 114,981 cases); (2) FinnGen Biobank with the trait “finn-b-E4_DM2” (215,654 cases, 32,469 cases/control 183,185 cases); (3) EBI GWAS database with a trait of “ebi-a-GCST010118” (433,540 cases, 77,418 cases/control 356,122 cases); (4) BioBank Japan with a trait of “bbj-a-153” (210,865 cases, 40,250 cases/control 170,615 cases). The population from the IEU OpenGWAS database was of mixed ancestry, whereas the populations from FinnGen Biobank and UK Biobank were European, and the populations from the EBI GWAS database and BioBank Japan were both East Asian. The comprehensive descriptions of the included qualities are summarized in Table I.
Table I
Description of included traits
Statistical analysis
The principal effects of cheese consumption on type 2 diabetes outcomes under dispersion were estimated using the inverse variance weighted (IVW) method. The IVW method is frequently employed in MR research to combine the effect generated from each instrument. We performed sensitivity analyses to evaluate robustness using the MR-Egger regression, weighted median, and weighted mode methods. As a sensitivity analysis, the weighted mode approach was an alternative MR method based on different assumptions about horizontal pleiotropy. In addition to leave-one-out sensitivity analysis, weighted mode approaches were used. The IVW and MR-Egger methods were used to assess heterogeneity. MR-Egger regression accounted for horizontal pleiotropic effects and yielded unbiased causal effect estimates, despite the fact that the estimates were frequently underpowered. The IVW method was used to quantify the main impacts of cheese consumption on type 2 diabetes outcomes in a dispersed setting. The IVW method is widely used in MR research to integrate the influence of each instrument. To assess robustness, we ran sensitivity analyses with the MR-Egger regression, weighted median, and weighted mode methods. As a sensitivity study, the weighted mode method was used as an alternative MR method with varied horizontal pleiotropy assumptions. In addition to leave-one-out sensitivity analysis, the weighted mode method was utilized. The IVW and MR-Egger methods were used to determine heterogeneity. MR-Egger regression controlled for horizontal pleiotropic effects and produced unbiased causal effect estimates, despite the fact that the estimates were often underpowered. To test for heterogeneity, the Cochrane Q statistic was used, and horizontal pleiotropy was discovered using the MR-Egger regression technique. Instrumental variables (IVs) with horizontal pleiotropy showed a nonzero and statistically significant MR-Egger intercept (p < 0.05). Scatter plots, forest plots, and funnel plots were used to visualize the data. The effect of each SNP was proven with forest plots. In the forest plots, MR-Egger analysis was also shown. To examine how each instrument affected the overall effect, a leave-one-out analysis was used. The MR estimations of causality between cheese consumption and type 2 diabetes risk were expressed as odds ratios (OR) and corresponding 95% confidence intervals (CIs). Furthermore, because the MR outcomes were derived from independent datasets, they were pooled and meta-analyzed using fixed and random effect models to give an overall causal estimate, with heterogeneity examined. The MR analysis was conducted using R software (version 4.0.3, http://www.r-project.org) and the R package TwoSampleMR version 0.5.5 (https://mrcieu.github.io/TwoSampleMR/).
Results
MR estimates
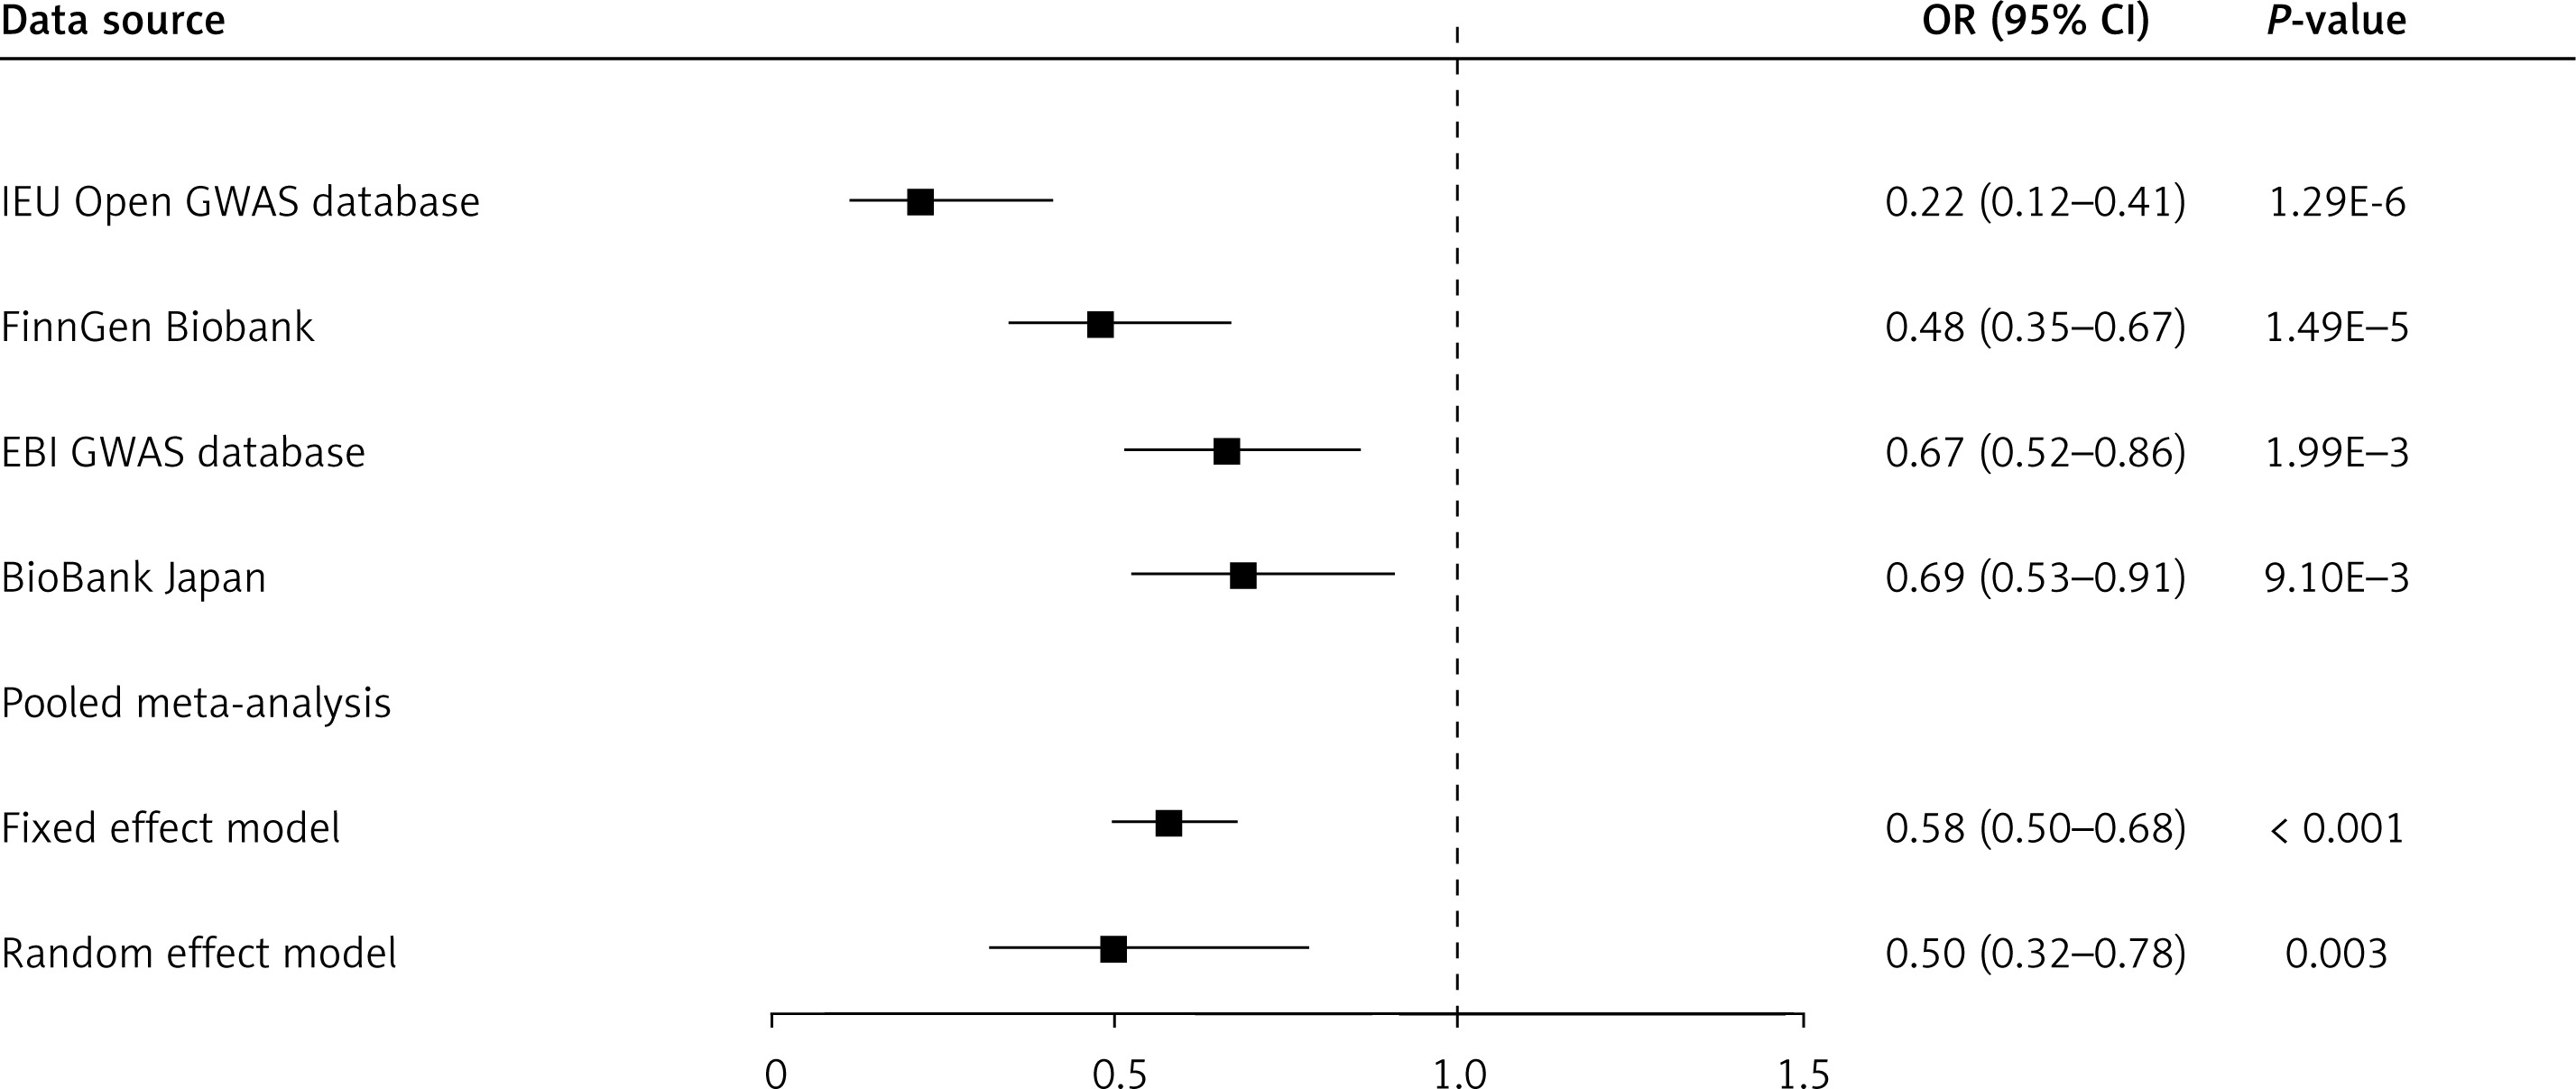
In the IEU OpenGWAS database, we found 14 independent significant SNPs strongly associated with type 2 diabetes in individuals of mixed ancestry, 61 SNPs of European ancestry in the FinnGen Biobank, 52 SNPs of East Asian ancestry in the EBI GWAS database, and 48 SNPs of East Asian ancestry in BioBank Japan (Table II). Higher levels of cheese consumption were associated with a lower risk of type 2 diabetes, according to the two-sample MR conducted with the IEU OpenGWAS database, FinnGen Biobank, EBI GWAS database, and BioBank Japan. The causal estimate from the IEU OpenGWAS database showed about a 78% decrease in odds of type 2 diabetes per standard deviation (SD) higher cheese intake (OR = 0.22; 95% CI: 0.12–0.41; p = 1.291E-6) according to the IVW method. Similar causal estimates were also found in FinnGen Biobank (OR = 0.48; 95% CI: 0.35–0.67; p = 1.486E-5), EBI GWAS database (OR = 0.67; 95% CI: 0.52–0.86; p = 1.989E-3) and BioBank Japan (OR = 0.69; 95% CI: 0.53–0.91; p = 9.103E-3) based on the IVW method (Table II). The result of the MR-Egger approach was 0.35 (95% CI: 0.02–7.47; p = 0.516), 1.25 (95% CI: 0.32–4.97; p = 0.747), 1.09 (95% CI: 0.40–2.93; p = 0.870) and 1.37 (95% CI: 0.48–3.93; p = 0.561) in the IEU OpenGWAS database, FinnGen Biobank, EBI GWAS database and BioBank Japan, respectively. In the four data sets mentioned above, the weighted median and weighted mode techniques yielded results in the same direction as the IVW method, despite some of the results not being statistically significant (Table II). Furthermore, a meta-analysis using fixed-effect IVW models revealed that for type 2 diabetes, the combined odds ratios were 0.58 (95% CI: 0.50–0.68; p < 0.001) and 0.50 (95% CI: 0.32–0.78; p = 0.003) in fixed and random effect models, respectively (Figure 2).
Table II
Mendelian randomization for the association of cheese intake with type 2 diabetes
Figure 2
Forest plot showing the association of cheese intake with type 2 diabetes. Higher levels of cheese consumption were associated with a lower risk of type 2 diabetes, according to the two-sample MR conducted with the IEU OpenGWAS database, FinnGen Biobank, EBI GWAS database, and BioBank Japan. The meta-analysis using fixed-effect IVW models revealed that cheese consumption was associated with type 2 diabetes in fixed and random effect models
OR – odds ratio, CI – confidence interval.
Sensitivity analyses
We tested the sensitivity of several MR techniques, such as the weighted mode, weighted median, and MR-Egger approaches. Figure 3 presents the findings for all three ways. MR-Egger regression revealed that genetic pleiotropy did not skew or interfere with MR results, and there were no main effect IVs (intercepts were –7.8E-3, –0.016, –0.0085, and –0.012, respectively; all p > 0.05). Figure 4 presents the MR-Egger visualization results in the form of a scatter plot. The MR-Egger and IVW algorithms identified heterogeneity in all four data sets (all p < 0.05) (Table II). Additionally, the two-sample MR results were accurate, and the leave-one-out analysis for each IV demonstrated that all IV calculations indicated that these causal linkages were significant, suggesting that there was no dominant IV for cheese intake and type 2 diabetes (Figure 5).
Figure 3
Scatter plot to visualize the causal effect of cheese intake on type 2 diabetes risk using four Mendelian randomization (MR) methods. The slope of the straight line indicates the magnitude of the causal association. The plot presents the effect sizes of the SNP-cheese intake association (x-axis, SD units) and the SNP-type 2 diabetes association (y-axis, log (OR)) with 95% confidence intervals. The regression slopes of the lines correspond to causal estimates using the four Mendelian randomization (MR) methods. A – The scatter plot visualizes the causal effect of cheese intake on type 2 diabetes risk in the IEU OpenGWAS database. B – The scatter plot visualizes the causal effect of cheese intake on type 2 diabetes risk in the FinnGen Biobank database. C – The scatter plot visualizes the causal effect of cheese intake on type 2 diabetes risk in the EBI GWAS database. D – The scatter plot visualizes the causal effect of cheese intake on type 2 diabetes risk in the BioBank Japan database
SNPs – single nucleotide polymorphisms, IVW – inverse variance weighted, MR – Mendelian randomization, OR – odds ratio, CI – confidence interval, SD – standard deviation
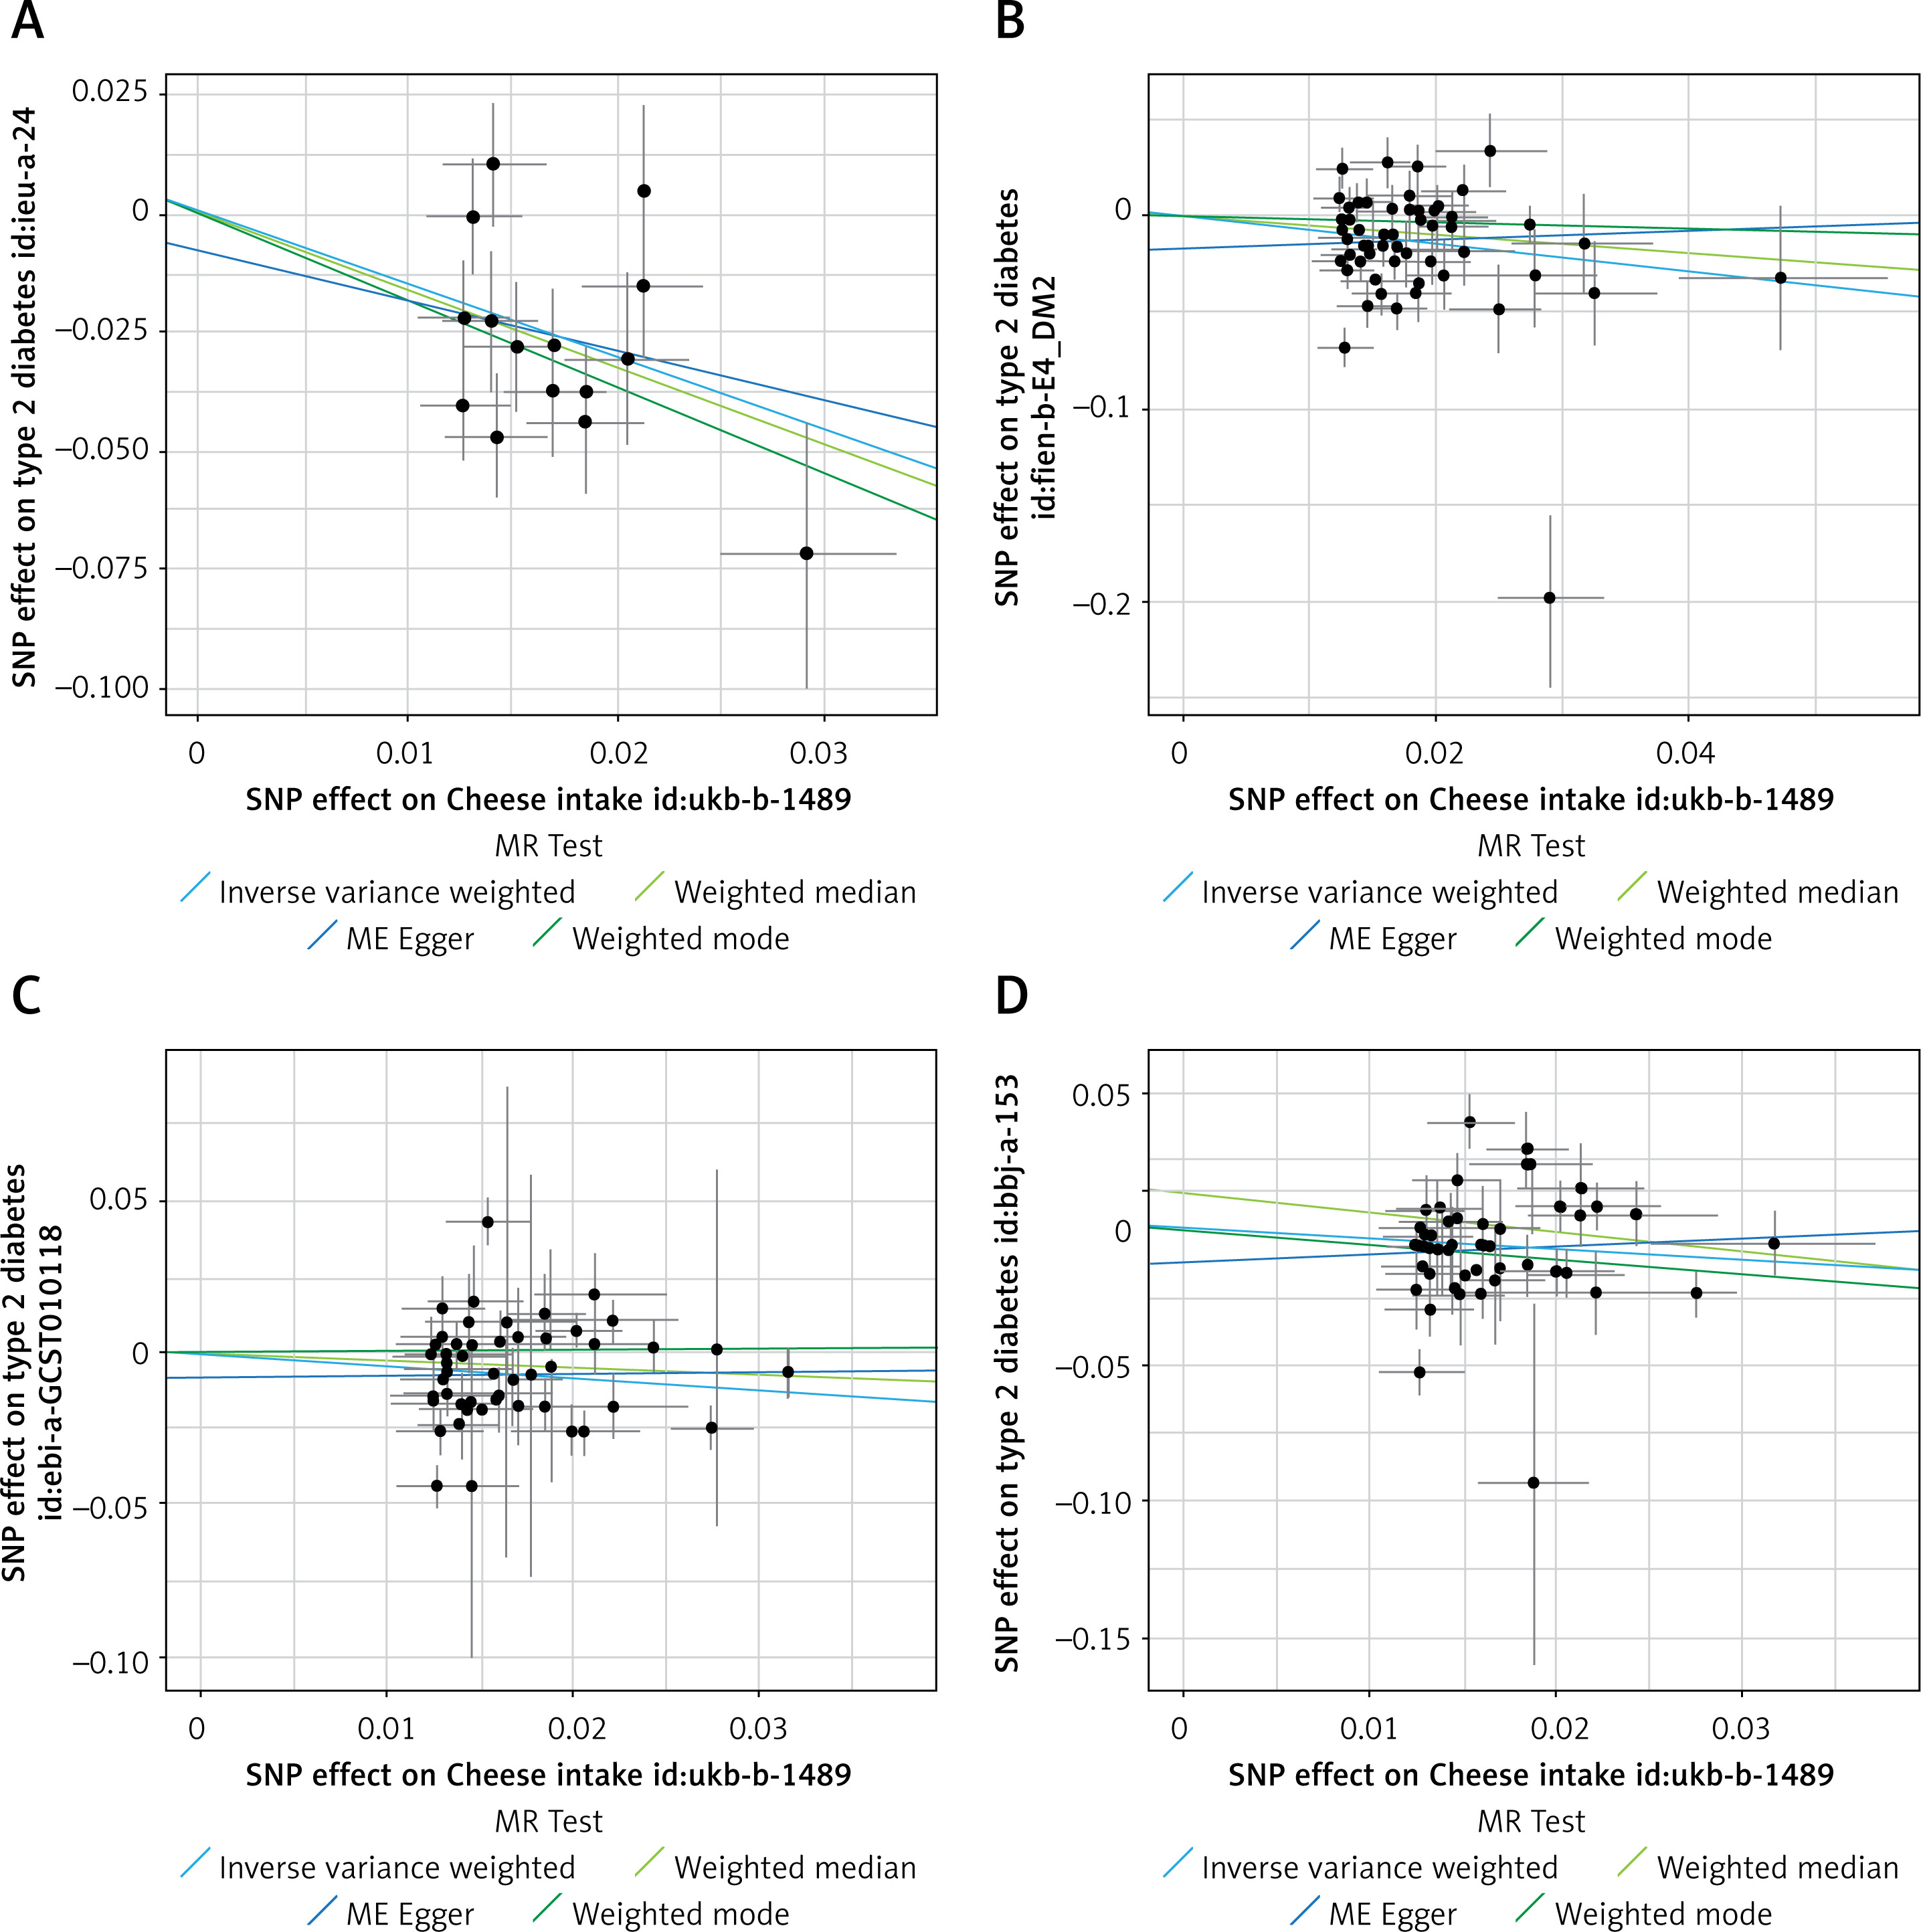
Figure 4
Forest plot showing the association of each single nucleotide polymorphisms with type 2 diabetes. Each black point represents the result of the IVW MR method applied to estimate the causal effect of each SNP on type 2 diabetes. Each red point depicts the IVW and MR-Egger estimate using all SNPs. A – Forest plot in IEU OpenGWAS database. B – Forest plot in IEU FinnGen Biobank C – Forest plot in EBI GWAS database. D – Forest plot in BioBank Japan
SNPs – single nucleotide polymorphisms. IVW – inverse variance weighted, MR – Mendelian randomization.
Figure 5
Leave-one-out analysis of each single nucleotide polymorphism associated with cheese intake and type 2 diabetes risk. Each black point represents the result of the IVW MR method applied to estimate the causal effect of cheese intake on type 2 diabetes excluding a particular SNP from the analysis. Each red point depicts the IVW estimate using all SNPs. A – MR leave-one-out sensitivity analysis in IEU OpenGWAS database; B – MR leave-oneout sensitivity analysis in IEU FinnGen Biobank C – MR leave-one-out sensitivity analysis in EBI GWAS database; D – MR leave-one-out sensitivity analysis in BioBank Japan
SNPs – single nucleotide polymorphisms. IVW – inverse variance weighted, MR – Mendelian randomization.
Discussion
A significant inverse causal relationship between cheese consumption and the incidence of type 2 diabetes was revealed by the two-sample MR study, regardless of European, East Asian, or mixed-race ancestry. Although there was significant heterogeneity, it had no effect on the IVW results, indicating that our conclusion was valid.
Our results were in line with earlier observational studies that suggested an adverse relationship between type 2 diabetes and cheese consumption. Two meta-analyses have been conducted to synthesize previous cohort studies [9, 10]. A meta-analysis of eight cohort studies, totaling 17,620 cases among 242,960 people, revealed a non-heterogeneous relationship between cheese consumption and a lower risk of type 2 diabetes [10]. Another meta-analysis that included seven cohort studies with a total sample size of 178,429 participants (14,810 cases) found that cheese consumption was inversely related to the occurrence of type 2 diabetes [9]. In addition, Celia [11] found a moderate correlation between the onset of type 2 diabetes and cheese consumption in a meta-analysis. Several earlier cohort studies, however, have discovered inconsistencies between the results of this two-sample MR study [12–14], which could be attributed to the fact that the previous observational studies were influenced by unexplained confounding factors.
Additionally, this study revealed substantial heterogeneity but no horizontal pleiotropy in SNPs, which could be attributed to the study populations being from different ancestors including Asian, mixed or European populations. However, whether Asian, mixed, or European populations, most sensitivity methods and pooled meta-analyses pointed in the same direction as the IVW. These analytical methodologies, such as MR analysis, leave-one-out sensitivity analysis, random and fixed effect models, and random and fixed effect models, guaranteed the dependability of the results in various populations [17], demonstrating that consuming cheese was advantageous in reducing diabetes and could be promoted in various demographics and countries, but additional research is needed to understand the underlying pathophysiology of diabetes connected with cheese consumption.
The protective effect of cheese consumption against the risk of type 2 diabetes may be attributed to multiple mechanisms. Firstly, cheese is a fermented dairy product rich in fatty acids and trans fats. Previous studies have linked trans fats to a lower incidence of insulin resistance and type 2 diabetes [18, 19]. Secondly, consuming certain foods, particularly dairy foods such as cheese, may reduce inflammatory risks, and systemic chronic inflammation may be a contributory cause of diabetes [20]. Thirdly, cheese contains less fat, which could be associated with a lower risk of diabetes. A prior comprehensive assessment discovered that eating three servings of dairy per day, particularly cheese, was associated with a decreased risk of type 2 diabetes [21]. Fourth, one study showed that higher total dairy consumption was associated with lower total mortality and cerebrovascular mortality among American adults, which we hypothesized may be due in part to the role of dairy in diabetes [22]. Furthermore, cheese, a frequent probiotic item, naturally includes living bacteria that play a vital function in controlling intestinal flora balance [23]. It has been found that dysbiosis of the gut microbiome contributes to the rapid evolution of insulin resistance in type 2 diabetes, and diabetes has been related to insulin resistance and dysbiosis of the gut microbiome, which affected intestinal barrier function and host metabolic pathways [24, 25]. Finally, the protein, calcium, vitamin D, and fatty acids found in cheese were among the main nutritious ingredients in the diets of many people, and cheese has long been considered to provide good nutrition [26, 27]. Vitamin D deficiency has been connected with type 2 diabetes, insulin resistance, and reduced insulin release in both experimental and epidemiological studies [28, 29]. Modulating insulin resistance and/or pancreatic β-cell activity may be related to vitamin D’s role in the pathogenic process of type 2 diabetes [30]. Although cheese eating was beneficial in the prevention of diabetes, more research was required to understand the likely association between cheese consumption and the risk of type 2 diabetes, as well as the underlying processes.
There were some strengths in this study. On the one hand, this study used the MR approach to minimize the confounding variables that are typical of epidemiological studies or are still unknown. On the other hand, this study performed a two-sample MR analysis to examine the perspective of etiology and causal connection using the biggest sample of cheese intake GWAS databases currently available as well as four type 2 diabetes GWAS databases. A larger sample size and several sensitivity analysis approaches guaranteed that the final causal effect value was more certain. Furthermore, the diverse ancestry, which included European, East Asian, and mixed ethnic individuals, confirmed the results’ generalizability. We performed a meta-analysis of MR relationships from the four datasets to improve the power and discovered a consistent combined association. Finally, because the exposure variables and research results were from different databases, there were no individuals whose samples overlapped.
Of course, there were significant limitations to this study. Firstly, the people included in this study had no additional ancestors, such as Africans. Secondly, although the sensitivity analysis largely agreed with the IVW results, there was some variation in this investigation. This could be because the study population came from distinct forebears, and earlier research has demonstrated that different genetic variations could occur in different ancestral sources [31]. We would be able to acquire a better grasp of genetic architecture in all populations by boosting variety among research participants [32]. Thirdly, the study was unable to explore the variations in the causal effects of cheese consumption on diabetes among different subgroups, such as gender, because the current analysis was based on summary-level data and lacked personal data. Fourthly, the lack of individual data made it difficult to analyze the linear or nonlinear dosage relationship and could not be used to provide recommendations for the daily amount of cheese consumption. Furthermore, it was difficult to validate genetic polymorphisms, and even using the MR-Egger approach, misclassification could not be completely avoided. Fifth, as the data come from public aggregated genetic data, this study cannot well define “cheese”, and because the nutritional composition and sources of cheese may vary greatly (e.g., from low-fat to high-fat, or from animal milk to plant-based cheese), the current scientific view is that not all types of cheese are suitable for frequent consumption by type 2 diabetes patients. Therefore, more detailed research is needed to generalize the findings, as it is likely that the link is due to something in cheese that raises blood lipids and atherosclerosis, which can lead to an increased risk of diabetes. Finally, cheeses are especially high in saturated fatty acids, so (also taking into account other cheese components) the results might be considered unexpected, and more research is needed for confirmation.
In conclusion, our data suggested that there may be an association between cheese and type 2 diabetes, and appropriate beneficial cheese intake may help prevent and control diabetes. However, it is necessary to carefully evaluate which types of cheese are suitable, and more research is needed to investigate the role of cheese components in diabetes. Assessing the person’s typical cheese consumption is the first step in creating a dietary plan. If a person is willing to modify their dairy intake, it might be helpful to offer guidance on how to include cheese in other healthy diet adjustments, particularly if they are at risk of type 2 diabetes. Nonetheless, additional experimental studies must be carried out in the future to investigate the underlying mechanisms of these connections.