Introduction
Lung cancer is the most common cause of cancer-related deaths worldwide [1]. Non-small cell lung cancer (NSCLC) accounts for 75% of all lung cancers and has two predominant subtypes, adenocarcinoma (ADC) and squamous cell carcinoma (SCC), which constitute 40% and 25% of NSCLC cases, respectively [2, 3]. Small cell lung cancer (SCLC) is a well-recognized histologic variant of lung cancer with a distinct histologic appearance and unique biology. SCLC accounts for approximately 16–18% of all newly diagnosed lung cancers in the United States, which translates into approximately 30,000 new cases annually [4–6]. Because of the lack of specific symptoms, most cases of lung cancer are diagnosed in the middle or late stages. Methods that may improve earlier detection include positron emission tomography, autofluorescence bronchoscopy, and molecular biomarkers [7]. Although diagnostic strategies, treatment techniques, and surgical approaches for lung cancer management have improved significantly in recent years, most patients with lung cancer still have a poor prognosis, with a 5-year survival rate of approximately 15% [8]. In comparison with NSCLC, SCLC features a shorter doubling time, higher growth fraction, and earlier development of widespread metastases [4–6]. The ability to identify target oncogenic alterations in lung cancer has been a major improvement in disease management. To translate knowledge of these molecular alterations into clinical practice, it is important to develop assays that can quickly and reliably identify specific aberrations in clinical specimens. Thus, identifying factors that contribute to lung cancer prognosis is highly relevant for optimizing treatments and improving the prognosis of patients.
Fibroblast growth factor receptor 1 (FGFR1) is an emerging molecular target for the treatment of SCC of the lung [9–11], and several clinical trials of FGFR inhibitors in NSCLC are currently underway [12–14]. Amplification of the FGFR gene has been found in epithelial malignancies, such as gastric, breast, oral squamous cell, ovarian, and bladder carcinomas [15, 16], and more recently, in lung SCC. The FGFR1 gene is amplified in lung cancer at varying frequencies and has been shown to be a driving oncogenic factor in lung cancer [17–20]. Thus, FGFR is a promising and novel therapeutic target for the treatment of these tumors.
Previous studies of FGFR1 amplification in lung cancer have focused on SCC [21, 22], several of which have investigated the relationship between FGFR1 amplification and clinical characteristics such as smoking status, disease stage, and sex; however, findings have been inconsistent across studies and meta-analyses [19, 22]. Additionally, published reviews lack data for Chinese patients. To perform an updated comprehensive quantitative evaluation of the relationship between FGFR1 amplification and the clinical characteristics of lung cancer, we conducted an updated meta-analysis of the published literature in this area. This study summarizes the current knowledge on FGFR1 amplification in the main subtypes of lung cancer and comprehensively reports the relationship between FGFR1 gene amplification and the clinicopathological characteristics of lung cancer.
Material and methods
Search strategy and selection criteria
We searched MEDLINE, EMBASE, Web of Science, and CNKI for articles published in English or Chinese between January 1991 and October 2016. The following search terms were used alone or in combination: Lung Neoplasms OR Pulmonary Neoplasms OR Lung Cancer OR Cancer, Lung OR Pulmonary Cancer OR Cancer, Pulmonary OR Cancer of Lung AND Receptor, Fibroblast Growth Factor, Type 1 OR Fibroblast Growth Factor Receptor 1 OR FGFR1 Protein.
The eligibility of all studies was evaluated and determined by two authors (JM and RL), who scored each study independently. Inclusion criteria were (1) FGFR1 amplification was measured in lung cancer; (2) when the same group of patients was included in more than one article, the most recent or the most informative report was utilized; (3) only articles published as full-text papers in English or Chinese were included; and (4) test methods included reverse transcription polymerase chain reaction (RT-PCR), fluorescent in situ hybridization (FISH), or silver in situ hybridization (SISH). Exclusion criteria were (1) reviews or case-only studies, (2) studies lacking sufficient data for pooling analysis, and (3) duplication of previous publications or replicated samples.
Data extraction and methodological assessment
The following clinical characteristics for patients and other study data were extracted from each study: surname of the first author, year of publication, patient geographic region, histology, FGFR1 gene copy number, test method, the definition of FGFR1 amplification, and number of cases and controls. The two reviewers assessed study quality independently using the following factors: (1) a clear definition of the study population and the type of carcinoma, (2) a clear definition of the measurement method and the cut-off value of FGFR1 gene amplification, (3) sample size larger than 10, and (4) a clear definition of the outcome assessment (if applicable). Studies lacking any of these elements were excluded from the final analysis.
The two reviewers independently read and scored each study according to the NEWCASTLE-OTTAWA scale [23]. The quality score was assessed according to three main categories: (1) patient selection, (2) comparability between the case and control groups, and (3) exposure assessment method. The maximum score was 9 points, and a high-quality study in our analysis was defined as a study with ≥ 7 points (7.42 ±0.98). Any disagreement was resolved by consensus.
Statistical analysis
The statistical heterogeneity was estimated with Cochran’s Q (reported as χ2 and p-values) and the I 2 statistic, which indicates the percentage of variation between studies that is due to heterogeneity rather than chance. Unlike Q, I 2 does not inherently depend on the number of studies included; values of 25%, 50%, and 75% indicate low, moderate, and high degrees of heterogeneity, respectively. If the heterogeneity was high (p < 0.1) [24], a random-effects model was used; otherwise, a fixed-effects model was used [25]. Subgroup analyses were performed to explore heterogeneity. Sensitivity analyses were performed to assess the stability of the results, and Begg’s funnel plots were used to assess publication bias [26]. All p-values were two-sided, with p < 0.05 considered statistically significant, except in the Q-test. Results are reported in a forest plot, with 95% CI. Statistical analyses were conducted using STATA version 11.0 (StataCorp LP, College Station, TX, USA). In addition, relative risks (RRs) were estimated for the rate of FGFR1 amplification in different types of lung cancer and different geographic regions using χ2 tests. The mean and 95% CI were estimated using SPSS Statistics 17.0.
Results
Selection of studies and trial flow
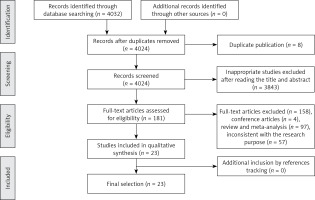
Figure 1 shows the results of the literature search. A total of 4032 potentially relevant abstracts were identified, and 3940 inappropriate studies were removed after reading the title and abstract. Eight were found to be duplicates and were excluded. Another four conference articles were excluded. Fifty-seven studies were excluded because they did not meet the inclusion criteria, including 55 reviews and two meta-analyses. Twenty-three studies met the eligibility criteria and were included in this systematic review.
Study characteristics
In total, 5252 patients participated in the 23 studies included in this analysis. Six studies were conducted in Asia, eight in Europe, seven in the United States, and two in Australia. The gene copy number for FGFR1 was evaluated using FISH in 16 studies [10, 11, 18, 21, 27–38], RT-PCR in three studies [39–41], SISH in two studies [42, 43], single-nucleotide polymorphism in one study [9], and DNA in one study [44]. Based on data shown in Tables I and II, we concluded that the prevalence of FGFR1 amplification in these studies ranged from 4.9% to 49.2% in NSCLC, 5.1% to 41.5% in SCC (mean = 19.8%, 95% CI: 15.8–23.8), 0% to 14.7% in ADC (mean = 5.4%, 95% CI: 1.7–9.1), and 0% (0/9) [42] to 7.8% in SCLC (mean = 6.1%, 95% CI: 4.3–8.0). The prevalence of FGFR1 amplification in lung cancer ranged from 5.6% to 22.2% in Europe [10, 18, 21, 27, 31, 34, 35, 37] (mean = 12.4%, 95% CI: 8.5–16.3), 4.1% to 18.2% in the United States [9, 11, 29, 30, 36, 39, 44] (mean = 12.5%, 95% CI: 5.6–19.4), 7.8% to 49.2% in Asia [28, 32, 38, 40, 41, 43] (mean = 21.1%, 95% CI: 8.7–33.5), and 14.2% to 18.6% in Australia [33, 42] (mean = 12.5%, 95% CI: 6.7–18.4). The main characteristics of the included studies are shown in Tables I and II.
Table I
Clinical characteristics of the studies
| Author | Year | Race | NP | FGFR1+, n (%) | Histology | Method | Cut-off |
|---|---|---|---|---|---|---|---|
| Sousa [10] | 2016 | Portugal | 76 | 15 (19.7) | NSCLC | FISH | FGFR1/CEN8 ratio ≥ 2.0 |
| Cihoric [31] | 2014 | Switzerland | 329 | 41 (12.5) | NSCLC | FISH | FGFR1/CEP8 ratio ≥ 2.0 |
| Toschi [11] | 2014 | United States | 445 | 74 (16.6) | NSCLC | FISH | ≥ 4 gene copies/cell |
| Seo [32] | 2014 | Korea | 369 | 32 (8.7) | NSCLC | FISH | Gene copy number ≥ 6.2 |
| Russell [33] | 2014 | Australia | 352 | 50 (14.2) | LC | FISH | FGFR1/CEN8 ratio ≥ 2.0; tumor cell percentage with ≥ 15 signals ≥ 10%; or average number of signals/tumor cell nucleus ≥ 6 |
| Tran [42] | 2013 | Australia | 264 | 49 (18.6) | NSCLC | SISH | FGFR1/CEP8 ratio ≥ 2.0; mean FGFR1 signals per tumor cell ≥ 6.0; or percentage of tumor cells containing FGFR1 clusters ≥ 10% |
| Kim [28] | 2013 | Korean | 262 | 34 (15.3) | SCC | FISH | Gene copy number ≥ 9 |
| Craddock [29] | 2013 | Canada | 121 | 22 (18.2) | SCC | FISH | Mean FGFR1 copy number per cell > 5.0 |
| Gadgeel [39] | 2013 | United States | 345 | 17 (4.9) | NSCLC | RT-PCR | Copy number variations > 3.5 |
| Ren [41] | 2013 | China | 59 | 29 (49.2) | NSCLC | RT-PCR | > 2-fold compared with their adjacent normal counterparts |
| Schildhaus [27] | 2012 | Germany | 400 | 60 (15.0) | NSCLC | FISH | (1) FGFR1/CEN8 ratio ≥ 2.0; (2) average number of FGFR1 signals per tumor cell nucleus ≥ 6; (3) percentage of tumor cells containing ≥ 15 FGFR1 signals or large clusters ≥ 10% |
| Heist [30] | 2012 | United States | 226 | 37 (16.4) | SCC | FISH | FGFR1/CEP8 ratio ≥ 2.2 |
| Goke [21] | 2012 | Germany | 72 | 12 (16.7) | SCC | FISH | Gene copy number ≥ 9 |
| Kohler [35] | 2012 | Germany | 260 | 20 (7.7) | LC | FISH | Gene copies ≥ 4 |
| Sasaki [40] | 2012 | Japan | 100 | 32 (32.0) | NSCLC | RT-PCR | > 4 copies |
| Dutt [9] | 2011 | United States | 732 | 44 (6.0) | NSCLC | SNP | > 3.25 copies |
| D Wang [38] | 2014 | China | 142 | 24 (16.9) | SCC | FISH | FGFR1/CEP8 ratio ≥ 2.0 or FGFR1 signals per tumor cell nucleus ≥ 6 |
| Weiss [34] | 2010 | Germany | 153 | 34 (22.2) | SCC | FISH | Gene copy number > 9 |
| LP Zhang [43] | 2015 | China | 77 | 6 (7.8) | SCLC | SISH | FGFR1 copies of ≥ 6 or FGFR1/CEN8 ratio ≥ 2 |
| Thomas [36] | 2014 | United States | 68 | 5 (7.4) | SCLC | FISH | FGFR1/CEN8 ratio > 2 |
| Schultheis [18] | 2014 | Germany | 251 | 14 (5.6) | SCLC | FISH | (1) FGFR1/CEN8 ratio ≥ 2.0; (2) FGFR1 gene count per tumor cell ≥ 6.0; (3)percentage of tumor cells containing ≥ 15 FGFR1 gene copies ≥ 10%; (4) percentage of tumor cells containing ≥ 5 FGFR1 gene copies ≥ 50% |
| Peifer [37] | 2012 | Germany | 51 | 3 (5.9) | SCLC | FISH | Copy number ≥ 3.5 |
| Ross [44] | 2014 | United States | 98 | 4 (4.1) | SCLC | DNA | N/A |
Table II
FGFR1 amplification in different pathological subtypes
Test of heterogeneity
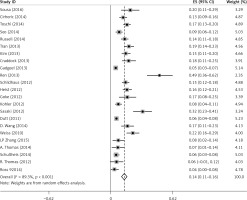
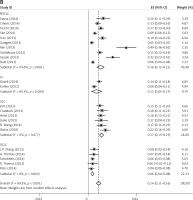
There was some heterogeneity among studies regarding the prevalence of FGFR1 amplification (I 2 = 89.3%, p < 0.001) (Figure 2).
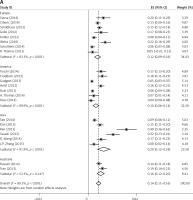
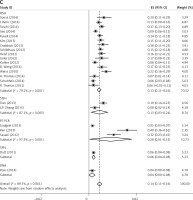
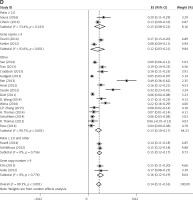
Subgroup analyses according to geographic region, pathologic type, test method, and definition of FGFR1 amplification revealed the following findings regarding heterogeneity from the same geographic region (Europe: I2 = 83.3%, p < 0.001; United States: I2 = 89.9%, p < 0.001; Asia: I2 = 91.9%, p < 0.001; Australia: I2 = 52.5%, p = 0.147; Figure 3 A), the same pathologic type (SCC: I2 = 0.0%, p = 0.677; SCLC: I2 = 0.0%, p = 0.843; NSCLC: I2 = 93.6%, p < 0.001; Figure 3 B), the same test method (FISH: I2 = 79.2%, p < 0.001; SISH: I2 = 87.1%, p = 0.005; Figure 3 C); the same definition of FGFR1 amplification (ratio ≥ 2.0: I2 = 53.4%, p = 0.143; gene copy number > 9: I2 = 0.0%, p = 0.776; Figure 3 D). Thus, these results show no significant heterogeneity among studies for SCC, SCLC, the same definition of FGFR1 amplification, and Australia (Figure 3).
Prevalence of FGFR1 gene amplification
RRs were estimated for the rate of FGFR1 amplification in different types of lung cancer. There were 2285 SCC, 1860 ADC, and 545 SCLC patients who participated in the 23 studies included in this analysis; of these, there were 450, 87, and 32 patients, respectively, who exhibited FGFR1 amplification. The prevalence of FGFR1 amplification was significantly higher in SCC than that in ADC (RR = 5.2, 95% CI: 4.1–6.7) and SCLC (RR = 4.2, 95% CI: 2.9–6.1); it was also significantly higher in ADC than that in SCLC (RR = 0.8, 95% CI: 0.6–1.3). Of 3731 NSCLC patients who participated in the 12 studies, 463 exhibited FGFR1 amplification (93 in Asia and 370 in other geographic regions). The mean FGFR1 amplification rate was 30.0% (95% CI: –0.2 to 0.84) in Asia, 13.7% (95% CI: 0.1–0.2) in Europe, 10.8% (95% CI: –0.6 to 0.9) in the United States, and 12.9% (95% CI: –0.6 to 0.9) in Australia. The rate of FGFR1 amplification was higher in Asians than that in non-Asians (RR = 1.9, 95% CI: 1.5–2.4).
Publication bias and sensitivity analyses
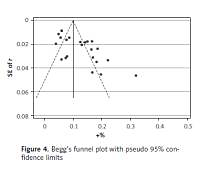
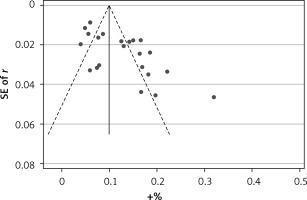
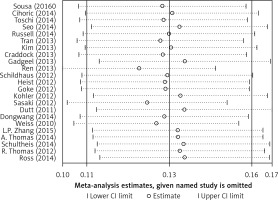
Begg’s funnel plot and Egger’s regression test were applied to detect publication bias in the meta-analysis. In all included studies, funnel plot asymmetry was found (p = 0.006), with a 95% CI of –0.03 to 6.96 in Egger’s test. Therefore, publication bias was evident from the analysis (Figure 4). Sensitivity analyses were performed to assess the impact of individual studies on the results. As shown in Figure 5, we found no significant difference among the 23 studies.
Discussion
This meta-analysis indicated that the prevalence of FGFR1 amplification ranged from 4.9% to 49.2% in NSCLC, 5.1% to 41.5% in SCC, 0% to 14.7% in ADC, and 0% to 7.8% in SCLC. In addition, we found that FGFR1 amplification occurs more frequently in SCC than in ADC and SCLC. In the subgroup analyses, no significant heterogeneity was detected for SCC, SCLC, and Australia. We also found that the prevalence of FGFR1 amplification was higher in Asians than in non-Asians.
Wang et al. [22] reviewed a total of 12 studies involving 3178 lung SCC patients and suggested that FGFR1 amplification occurs more frequently in male patients, SCC, and smokers and that FGFR1 amplification is a risk factor for poor prognosis among Asian patients with SCC. In contrast, Jiang et al. [19] reviewed a total of 13 studies involving 1798 lung SCC patients and suggested that sex, stage, ethnicity, and test methods have no influence on FGFR1 amplification. The conclusions were therefore inconsistent; however, these reviews involved only patients with SCC.
We sought to examine the association between FGFR1 gene amplification, pathological characteristics, and ethnicity in lung cancer. This meta-analysis was performed with a total of 23 studies involving 5252 lung cancer patients and included data on Chinese patients. However, our systematic review with meta-analysis has some limitations that should be acknowledged. Firstly, the number of included studies was relatively small; thus more data with patients from different ethnicities are needed to conduct a thorough analysis. Secondly, it is possible that there is some degree of publication bias in this area of research.
To identify the source of heterogeneity, we performed subgroup analyses for lung cancer type and ethnicity and found that heterogeneity was non-existent for studies using the same ethnicity and lung cancer type. Subgroup analysis for the FGFR1 amplification rate evaluated using the same method showed that studies performed using FISH were approximately heterogeneous. However, after pooling the data from studies using the same definition of FGFR1 amplification, there was no heterogeneity. To encourage the widespread evaluation of FGFR1 amplification in clinical diagnostics and research laboratories, the definition and test methods should be standardized.
To determine the association between FGFR1 gene amplification and pathological characteristics, as well as ethnicity in lung cancer, RRs and the corresponding 95% CIs were calculated for the rate of FGFR1 amplification. The prevalence of FGFR1 amplification was significantly higher in SCC than in ADC and SCLC, and it was higher in Asians than in non-Asians. More studies are needed to determine whether there is a significant difference between the rates of FGFR1 amplification in different ethnicities.
For the treatment of NSCLC, the late provision of palliative care to patients limits improvements in the quality of life [45]. Furthermore, targeted therapy is also important. The current study is an updated comprehensive meta-analysis of FGFR1 amplification in lung cancer and indicates that FGFR1 amplification may become a potential new therapeutic target for specific patient populations and cancer subtypes. Because patients with SCC of the lung have limited options in terms of systemic therapies, they might benefit from targeted therapy. Currently, treatment with dovitinib, which inhibits FGFR, has demonstrated modest efficacy in patients with advanced SCC and FGFR1 amplification [46]. However, in contrast to targeted therapy in ADC, the results of trials targeting FGFR1 in squamous cell lung cancers have generally been disappointing. Gene amplification or overexpression of FGFR1 may not be a sufficiently robust predictor of the efficacy of FGFR1 inhibitors [14]. Therefore, the value of FGFR1 amplification in lung cancer treatment needs to be further investigated.


