Introduction
With a prevalence rate of 5–15%, polycystic ovary syndrome (PCOS) currently is one of the most frequent endocrine disorders in fertile women [1]. As first reported by Stein and Leventhal, PCOS is characterized by polycystic ovaries, oligo-amenorrhea, obesity, acne, and hirsutism [2]. As one of the most thoroughly studied agents for insulin sensitization, metformin (met) is frequently used in the treatment of insulin-independent diabetes, insulin resistance (IR) and PCOS by reducing IR and inhibiting the production of ovarian androgen. The effect of met in the treatment of PCOS is exerted through 17α-hydroxylase and steroidogenic acute regulatory protein [3]. In addition, it was suggested that met might help the regulation of menstrual cycles and weight management during PCOS when used in conjunction with lifestyle change [4].
As a new type of myokine and adipose cytokine that has been discovered only recently, irisin is mainly synthesized from fibronectin type III domain-containing protein 5 (FNDC5) in skeletal muscles during exercises [5]. The presence of irisin can increase the level of uncoupling protein 1 (UCP1) and hence promote energy consumption and thermogenesis of adipose tissues [5]. In addition, it was shown that irisin could promote the proliferation of human umbilical vein endothelial cells (HUVEC) [6]. Since irisin generally leads to increased energy consumption in beige and brown adipose tissues, it has been speculated that irisin could also increase the energy metabolism in PCOS patients to counteract the inflow of excess energy [5]. Also, the increased level of irisin may be associated with a stage of “irisin resistance” featured by resistance to leptin, fibroblast growth factor 21 and insulin, as a high level of circulating hormones fails to trigger a desired physiological effect [7–10].
As two types of the most recognized non-coding RNAs, lncRNA [11, 12] and miRNAs [13] play critical roles in regulating gene expression. In particular, aberrant expression of lncRNAs and miRNAs has been implicated in the pathogenesis of various metabolic disorders, such as PCOS, diabetes and obesity [14, 15].
Met has been reported to decrease the expression of UCA1, an endogenous competing RNA of miR-18a [16, 17]. In addition, by searching an online miRNA database, we found fibronectin type III domain-containing protein 5 (FNDC5), a precursor of irisin, as a possible target of miR-18a. Therefore, in this study, we investigated the relevant signaling pathway that may mediate the inhibitory effect of met on the expression of irisin.
Material and methods
Patients
In this study, we recruited a total of 100 PCOS subjects. Based on the status of PCOS, these subjects were divided into two groups: some patients received no met treatment (the PCOS group, n = 52) and the remaining patients received met treatment (the PCOS + Met group, n = 52). Met was prescribed to treat insulin resistance diagnosed on the basis of HOMA-IR. In addition, 48 healthy subjects were included in this study as normal controls (the control group). Relevant clinical information of each subject was collected both pre- and post-met treatment (if applicable), and the statistical evaluations of all three groups were compared. This study has been approved by the Ethics Committee of Human Research at our institution. Before the start of this study, an informed consent form was acquired from all subjects. In addition, the serum samples from all subjects were processed based on internationally recognized legal and ethical standards.
RNA isolation and real-time PCR
Total RNA was isolated from Hela and HEC-1-B cells or serum samples with a Mini Kit miRNeasy kit (Qiagen, Valencia, CA) following the protocol of the manufacturer. The quantity and quality of isolated RNA were evaluated on a Bioanalyzer 2100 system (Agilent Technologies, Santa Clara, CA). Subsequently, collected RNA samples were reversely transcribed into cDNA using a RT-PCR Kit (Applied Biosystems, Foster City, CA) in conjunction with a SYBR green master mix (Applied Biosystems, Foster City, CA). The quantification of UCA1, miR-18a and irisin mRNA was carried out using real-time PCR following the protocol of the manufacturer. The real-time PCR was carried out on a 7500 Real-Time PCR System (Applied Biosystems, Foster City, CA) using U6 RNA as the internal control. All experiments were repeated at least 3 times.
Cell culture and transfection
Hela and HEC-1-B cells were obtained from ATCC (Manassas, VA) and were maintained in RPMI 1640 medium (GIBCO, Thermo Fisher Scientific, Waltham, MA) supplemented with 10% fetal bovine serum (FBS) (Hyclone, GE Healthcare, Little Chalfont, UK). The cells were cultured under 5% CO2 and 37°C. When cells reached > 70% confluence, they were harvested by digesting in 0.25% trypsin (GIBCO, Thermo Fisher Scientific, Waltham, MA) and subsequently centrifuged at 500×g for 15 min at 4oC. Subsequently, the cells were seeded into 96-well plates at a density of 1 × 10⁴ cells/well and incubated overnight for the following experiments. For met treatment, the cells were treated with 10 mM and 20 mM met for 24 h before the expression of UCA1, miR-18a and irisin in the cells was measured by real-time PCR. For transfection experiments, the cells were transfected with corresponding plasmids using Lipofectamine 2000 (Invitrogen, Thermo Fisher Scientific, Waltham, MA). All experiments were repeated at least 3 times.
Luciferase assay
To investigate the regulatory relationship between the irisin 3’UTR and miR-18a, the DNA fragment of the irisin 3’UTR containing the predicted binding site of miR-18a was cloned and inserted into a pcDNA3 luciferase plasmid (termed wild type irisin 3’UTR). In addition, site-directed mutagenesis was performed using a QuikChange II Site-Directed Mutagenesis Kit (Stratagene, San Diego, CA) to mutate the two seed sequences of miR-18a on the irisin 3’UTR, which were then inserted into the pcDNA3 luciferase plasmid to create corresponding plasmids (termed mutant1 and mutant2 irisin 3’UTR, respectively). Subsequently, Hela and HEC-1-B cells were co-transfected with miR-18a mimics or miR-18a inhibitors, in conjunction with constructs carrying the wild-type, mutant1 or mutant2 irisin 3’UTR. At 48 h after transfection, the luciferase activity of transfected Hela and HEC-1-B cells was measured by a Luciferase Assay System (Promega, Madison, WI), in conjunction with an Infinite M200 microplate reader and iCycler 3.0 software (Tecan, Männedorf, Switzerland). The quantification of luminescent signals was carried out following the protocol of the manufacturer.
Similarly, to investigate the regulatory relationship between UCA1and miR-18a, UCA1 was inserted into the pcDNA3 plasmid (termed wild type UCA1). In addition, site-directed mutagenesis was performed to create a plasmid carrying mutant UCA1. Subsequently, Hela and HEC-1-B cells were co-transfected with miR-18a mimics or miR-18a inhibitors, in conjunction with constructs carrying the wild-type or mutant UCA1, and the luciferase activity of transfected cells was measured using the same approach as described above.
Western blot analysis
The protein content of cells and serum samples was collected using a total protein collection buffer (10 µl/cm2, Millipore, Billerica, MA) following the protocol of the manufacturer. Subsequently, the protein samples were separated by 10% SDS-PAGE and electro-transferred onto a polyvinylidene fluoride (PVDF) membrane, which was subsequently incubated with anti-irisin primary antibodies and secondary antibodies conjugated to horseradish peroxidase (Abcam, Cambridge, UK), respectively, following the protocol of the manufacturer. Finally, the protein bands were developed by a chemiluminescent horseradish peroxidase substrate and visualized using a Fotodyne/Analyst FX CCD camera system. The quantification of protein bands was done by ImageJ software. All experiments were repeated at least 3 times.
Serum irisin
The level of serum irisin in the subjects was measured by the enzyme immunoassay (Phoenix Pharmaceuticals, Burlingame, CA). The quantification of serum irisin was done by measuring the absorbance of samples at the 450 nm wavelength on an mQuant microplate reader (BIOTEK Instruments, Winooski, VT). The detection limit of this assay was 1.1 ng/ml irisin. In addition, < 15% and < 10% inter-assay and intra-assay variations were achieved in our study.
Immunohistochemistry (IHC) assay
Endometrium samples were collected from all subjects. Subsequently, the samples were fixed in formaldehyde and cut into sections of 5 µm in thickness. After baking the sections overnight at 70°C, the sections were deparaffinized in xylene and gradient ethanol. The staining against irisin was carried out using a DAKO EnVision+ System-HRP kit (Agilent Technologies, Santa Clara, CA) in conjunction with primary anti-irisin antibodies (1 : 500 dilution, Abcam, Cambridge, UK). In addition, blank negative samples as well as positive controls were used following the protocol of the manufacturer. Following incubation with secondary antibodies, the sections were visualized and quantified under a Nikon confocal microscope. All experiments were repeated at least 3 times.
Statistical analysis
All data analyses were performed using SPSS version 11.0 software (IBM, North Castle, NY). Measurement results were presented as mean ± standard deviation (S.D.). To select the most useful parameter for the prediction of PCOS, receiver operator characteristics (ROC) curves were produced to assess the predictive power of our multivariable analysis. Subsequently, the area under the curve (AUC) values were calculated based on these ROC curves, accompanied with their corresponding 95% confidence intervals. The effect of met treatment on the expression of UCA1, miR-18a and irisin was evaluated by the Mann-Whitney U test. The comparison of variables between two groups was done using Student’s t test, while the comparison of variables among multiple groups was done using analysis of variance (ANOVA). The overall effect of met was calculated by the Kaplan-Meier approach. The statistical significance of differences was tested with log-rank tests. All differences with a p-value of < 0.05 were deemed statistically significant.
Results
Characteristics of patients
The information about subjects, such as age, systolic and diastolic blood pressure (SBP, DBP), weight, height, body mass index (BMI), waist, hip, waist hip ratio (WHR), irisin, FABP4, LH and E2, was collected and summarized in Table I. The results revealed no significant difference in all above factors among the three groups.
Table I
Demographic data of the subjects in this study
UCA1 was associated with PCOS
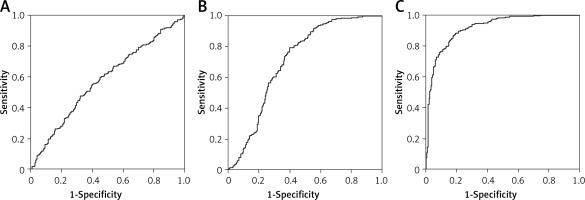
AUC of irisin, miR-18a and UCA1 were compared among the three groups to select the one that was most significantly affected by PCOS. As shown in Figure 1, the AUC of UCA1 was much greater than that of miR-18a, which in turn was higher than the AUC of irisin, suggesting that UCA1 may be used for predicting the onset of PCOS.
Levels of irisin, blood glucose, UCA1 and miR-18a were compared among PCOS, PCOS + Met and control groups
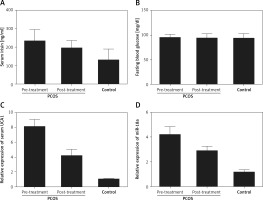
The levels of irisin, blood glucose, UCA1 and miR-18a were compared among PCOS, PCOS + Met and control groups. As shown in Figure 2, serum levels of irisin (Figure 2 A) and UCA1 (Figure 2 C) in the control group were much lower than those in the PCOS + Met group, which in turn were lower than those of the PCOS group. On the other hand, the level of fasting blood glucose (Figure 2 B) was comparable among PCOS, PCOS + Met, and control groups. In addition, subjects in the PCOS group exhibited a higher level of miR-18a than that in the PCOS + Met group (Figure 2 D), which in turn was higher than that in the control group. Furthermore, IHC assays were performed to measure the level of irisin in endometrium, and the results showed that the irisin level in the control group was much lower than that in the PCOS + Met group, which in turn was lower than that in the PCOS group (Figure 3).
Figure 2
The levels of irisin, blood glucose, UCA1 and miR-18a were compared among PCOS, PCOS + Met, and control groups. A – Serum level of irisin in the PCOS group was higher than that in the PCOS + Met group, which in turn was higher than that in the control group. B – The level of fasting blood glucose was comparable among PCOS, PCOS + Met, and control groups. C – Serum level of UCA1 in the PCOS group was much higher than that in the PCOS + Met group, which in turn was higher than that in the control group. D – Subjects with PCOS showed a significantly reduced level of miR-18a compared with the control group, while the met treatment increased the level of miR-18a to a certain extent
MiR-18a directly bound to UCA1
As shown in Figure 4 A, the results of bioinformatics analysis predicted a putative binding site of miR-18a in UCA1. To explore the relationship between miR-18a and UCA1, Hela and HEC-1-B cells were co-transfected with miR-18a mimics and constructs carrying wild-type or mutant UCA1. As shown in Figures 5 B and C, only the Hela (Figure 4 B) and HEC-1-B (Figure 4 C) cells co-transfected with miR-18a mimics and the wild-type UCA1 exhibited reduced luciferase activity, indicating that miR-18a directly bound to UCA1.
Figure 4
MiR-18a directly bound to UCA1. A – Schematic comparison of the “seed sequence” in UCA1 and miR-18a. B – Only Hela cells co-transfected with miR-18a mimics and the constructs carrying wild-type UCA1 showed reduced luciferase activity compared with the control cells. C – Only HEC-1-B cells co-transfected with miR-18a mimics and the constructs carrying wild-type UCA1 showed reduced luciferase activity compared with the control cells
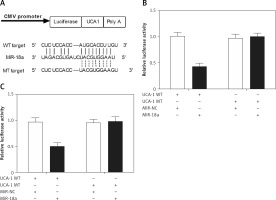
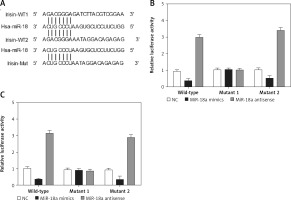
Figure 5
Irisin was a candidate target gene of miR-18a. A – Irisin was identified as a potential target of miR-18a with two possible binding sites located at the 3’UTR of irisin and its mutants. B – The luciferase activity of Hela cells co-transfected with miR-18a mimics and the wild-type or mutant2 irisin 3’UTR was significantly reduced, while the luciferase activity of the cells co-transfected with miR-18a inhibitors and the wild-type or mutant2 irisin 3’UTR was significantly increased. C – MiR-18a mimics inhibited the luciferase activity of the wild-type or mutant2 irisin 3’UTR, while miR-18a inhibitors increased the luciferase activity of the wild-type or mutant2 irisin 3’UTR
Irisin was a candidate target gene of miR-18a
According to the results of a computational analysis carried out using an online target predicting tool (www.targetscan.org), irisin 3’UTR was identified as a target gene of miR-18a, with two “seed sequences” located in the irisin 3’UTR (Figure 5 A). Since the complementary binding site of miR-18a was located in the irisin 3’UTR and the “seed sequence” in the irisin 3’UTR was highly conserved among different species (Figure 5 A), this “seed sequence” seems to play a very important role in human development. Therefore, the DNA fragment of the irisin 3’UTR containing the predicted binding site of miR-18a was cloned, and site-directed mutagenesis was performed to mutate the two seed sequences of miR-18a on the irisin 3’UTR. Subsequently, Hela and HEC-1-B cells were co-transfected with miR-18a mimics or miR-18a inhibitors, in conjunction with constructs carrying the wild-type, mutant1 or mutant2 irisin 3’UTR. As shown in Figures 5 B and 5 C, the luciferase activity of Hela (Figure 5 B) and HEC-1-B (Figure 5 C) cells co-transfected with miR-18a mimics and the wild-type or mutant2 irisin 3’UTR was significantly reduced, while the luciferase activity of cells co-transfected with miR-18a inhibitors and the wild-type or mutant2 irisin 3’UTR was significantly increased. In contrast, the transfection of miR-18a mimics and miR-18a inhibitors showed no effect on the luciferase activity of cells harboring the mutant1 irisin 3’UTR, indicating that irisin was a direct target of miR-18a and its binding site for miR-18a was located within the 1000–2000 bp region of the irisin 3’UTR.
Effect of met on expression of UCA1, miR-18a and irisin
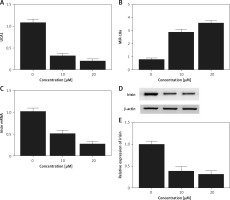
Real-time PCR and Western blot analysis were performed to detect the effect of met on the expression of UCA1, miR-18a and irisin in Hela and HEC-1-B cells. As shown in Figures 6 and 7, the levels of UCA1 (Figures 6 A and 7 A), irisin mRNA (Figures 6 C and 7 C) and irisin protein (Figures 6 D, E and 7 D, E) in Hela (Figure 6) and HEC-1-B (Figure 7) cells declined with the increasing concentration of met in a dose-dependent manner. In addition, the level of miR-18a mRNA (Figures 6 B and 7 B) in Hela (Figure 6) and HEC-1-B (Figure 7) cells also showed a dose-dependent increase with the increasing concentration of met.
Figure 6
Effect of met on expression of UCA1, miR-18a and irisin was detected in Hela cells using real-time PCR and Western blot analysis. A – The level of UCA1 gradually increased with increasing met concentrations. B – Expression of miR-18a was increased by met dose-dependently. C – In cells treated with met, the mRNA level of irisin was reduced in a dose-dependent manner. D – In cells treated with met, the protein level of irisin was reduced in a dose-dependent manner. E – In cells treated with met, the protein level of irisin was reduced in a dose-dependent manner
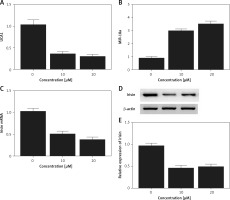
Figure 7
Effect of met on expression of UCA1, miR-18a and irisin was detected in HEC-1-B cells using real-time PCR and Western blot analysis. A – The level of UCA1 gradually increased with increasing met concentrations. B – Expression of miR-18a was increased by met dose-dependently. C – In cells treated with met, the mRNA level of irisin was reduced in a dose-dependent manner. D – In cells treated with met, the protein level of irisin was reduced in a dose-dependent manner. E – In cells treated with met, the protein level of irisin was reduced in a dose-dependent manner
Discussion
As a widely used agent to alleviate insulin resistance in PCOS patients, met exerts its effect through a complex mechanism [18]. Therefore, in this study, we performed real-time PCR and Western blot analysis to detect the effect of met on the expression of UCA1, miR-18a and irisin, and found that, at an increasing concentration of met, the levels of UCA1 and irisin showed a stepwise decline, while the expression of miR-18a showed a stepwise increase.
It was shown recently that met controls the biological processes in bladder carcinoma cells by suppressing the expression of UCA1 [16]. As an lncRNA initially discovered in bladder carcinoma, urothelial carcinoma-associated 1 (UCA1) contains three exons encoding two transcripts, i.e., a 2.2 kb and a 1.4 kb isoform [19]. Interestingly, in UCA1, the 2.2 kb isoform contains the entire length of the 1.4 kb isoform, which may participate in the tumorigenesis of many different cancers [20]. For example, it was shown that UCA1 contains a binding site of miR-18a, whose expression is significantly inhibited by the over-expression of UCA1 [17]. In this study, we searched an online miRNA database and performed a luciferase assay to reveal that UCA1 directly targeted miR-18a, since the luciferase activity of Hela and HEC-1-B cells co-transfected with wild-type UCA1 and miR-18a mimics was down-regulated compared with the luciferase activity in cells transfected by the scramble control.
Furthermore, using a luciferase reporter system, we also confirmed that irisin was a direct target or miR-18a.
As a recently identified myokine with a molecular weight of 22 kDa and 111 amino acids, irisin is synthesized by cleaving a membrane protein, i.e., FNDC5. Interestingly, the expression of FNDC5 in the muscle was found to be induced by peroxisome proliferator-activated receptor γ coactivator 1α (PGC-1α), whose expression was increased upon 3 weeks of exercise in mice [5]. In particular, irisin was found to lead to improved glucose tolerance, weight loss, and increased energy expenditure [5]. Nevertheless, since the role of irisin in insulin resistance has not been fully elucidated, it remains unclear as to how myokine is regulated. Li et al. observed that the level of irisin in PCOS or overweight patients was significantly elevated compared to that in healthy controls [21]. Using a glucose clamp technique, the authors also investigated the relationship between irisin and hyperinsulinemia, and found that the concentration of irisin was initially reduced rapidly by hyperinsulinemia and then reached a steady state, indicating that the increased concentration of irisin in PCOS patients could be due to metabolic stress. In addition, the authors also noted a significant decrease in the level of irisin and reduced insulin resistance after met treatment. Such results are in line with those from our present study. In this study, we enrolled 100 PCOS subjects, 52 of whom were treated with met. Using an ROC curve analysis, our results showed that the AUC of UCA1 was the highest, while the AUC of irisin was the lowest. In this study, we also compared the levels of irisin, blood glucose, UCA1 and miR-18a among PCOS, PCOS + Met, and control groups, and found that the serum and endometrium levels of irisin as well as the serum level of UCA1 in the PCOS group were higher than those in the PCOS + Met group, which in turn were higher than those in the control group. In contrast, the control group had the highest level of miR-18a, while the PCOS group had the lowest level of miR-18a.
A recent study conducted by Li et al. showed a significant increase in the level of irisin in obese and overweight PCOS patients, accompanied by a significant increase in hyperandrogenemia and insulin resistance [22]. Such results suggested that the increased level of irisin could be used to predict hyperandrogenemia, metabolic syndrome and insulin resistance. In addition, using mass spectrometry, other relevant studies also showed the significance of plasma irisin and the association between a decreased level of irisin and the presence of metabolic syndrome, insulin resistance, and type-2 diabetes mellitus [23, 24]. Nevertheless, the findings regarding the role of insulin are not always consistent. For example, there have been controversial findings about the correlation between the level of circulating irisin and the risk of obesity [25, 26]. In addition, irisin was also found to promote the proliferation of HUVEC by regulating ERK signaling [6].
This present study explored the molecular mechanism underlying the therapeutic effect of met, and the results of this study further improve our understanding about the role of met in the management of PCOS. Meanwhile, some non-coding RNAs such as UCA1 and miR-18a are involved in the regulation of FNDC5, the effector of the therapeutic effect of met, and control of those RNAs may strengthen the clinical efficacy of met in the treatment of PCOS. However, there are limitations of this study. Firstly, the sample size is relatively small, and a further study with a larger sample size is warranted; secondly, no animal study was performed, and a further study with an animal model of PCOS treated with met is needed.
In conclusion, taking the evidence together, we hypothesized that the UCA1 and microRNA-18a signaling pathway mediates the irisin-lowering effect of met in the management of PCOS. Met has been reported to decrease the expression of UCA1, an endogenous competing RNA of miR-18a. By searching an online miRNA database, we found that FNDC5, a precursor of irisin, was a possible target of miR-18a, while the level of circulating irisin was shown to be associated with the severity of PCOS. Therefore, UCA1 may act as a novel target for the treatment of PCOS.


