Introduction
There are increasingly more tendon injuries and diseases under circumstances in which personal computers and smart phones have become popularized, physical exercises and competition activities are conducted more frequently, accidents take place constantly, and the tendency of population aging gets apparent day by day. As a common soft tissue disease, tendinopathy is mainly embodied in a variety of tendon syndromes featuring chronic pain and it attacks athletes and the aged in most cases [1, 2].
Chronic tendinopathy, deemed as a degenerative disease, mainly manifests as extracellular matrix degradation peculiar to tendons, that is replacement of ordered fiber structure with unordered myxoid stroma on one hand; and, on the other hand, it is also reflected as an increased number of cells which is accompanied with elongated spindle tendon cell reduction, fiber chondrocyte increase and more new vessels [3–5]. As inflammatory responses recruit a large quantity of inflammatory cells, metalloproteinases are highly expressed, which promotes degenerative changes in tissues and makes rupture of tendons more likely. Problems such as pain, dyskinesia and secondary osteoarthritis that are caused by tendinopathy, tendon calcification and tendon function degradation give rise to a heavy economic and social burden.
Toll like receptor 4 (TLR4) is the first TLR related protein that is found in B/T lymphocytes, macrophagocytes, livers, spleens and lungs of human beings [6]. It is correlated with occurrence and progression of many diseases, including cardiovascular diseases, allergic diseases and autoimmune diseases [7]. TLR4 signal transduction facilitates production of inflammatory factors primarily by activating downstream myeloid differentiation factor 88 (MyD88). As for microRNA (miRNA), it is micromolecular RNA in eukaryons and can regulate non-coding single strands after gene transcription. Although miRNA only represents a proportion of 1–5% in the total number of human genes, it is capable of regulating about 60% of mRNAs and 30% of protein-coding genes in human bodies [8]. It has been previously reported that miRNA-140-5p plays a significant neuroprotective role in acute inflammatory reactions of the central nervous system by regulating expression of inflammatory factors such as tumor necrosis factor α (TNF-α), interleukin 6 (IL-6), IL-1β, IL-8 and high mobility group box 1 (HMGB-1) [9]. According to recent research findings, miRNA-140-5p is able to regulate secretion of proinflammatory factors by means of targeting the TLR4 pathway and exert a certain protective effect in the progression of knee osteoarthritis, osteosarcoma and lung injuries [10–12]. However, a protective role played by miRNA-140-5p in the progression of tendinopathy is still not reported yet. Here, primary culture of rat tendon stems was conducted to simulate pathophysiological reactions of tendinopathy in vitro. While actions of TLR4 on tendinopathy were observed firstly, observations were then made to make sure how miRNA-140-5p affects tendinopathy by regulating TLR4. Hopefully, experimental bases and theoretical support can be provided to search for new target sites.
Material and methods
Materials
CD44, CD90, CD34 and CD106 (American, eBioscience, 12-0444-80, 85-11-0900-81, 12-0349-41 and 25-1069-42); TNF-α ELISA kit (Enzyme-linked Biotechnology, ml002859, China), Hyp ELISA detection kit (Enzyme-linked Biotechnology, ml002859, China); IL-6 ELISA detection kit (Enzyme-linked Biotechnology, ml102828, China); IL-1β ELISA detection kit (Enzyme-linked Biotechnology, ml037361, China); DMEM (GIBCO, 12800-082, America); FBS (Gibco, 10082147, America); 0.25% Tripsin-EDTA (Jiangsu KeyGEN BioTECH Co., Ltd., KGY001, China); RPMI-1640 (GIBCO, 31800-105, China); Annexin V-FITC/PI apoptosis assays kit (Jiangsu KeyGEN BioTECH Co., Ltd., KGA105, China); TUNEL detection kit (Jiangsu KeyGEN BioTECH Co., Ltd., KGA7025, China); DAPI staining kit (Jiangsu KeyGEN BioTECH Co., Ltd., KGA215, China); TRIzol (Invitrogen, 15596-026, America); cDNA synthesis kit (TaKaRa, RR036B, Japan); One Step TB Green PrimeScript RT-PCR Kit II (SYBR Green) (TaKaRa, RR086B, Japan); primer sequence, miRNA-140-5p and si-TLR4 mimics were obtained through designed synthesis by Jiangsu KeyGEN BioTECH Co., Ltd.; GAPDH, TLR4, MyD88 and NF-κB (p65) were purchased from Abcam.
Primary cell extraction and culture
After decapitation of SD rats that were all newly born, they were soaked in 75% alcohol for 5 min for disinfection. Their lower limbs were dissected in an aseptic condition to take out their tendons; then, the tendons were put in sterile PBS containing penicillin, streptomycin and amphotericin B; in the sterile PBS, the tendons were rinsed three time to remove attached adipose tissues, necrotic tissues and erythrocytes; moreover, their tissues was also cut into pieces. Subsequently, a proper amount of collagenase was added into a centrifugal tube where their tendons had been placed to digest them at 37°C for 1 h; in addition, the tube was shaken once every 5 min. Ham’s-F12 that contained 10% FBS was selected to stop digestion and their tissue blocks were washed again three times. After that, digestive juice was collected, then filtered by 70-μm and 40-μm cell strainers and then centrifuged at 1,500 rpm for 11 min. After the supernatants thus generated were abandoned, an appropriate amount of D/F12 culture medium containing 10% FBS was added and they were inoculated in a poly-lysine-coated tissue culture bottle that was then put in an incubator for culture. The liquid was changed every 2 days. Moreover, this incubator contained 5% CO2; and, temperature in it was set at 37°C and its internal humidity was saturated.
Primary cell identification
Cell collection. Cells were collected in a condition of centrifugation at 1,000 rpm for 5 min and then washed twice in PBS; afterwards, the supernatant was removed by means of centrifugation. After antibody was added at a ratio of 1 : 1,000 and the mixture was shaken to be uniform, they were kept out of the sun and incubated at 37°C for 30 min. Subsequently, cell phenotypes were detected by a flow cytometry subsequent to addition of 400 μl of PBS.
A cell model for tendinopathy
Third-generation tendon-derived stem cells (TDSCs) were selected. They were incubated on a 96-well plate under the circumstance that each well accommodated 2,000 cells. For each group, 6 wells were defined for repeated experiments and each of them contained 100 μl of basal culture medium. 50 ng/ml TGF-β1 (Sigma, USA) was added into TDSCs to construct a cell model for tendinopathy. Regarding cells in the control group, they were incubated with PBS-DMSO.
Cell culture and transfection
No transfection was conducted for the NC group. As for other groups, TLR4, si-NC, si-TLR4, miRNA-NC and/or miRNA-140-5p were all transferred to TDSCs in strict accordance with user manuals of Lipofectamine 2000 transfection reagent produced by Guangzhou RiboBio Co., Ltd. Subsequent to transfection, they were correspondingly processed for 48 h. Afterwards, relevant detections were carried out.
ELISA detection related proteins
Cell culture fluids were taken from each group and underwent centrifugation at 1,000 g/min for 4 min. The supernatant was taken to be detected by a TNF-α ELISA kit (Enzyme-linked Biotechnology, ml002859, China), an Hy ELISA kit (Enzyme-linked Biotechnology, ml002859, China), IL-6 ELISA kit (Enzyme-linked Biotechnology, ml102828, China) and IL-1β ELISA kit (Enzyme-linked Biotechnology, ml037361, China) by strictly following relevant instructions of kits.
Cell proliferation detection by MTT
TDSCs that had been processed for 48 h were taken from each group and incubated on a 96-well plate. The volume of each well was 200 μl, and cell concentration was controlled at 1.5 × 10⁴/ml. After the cells were cultured for 48 h continuously, 20 μl of MTT was added to each well to incubate at 37°C for 4 h. After that, 150 μl of dimethyl sulfoxide was again added to each well, leaving them to react with each other for 10 min without exposure to any sunlight. Finally, an ELISA detector was used to measure absorbency (OD) values 490 nm deep in all wells. Thus, cell proliferation conditions were acquired through calculations.
Apoptosis detection by Annexin-V FITC/PI double staining
TDSCs that had been processed for 48 h were taken from each group, digested by 0.25% pancreatin (free of EDTA) and washed twice with PBS (centrifuging at 1,000 rpm for 5 min) to collect 5 × 10⁵ cells. Then, the cells were suspended by adding 500 μl of binding buffer. After 5 μl of Annexin V-FITC was added and mixed uniformly, 5 μl of propidium iodide was also added and blended; afterwards, they were left to react with each other for 5–15 min at room temperature in a dark place. Eventually, flow cytometry was utilized to detect apoptosis situations.
Apoptosis detection by fluorescence and TUNEL
Both the TUNEL detection kit (KGA7025, China) and the DAPI staining kit (KGA215, China) were purchased from Jiangsu KeyGEN BioTECH Co., Ltd. Experimental procedures are described below. TDSCs (cell smears) that had been processed for 48 h were taken from each group and immersed in 4% paraformaldehyde fixation for 30 min or overnight for the purpose of improving permeability of cells. Then, the cells were subjected to immersion cleaning thrice; each time, the immersion cleaning should last for 3 min. Moreover, 1% Triton-100 was added in specimens that were placed at room temperature for 15 min, soaked in PBS for 5 min and rinsed three times. Specimens were processed with 3% H2O2-methanol solution for 15 min, immersed in PBS for 5 min and rinsed three times as well. 100 μl of proteinase-K that had been prepared was added dropwise on each specimen, leaving them to react for 30 min at 37°C; afterwards, 100 μl of Streptavidin-TRITC labeling working solution was added dropwise to each specimen to keep the specimen wet, then they were left in a dark place to react for 1 h at 37°C. Moreover, such specimens were immersed in PBS for 5 min and rinsed three times. Subsequently, 100 μl of DAPI working solution was added dropwise to each specimen and then it was placed at room temperature for 5 min in a dark place, immersed in PBS for 5 min and rinsed three times. At last, they were observed under a fluorescence microscope.
Real time-PCR detection of related gene expression
After cells in each group were correspondingly processed for 48 h, target cells that grew well were collected to extract their RNAs and obtain cDNA by means of reverse transcription. The cDNA was used as a template to carry out qRT-PCR, so that expression levels of target genes in the cells were detected. Here, GAPDH was used as a control for TLR4, MyD88 and NF-κB, while U6 was selected as a control for miRNA-140-5p. With regard to the primer sequence, please see Table I.
Table I
Primer sequences of difference mRNA
Cell immunofluorescence
After cells in each group were correspondingly processed for 48 h, we let the specimens (cell smears) naturally dry. Then, they were immersed in 4% paraformaldehyde for fixation for 30 min or overnight for the purpose of improving permeability of cells. Then, the cells were subjected to immersion cleaning three times; each time, the immersion cleaning lasted for 3 min. Moreover, two drops of 3% H2O2-methanol solution were added on each slide that was sealed at room temperature of 15–25°C for 10 min, rinsed in PBS for 3 min. 50–100 μl of ready-to-use goat serum was added dropwise to incubate the specimens at room temperature for 20 min; then, 50 μl of MyD88 (Bioss, bs-1078R, China) (1 : 250) or NF-κ B(p65) (Abcam, ab86299, UK) (1 : 100) primary antibody was added dropwise for 2-hour incubation in a wet box. After they were immersed in PBS and rinsed 3 times, 100 μl of FITC secondary antibody was added dropwise for 1-hour incubation at 37°C in a dark place, following which the specimen were subjected to immersion cleaning three times in PBS. On each slide, the prepared DAPI staining fluid of 50–100 μl was added in a dropwise manner and then the slide was placed at room temperature for 5 min in a dark place. Afterwards, the slide was sealed with anti-quenching mounting gel and then put under a microscope to observe protein expression in cells. During observation, pictures of 3 sites of overexpression were taken and preserved.
Protein expression detection by Western blot (WB)
Processed cells were taken from each group to extract the total protein by a holoprotein extraction kit (Jiangsu KeyGEN BioTECH Co., Ltd., KGP250, China). Therefore, protein quantification was carried out according to instructions of a BCA protein quantification kit (Jiangsu KeyGEN BioTECH Co., Ltd., KGA902). The prepared protein specimens were subjected to sodium dodecyl sulfate-polyacrylamide gel electrophoresis (SDS-PAGE) (Jiangsu KeyGEN BioTECH Co., Ltd., KGP101). Subsequently, the separated proteins were transferred onto a polyvinylidene fluoride (PVDF) membrane. After sealing for 1 h with 5% skim milk powder at room temperature, they were incubated with anti-TLR4 antibodies (1 : 500) and NFκB-P65 antibodies (1 : 1000) respectively. After relevant bands had been rinsed with TBST, secondary antibodies were added to perform 1-hour incubation at room temperature. An E-gel imager was used to realize development after ECL luminescent solution had been added dropwise. Finally, protein expression levels were quantitatively analyzed by Image J.
Luciferase reporter gene
As analyzed by online prediction websites of bioinformatics, it is likely that TLR4 is a target gene of miRNA-140-5p. It clones a mutant fragment TLR4-Mul in a wild-type TLR4-MT and miRNA-140-5p deletion binding domain; moreover, the fragment can be constructed into a luciferase reporter vector. TDSCs that were obtained through stable transfection of miRNA-NC and miRNA-140-5p were respectively incubated in 12-well petri dishes. Density of the cultured cells reached 70%. The above two types of cells were transferred by TLR4-WT and TLR4-Mul carriers; the solution was replaced after 6 h; and, after 48 h, a luciferase reporter gene detection kit was adopted to measure relative activity of luciferase in each group of cells.
Statistical analysis
All data were statistically analyzed by IBM SPSS Statistics 19.0; and, categorical data were subjected to χ2 testing. Regarding measurement data, normal distribution of them was proven by means of a normality test (p > 0.05), which was expressed as mean ± SD; and, based on homogeneity test of variance, their variances were all homogeneous (p > 0.05). In terms of inter-group comparison, one-way ANOVA was selected, while pairwise comparison was conducted by the LSD t-test. Additionally, p > 0.05 signifies that the data are statistically significant.
Results
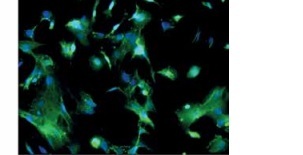
TDSC identification
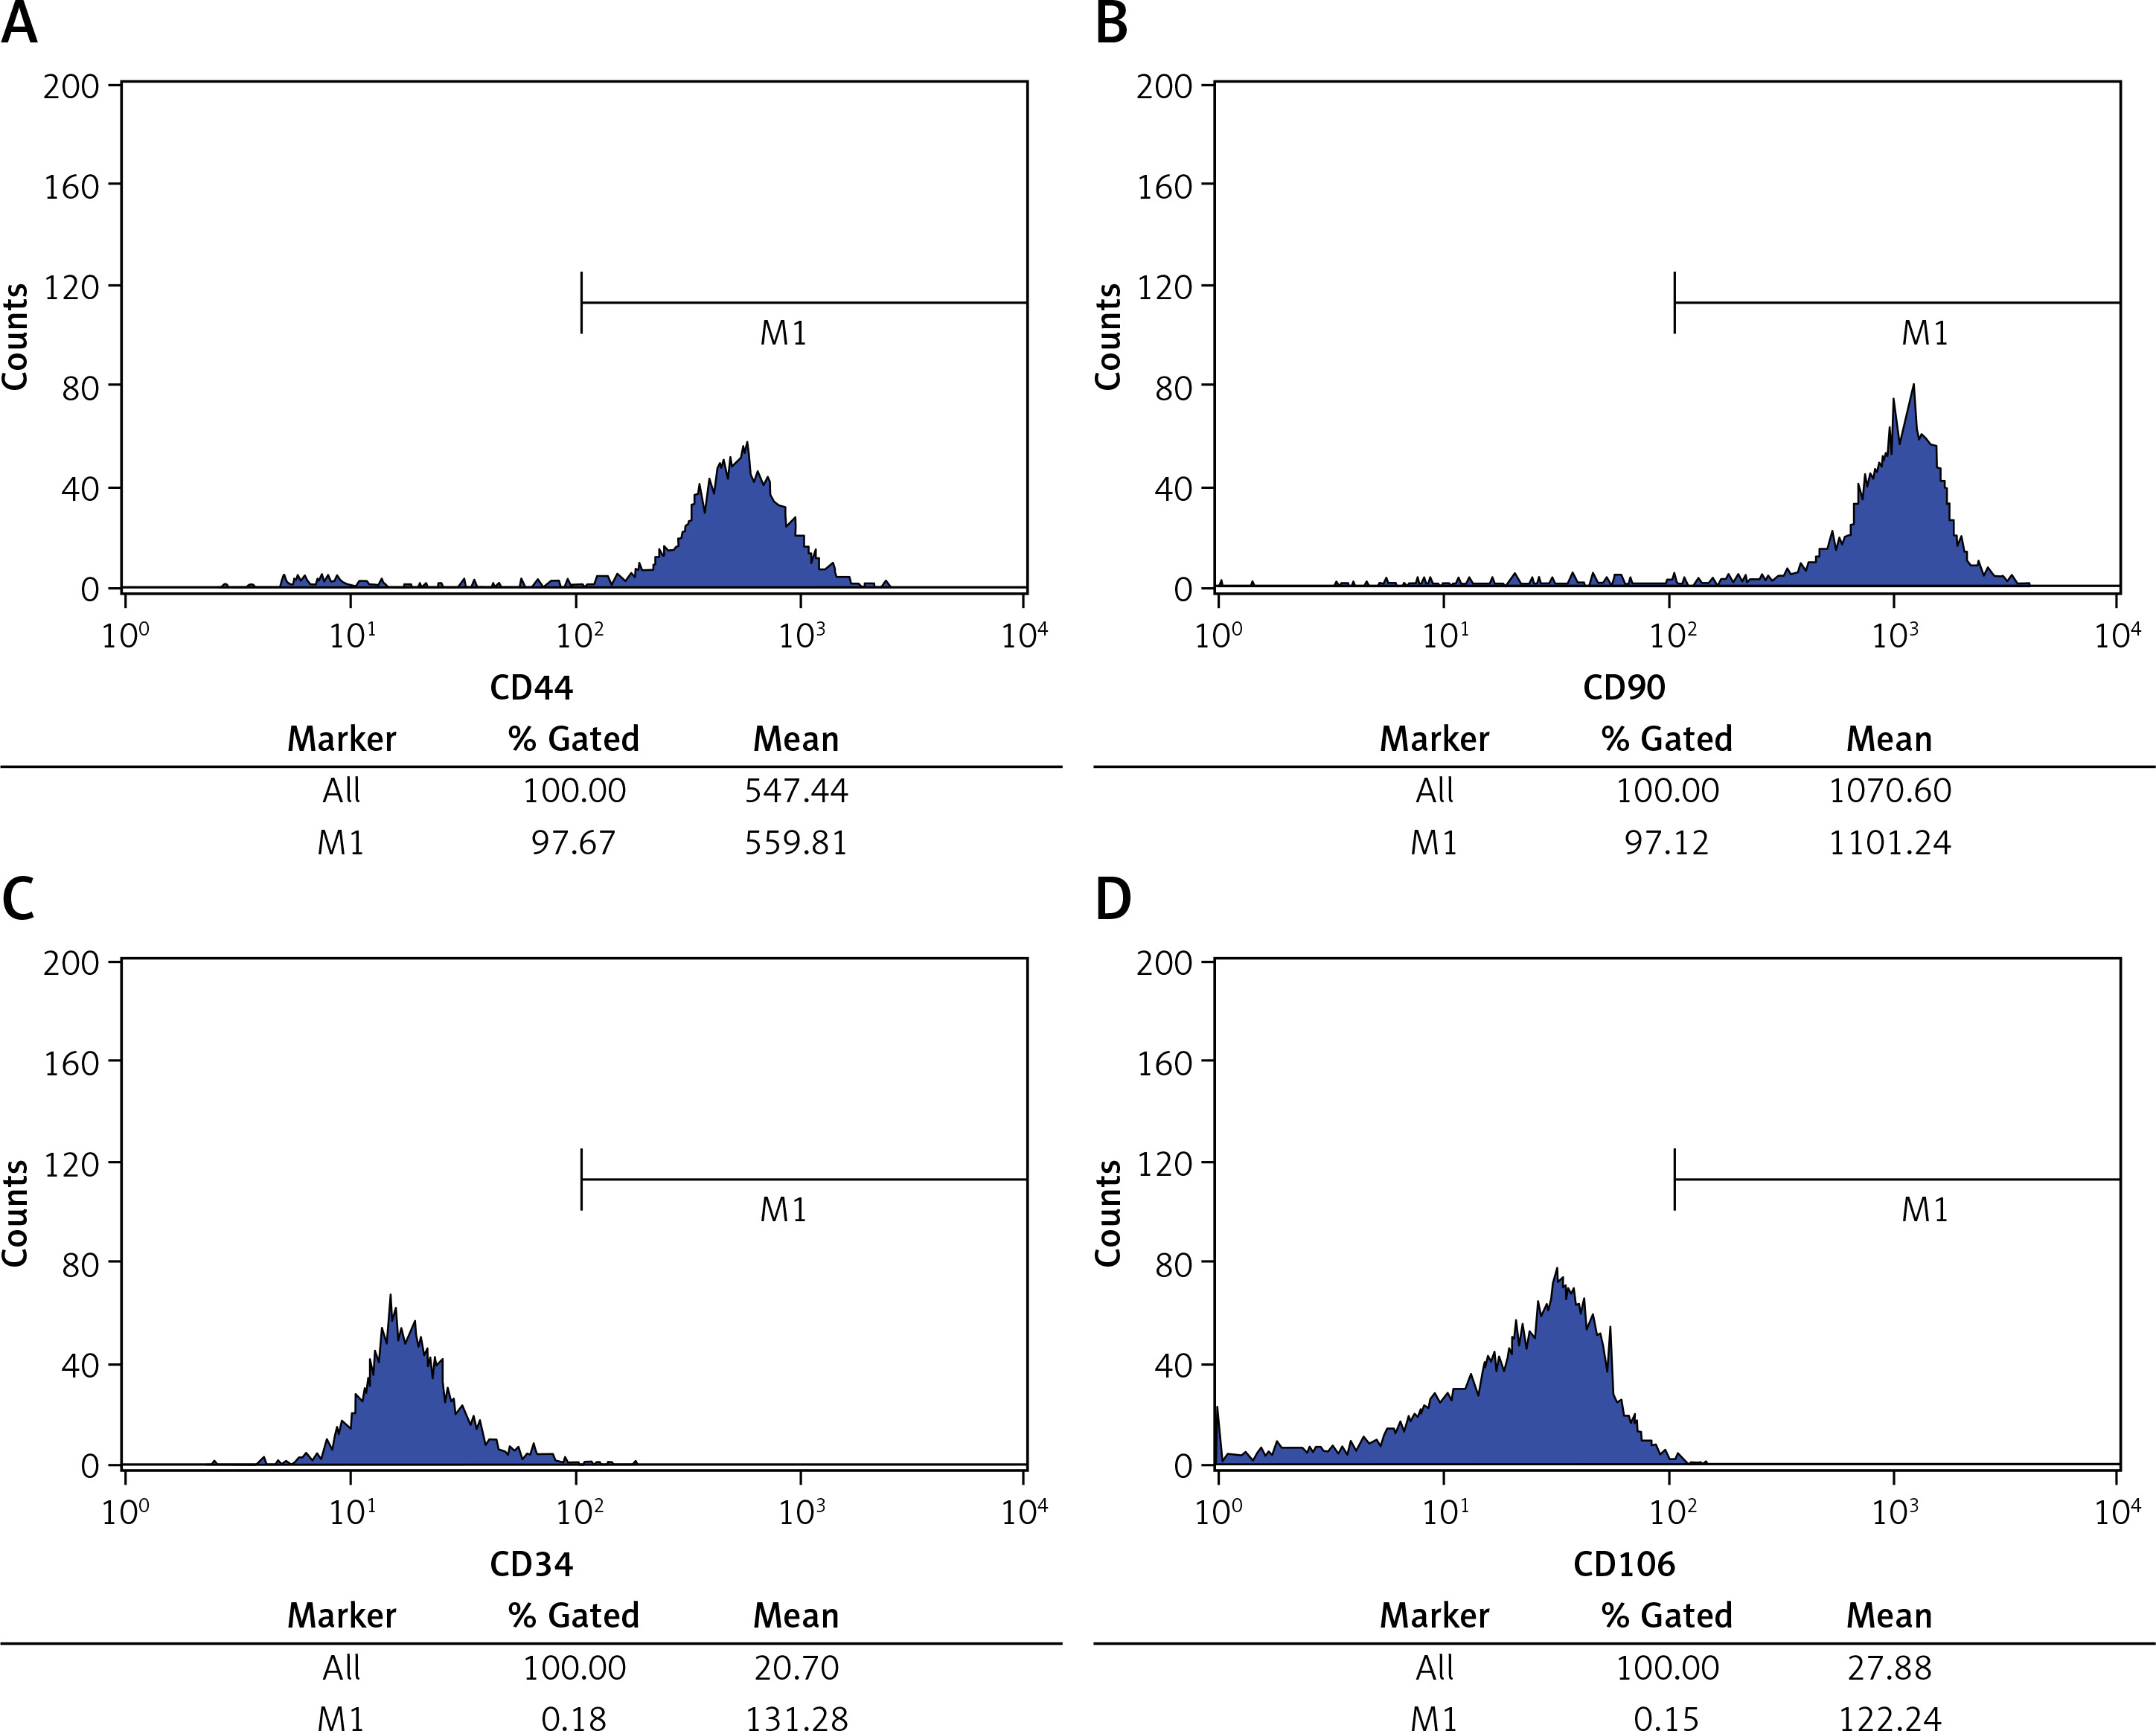
Flow cytometry was selected to determine TDSCs extracted. As indicated by relevant results, cell ratios taken by CD44 and CD90 are respectively 97.63 ±1.57% and 98.06 ±2.03%, while those of CD34 and CD106 are determined to be merely 0.14 ±0.07% and 0.16 ±0.05%. This reflects successful purification of TDSCs and they can be used for subsequent experiments. For details, please refer to Figure 1.
Influence of TLR4 knock-down on proliferation of inflammatory factors, Hyp and TDSCs
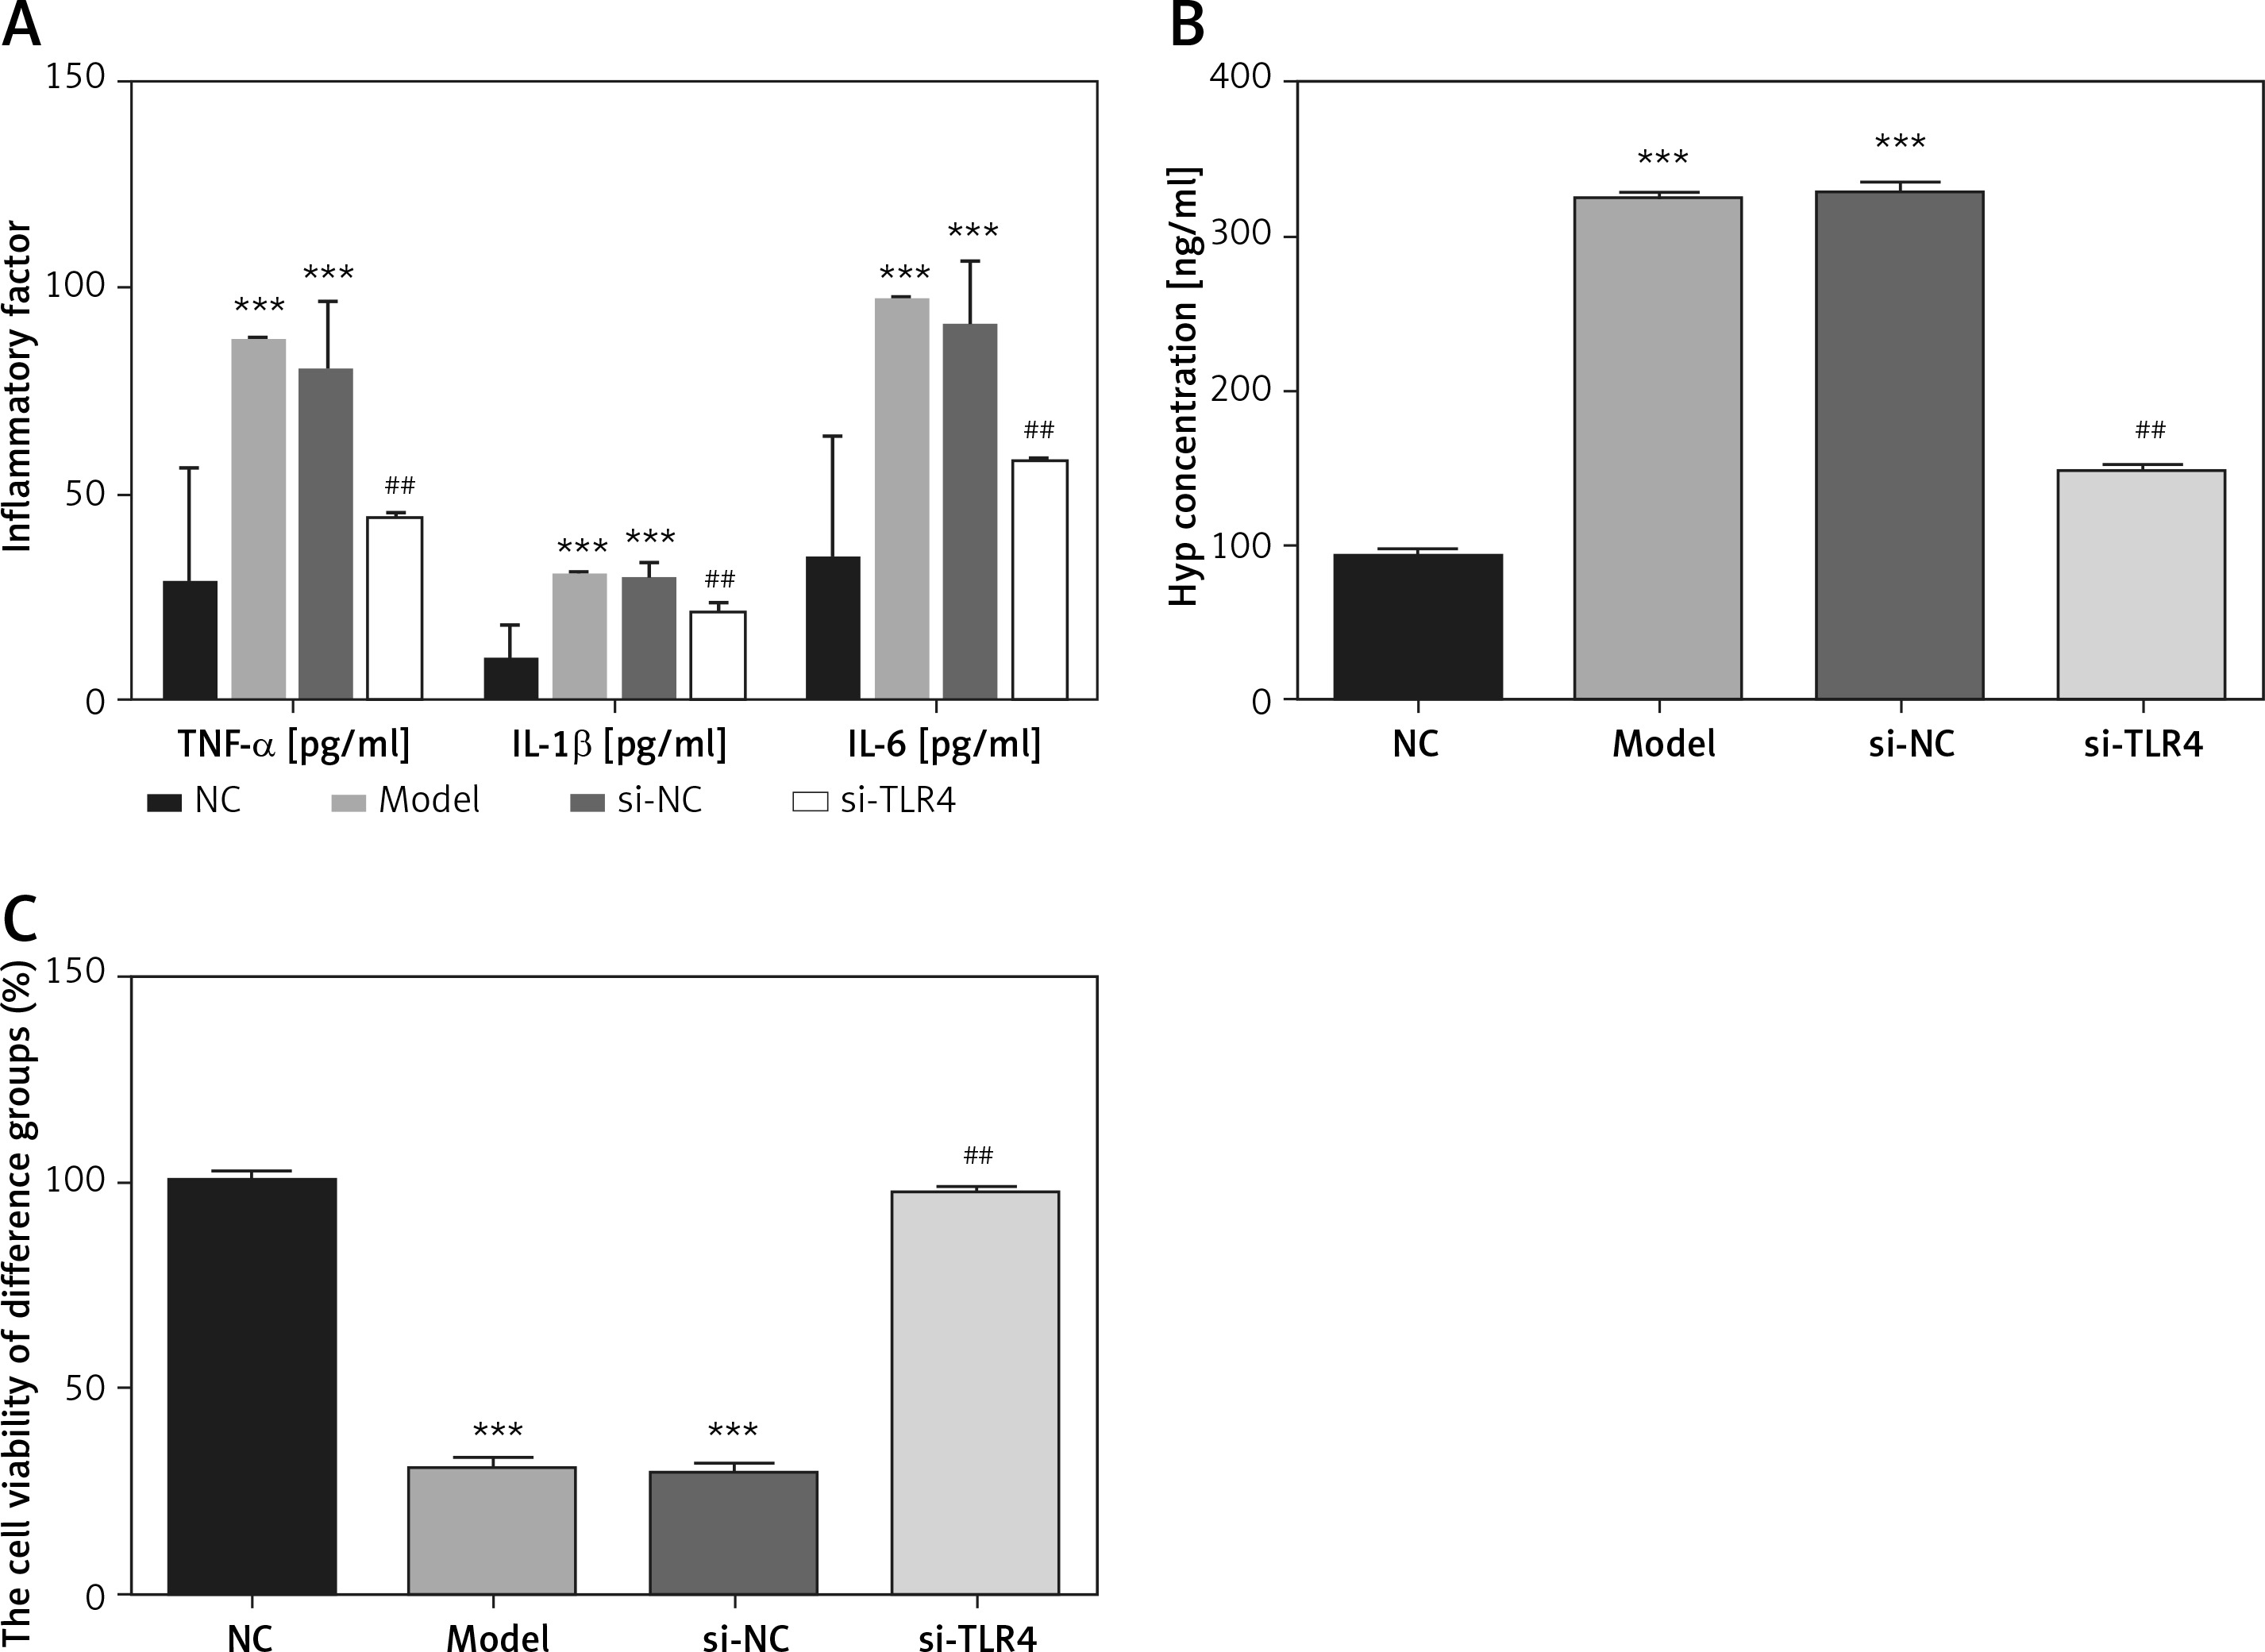
Compared with the NC group, concentrations of TNF-α, IL-1β, IL-6 and Hyp in Model and si-NC groups are all significantly elevated, while cell viability drops to a great extent (p < 0.001, respectively, Figure 2). Based on such a result, it can be said that it is feasible to construct a cell model for tendinopathy by adopting 50 ng/ml TGF-β1 to induce TDSCs. After si-TLR4 is transferred into TDSCs, TNF-α, IL-1β, IL-6 and Hyp concentration levels in the si-TLR4 group are significantly inhibited compared with those in the Model group; however, cell viability is accordingly remarkably improved (p < 0.001, respectively, Figure 2).
Figure 2
Influence of TLR4 knock-down on inflammatory factors, Hyp and TDSCs proliferation. NC – The TDSCs were treated with normal treatment; Model – the TDSCs treated with 50 ng/ml TGF-β1; si-NC – the cells were transfected with si-NC (negative control) based on the model; si-TLR4 – the cells were transfected with si-TLR4 (knockdown TLR4) based on the model. A – TLR4 knock-down affects inflammatory factors. ***P < 0.001, compared with NC group; ##p < 0.01, compared with Model group. B – TLR4 knock-down affects Hyp concentration by ELISA assay. ***P < 0.001, compared with NC group; ##p < 0.01, compared with Model group. C – TLR4 knock-down affects cell viability by MTT assay. ***P < 0.001, compared with NC group; ##p < 0.01, compared with Model group
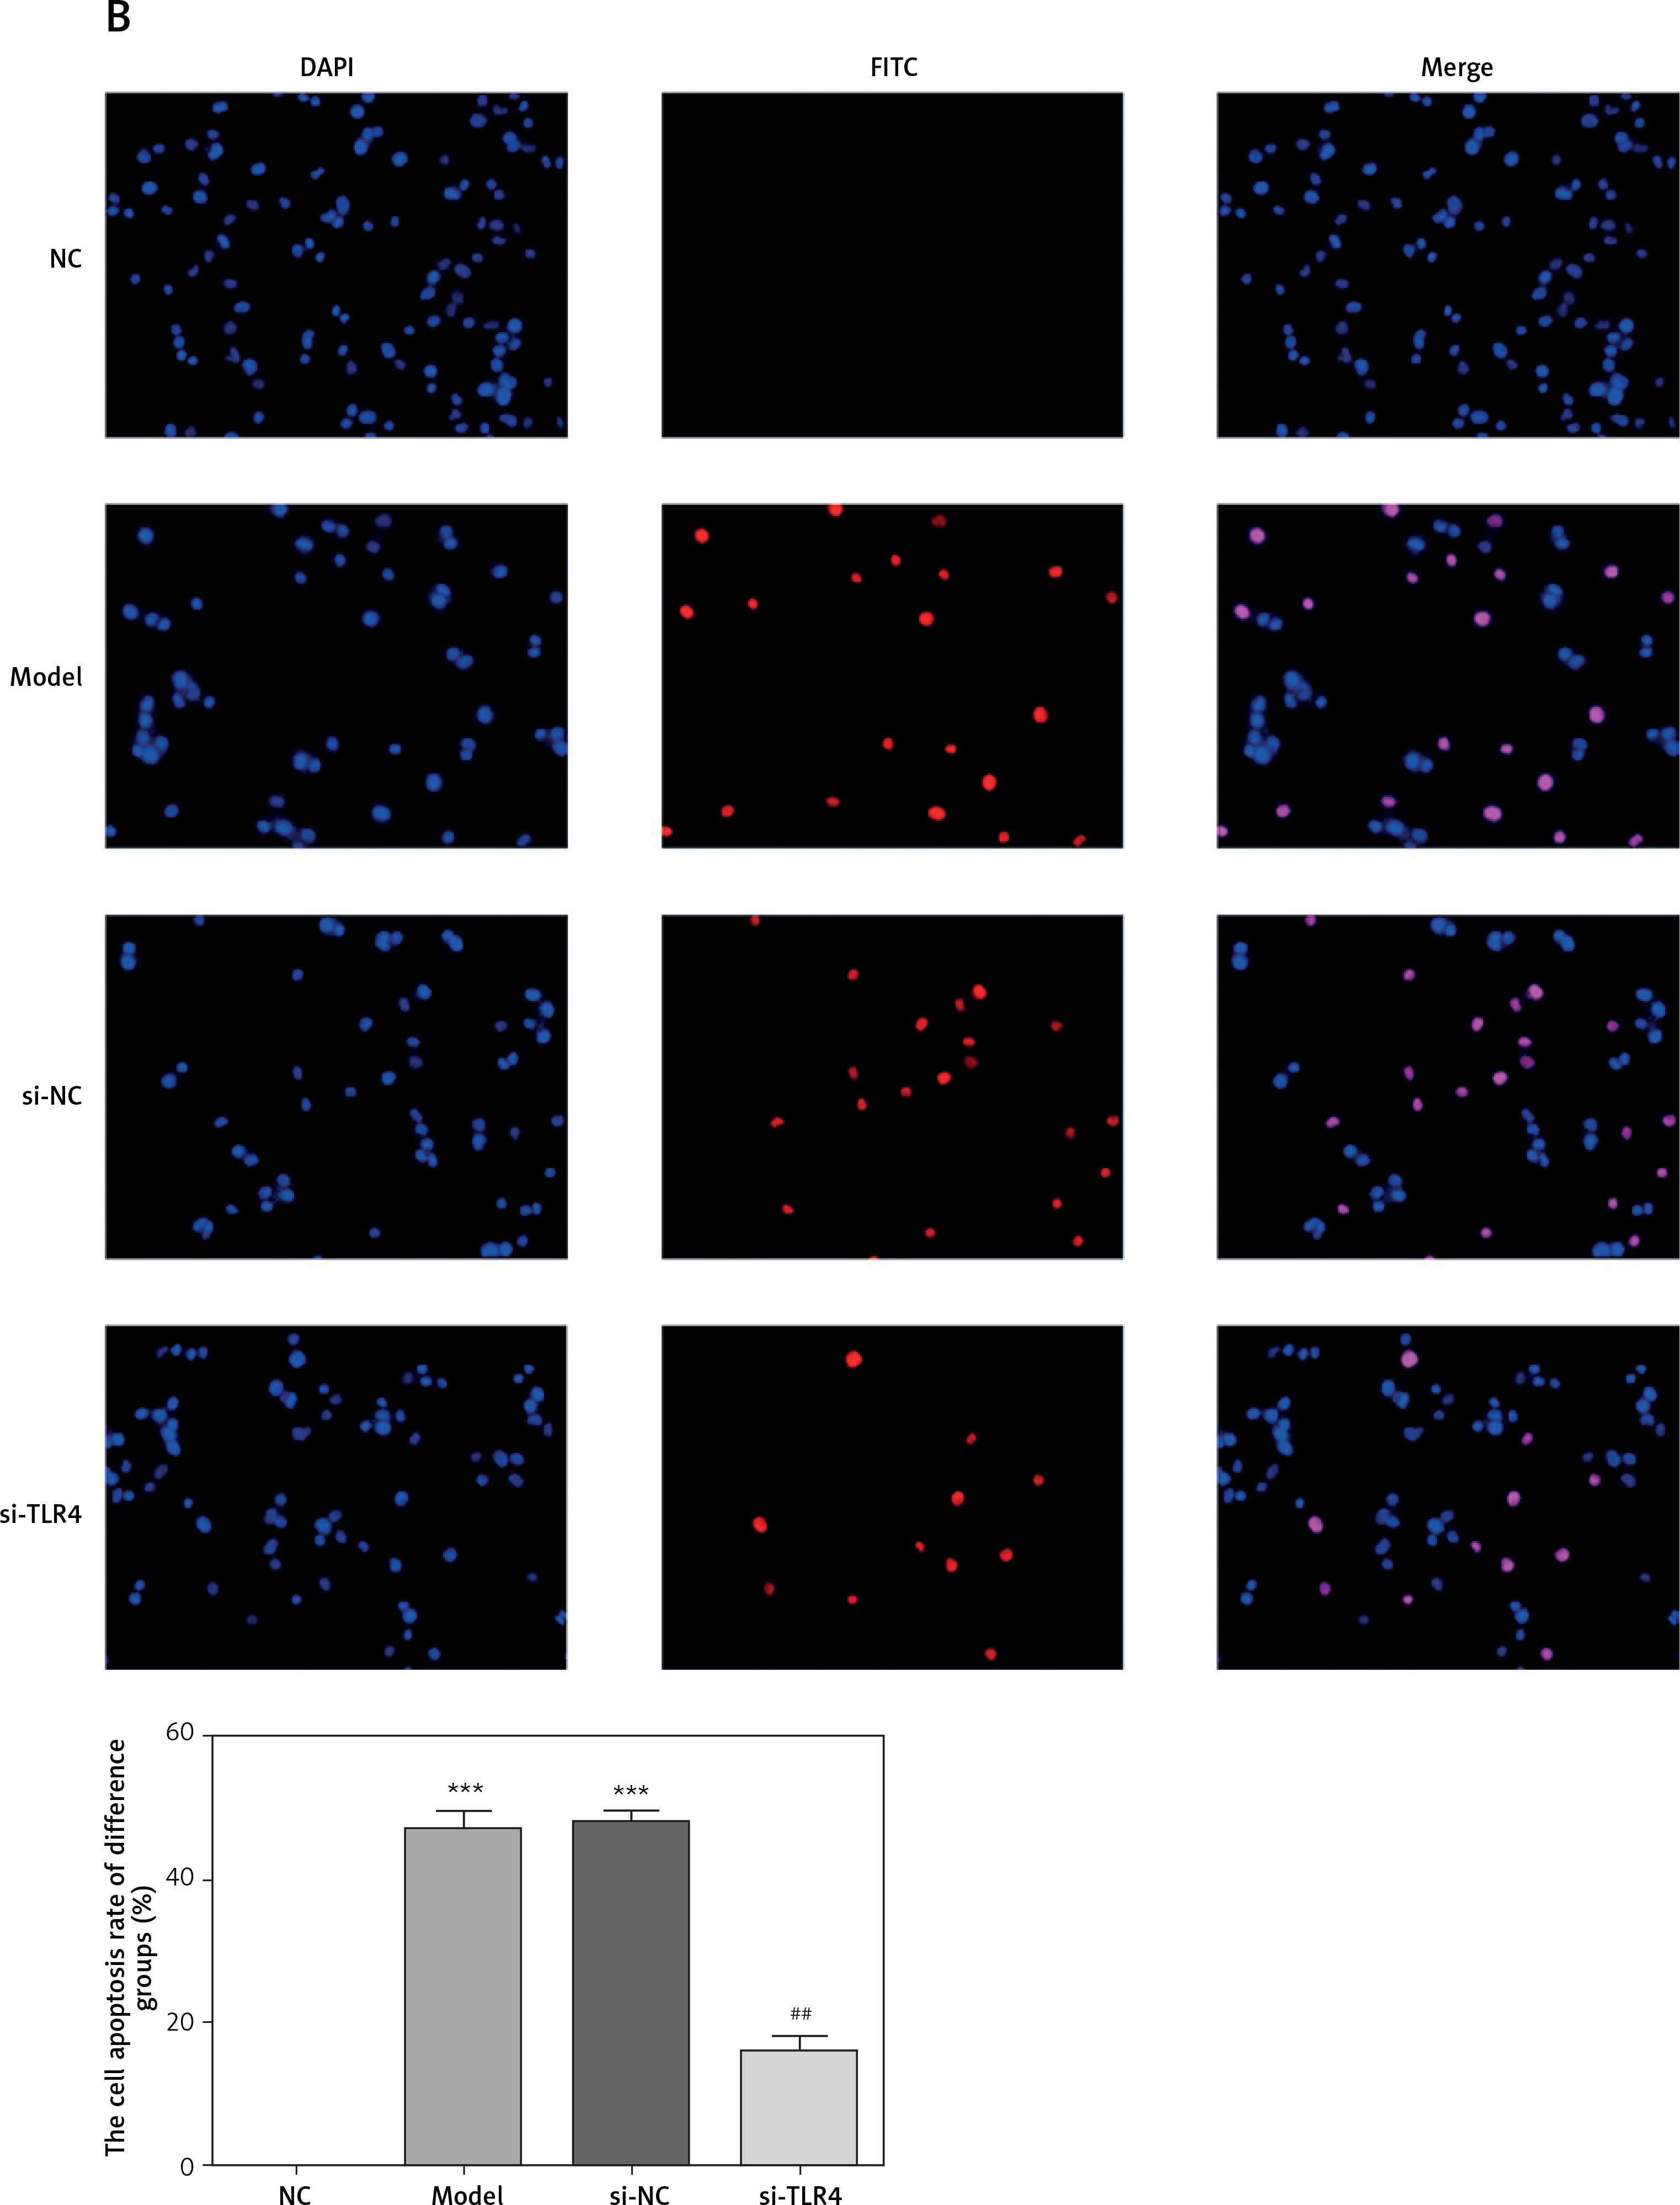
Influence of TLR4 knock-down on TDSC apoptosis
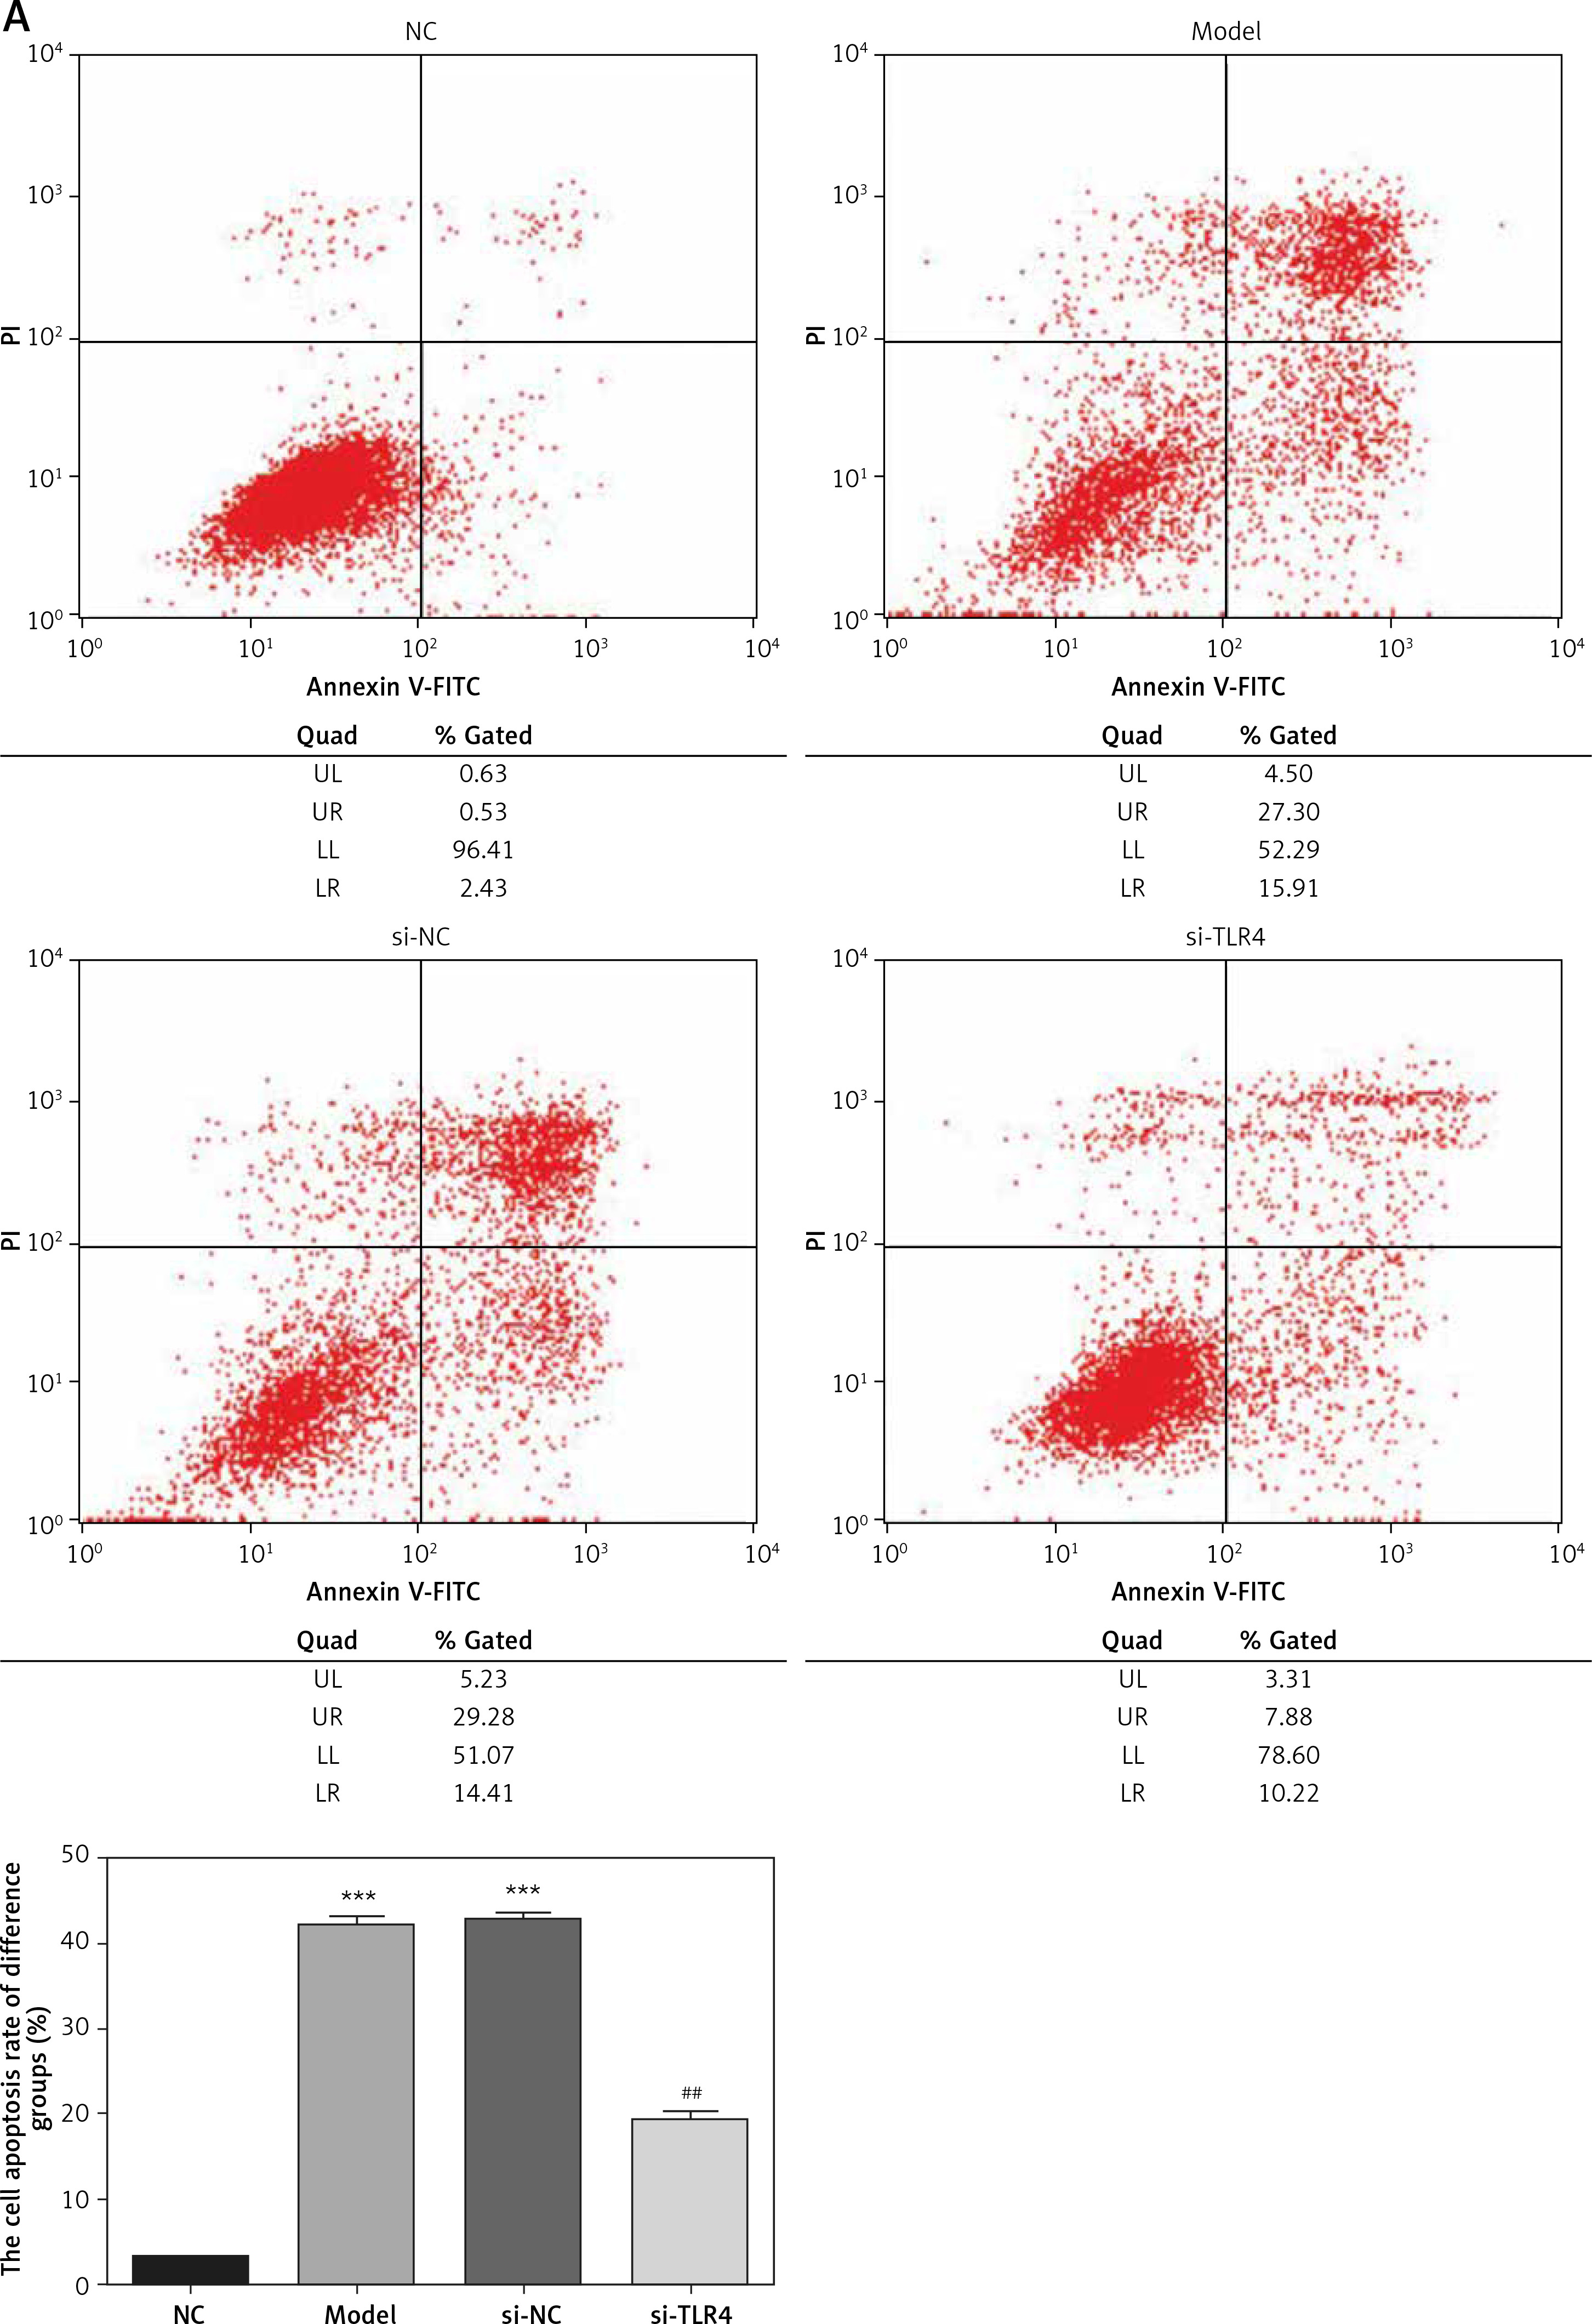
Cells in all groups were tested by means of flow cytometry and TUNEL staining. Corresponding results show that apoptosis rates generated by Model and si-NC groups significantly rise (p < 0.001, respectively, Figure 3) when compared with that in the NC group. Nevertheless, in comparison with the apoptosis rate of the Model group after si-TLR4 is transferred into TDSCs, that of the siTLR4 group suffers significant inhibition (p < 0.001, respectively, Figure 3). It indicates that TDSC apoptosis caused by TGF-β1 can be effectively inhibited subsequent to TLR4 knock-down.
Figure 3
Influence of TLR4 knock-down on TDSC apoptosis. NC – the TDSCs were treated with normal treatment; Model – the TDSCs were treated with 50 ng/ml TGF-β1; si-NC – the cells were transfected with si-NC (negative control) based on the model; si-TLR4 – the cells were transfected with si-TLR4 (knockdown TLR4) based on the model. A – TLR4 knockdown affect cell apoptosis by flow cytometry. ***P < 0.001, compared with NC group; ##p < 0.01, compared with Model group. B – TLR4 knockdown affect cell apoptosis by TUNEL assay. ***P < 0.001, compared with NC group; ##p < 0.01, compared with Model group
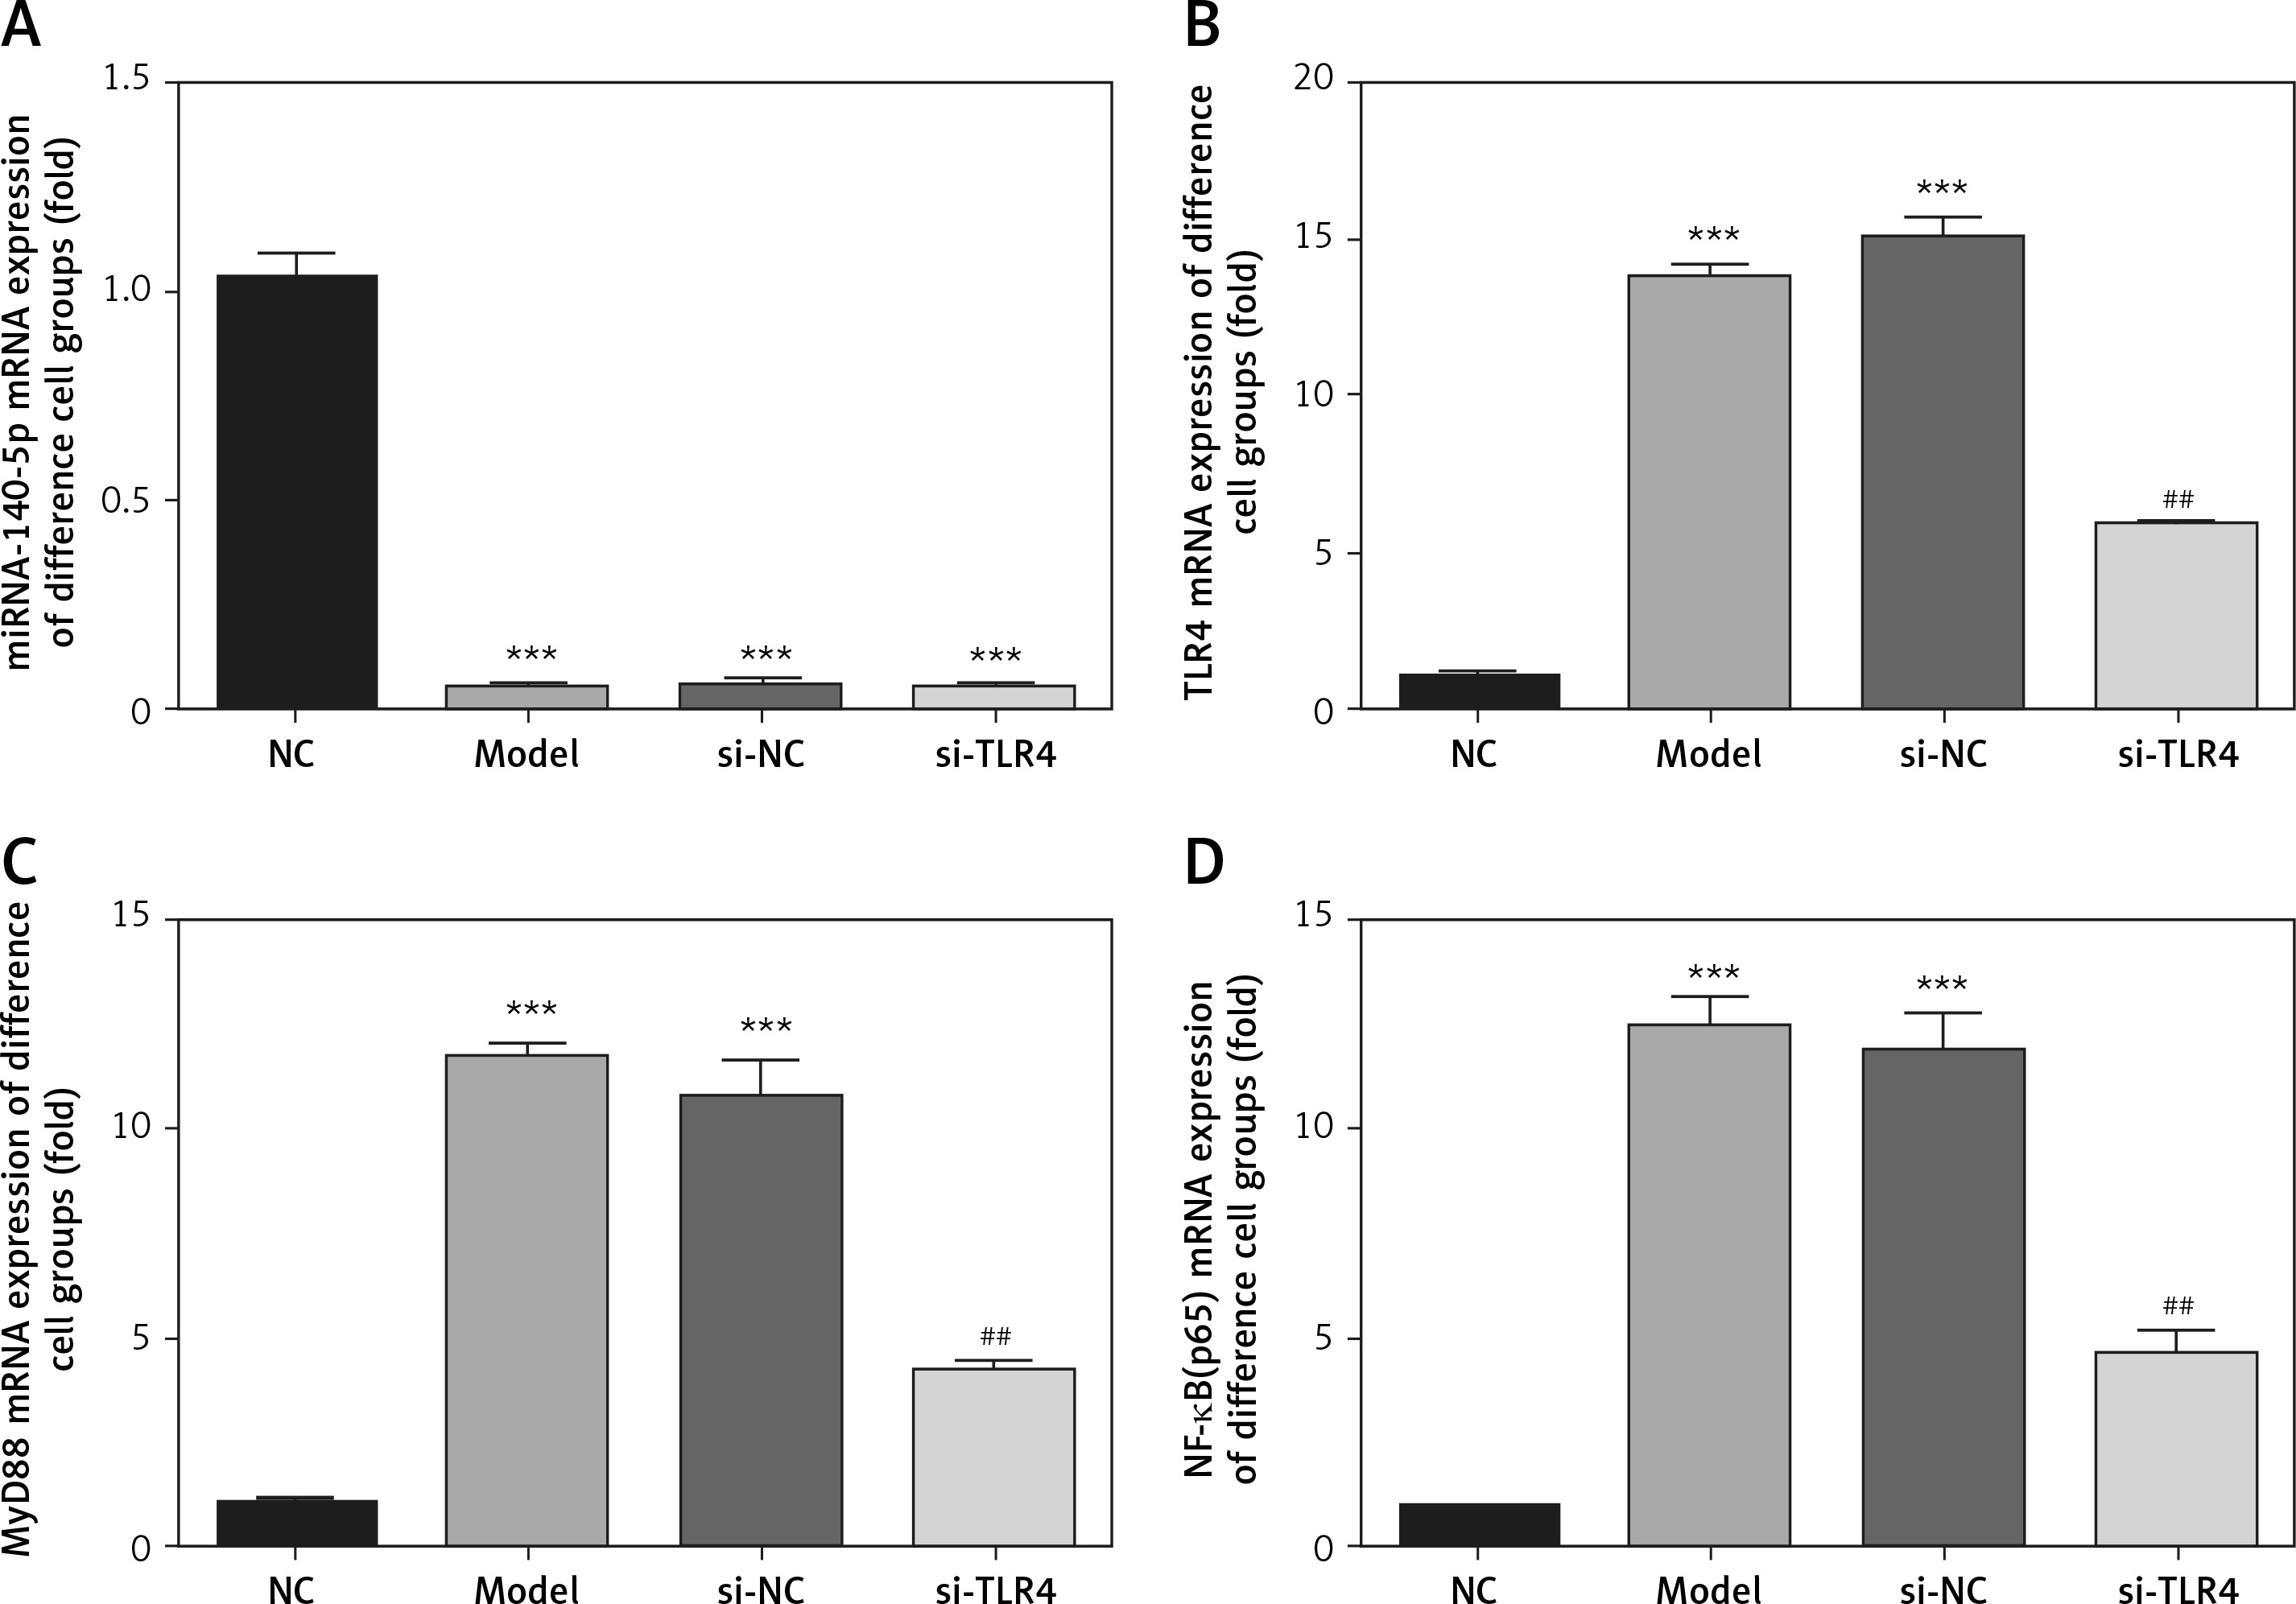
Influence of TLR4 knock-down on related genes
By contrast to the NC group, miRNA-140-5p gene expression levels of Model, si-NC and si-TLR4 groups all drop significantly (p < 0.001, respectively, Figure 4). Such a result proves that interference with TLR4 exerts no actions on gene expression of miRNA-140-5p in Model, si-NC and si-TLR4 groups. Concerning groups Model and si-NC, expression levels of MyD88 and NF-κB (p65) mRNA both go up notably (p < 0.001, respectively, Figure 4). Under the circumstance that si-TLR4 is transferred into TDSCs, TLR4, MyD88 and NF-κB(p65) mRNA expression levels in si-TLR4 group are all significantly inhibited (p < 0.01, respectively, Figure 4), which is not the case in the Model group.
Figure 4
Influence of TLR4 knock-down on related genes by RT-qPCR assay. NC – the TDSCs were treated with normal treatment; Model – the TDSCs were treated with 50 ng/ml TGF-β1; si-NC – the cells were transfected with si-NC (negative control) based on the model; si-TLR4 – the cells were transfected with si-TLR4 (knockdown TLR4) based on the model
***P < 0.001, compared with NC group; ##p < 0.01, compared with Model group.
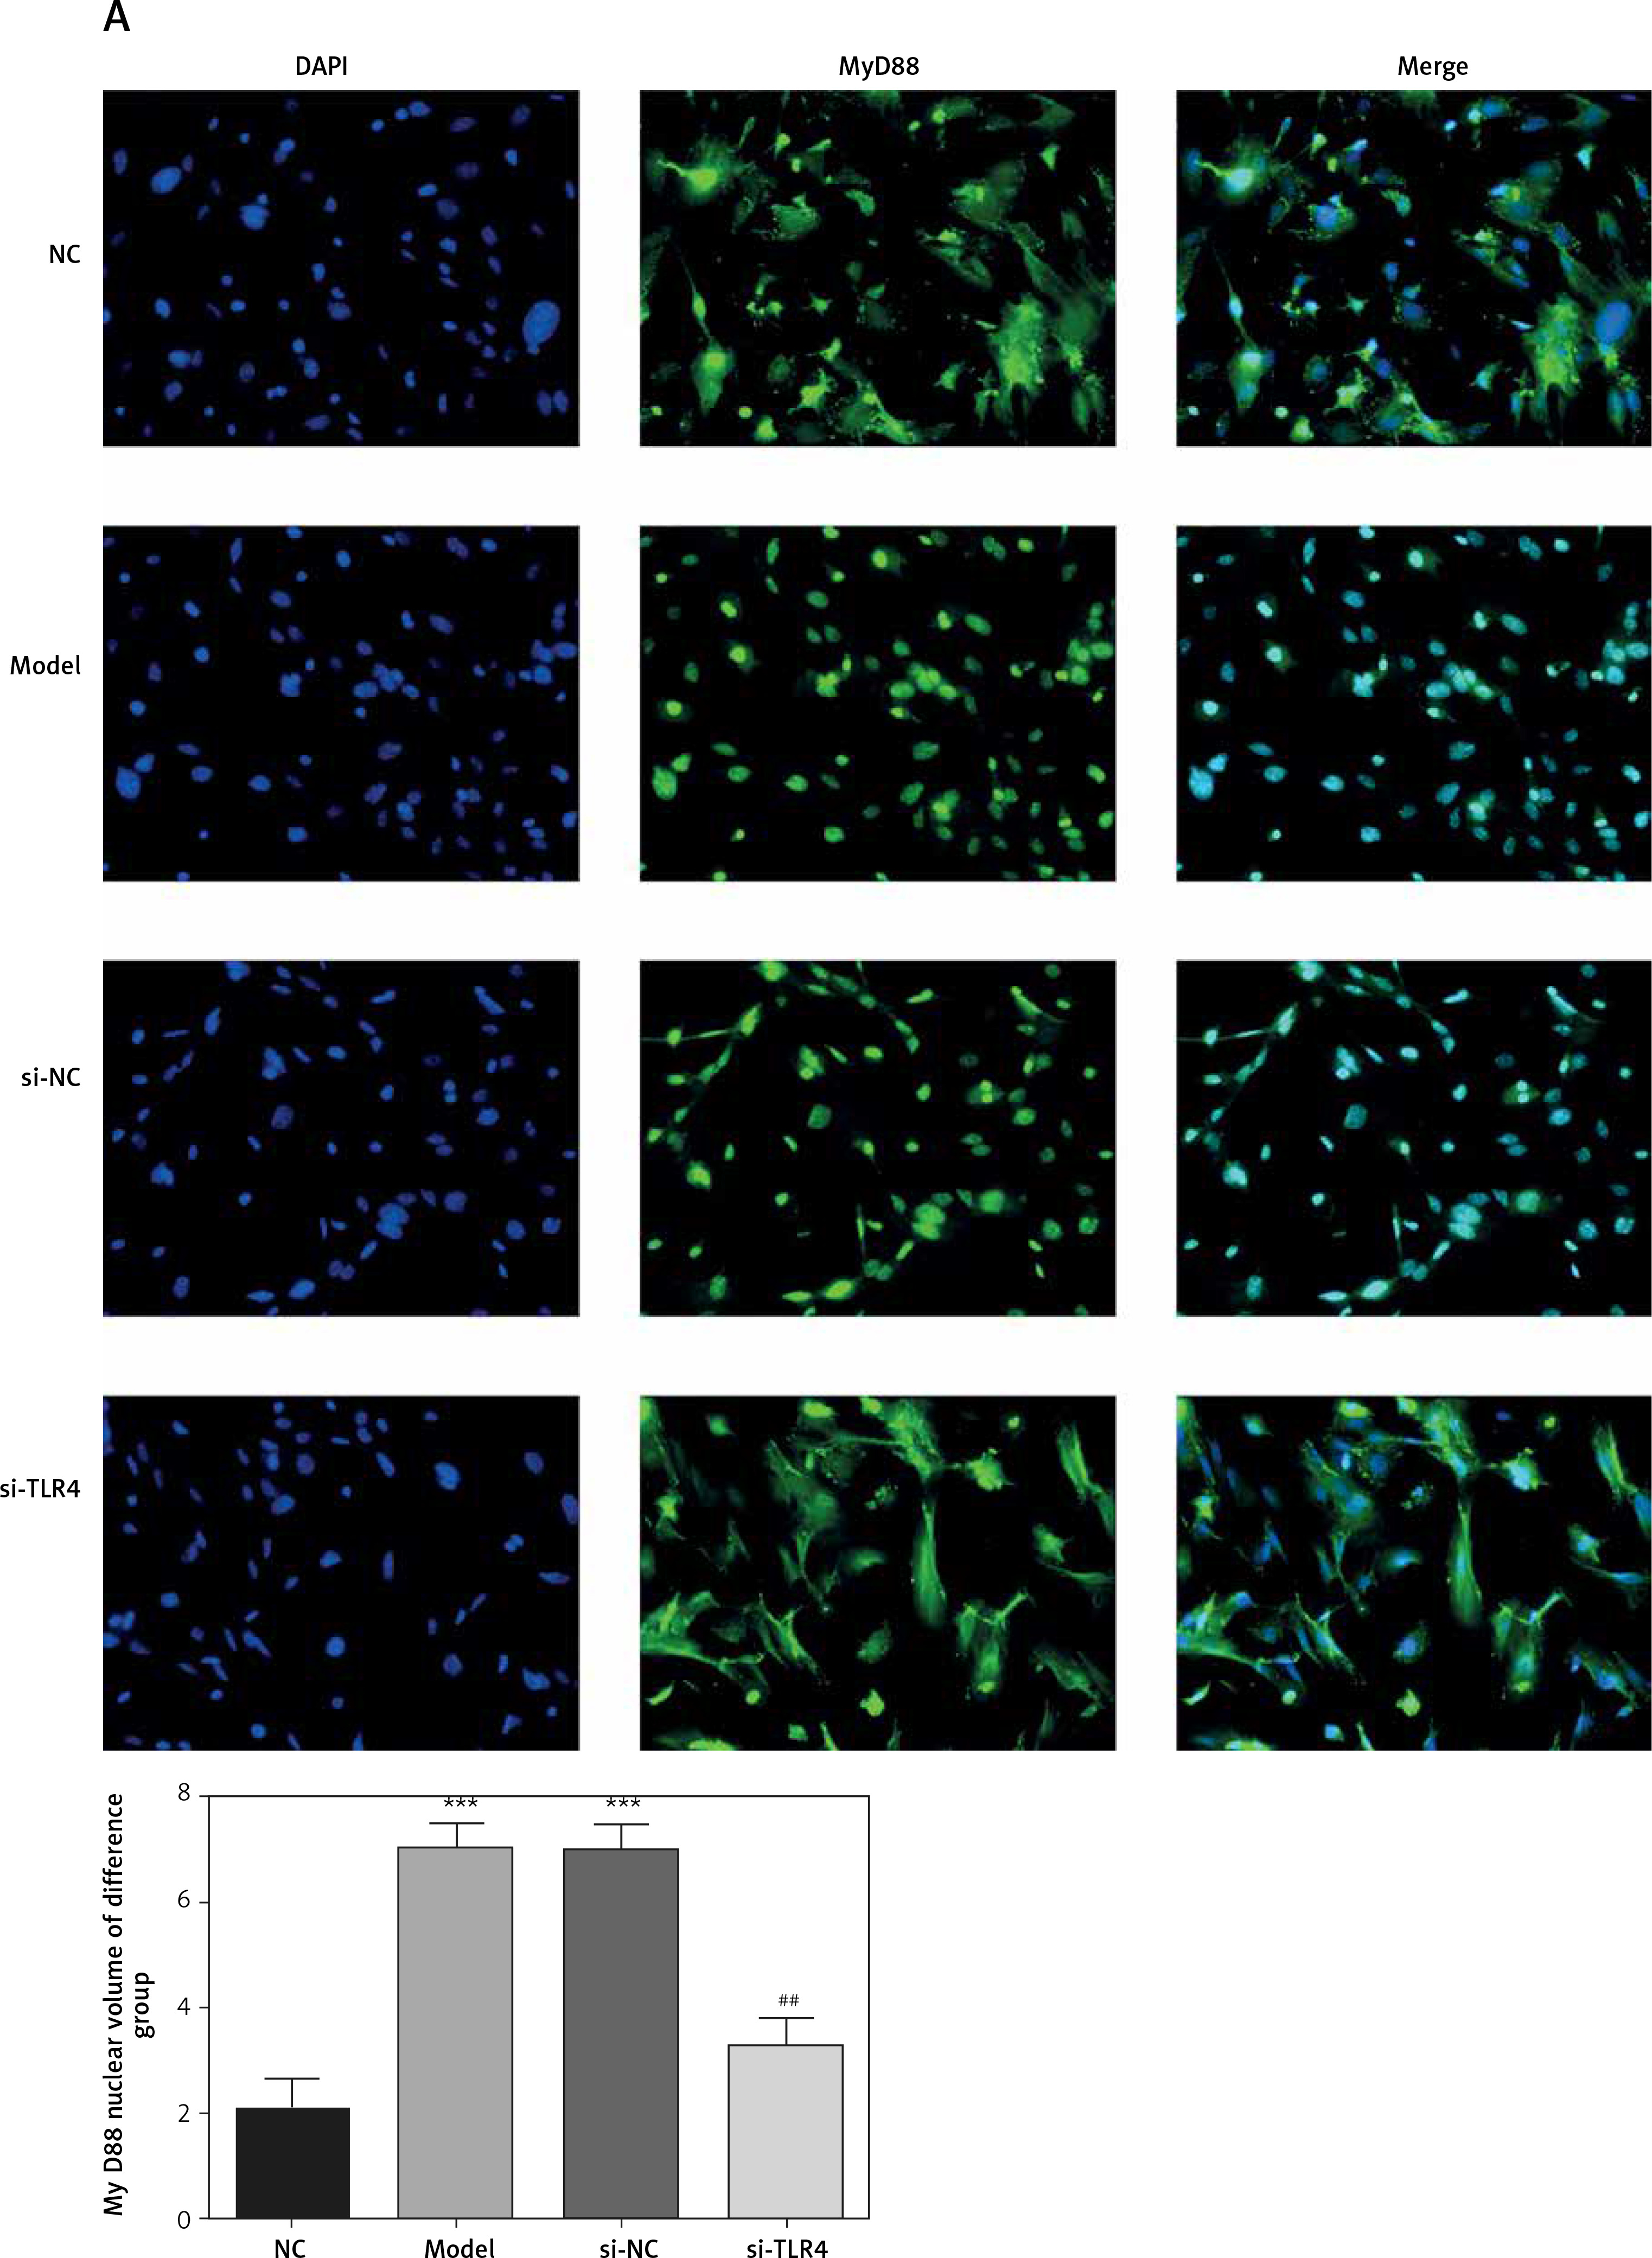
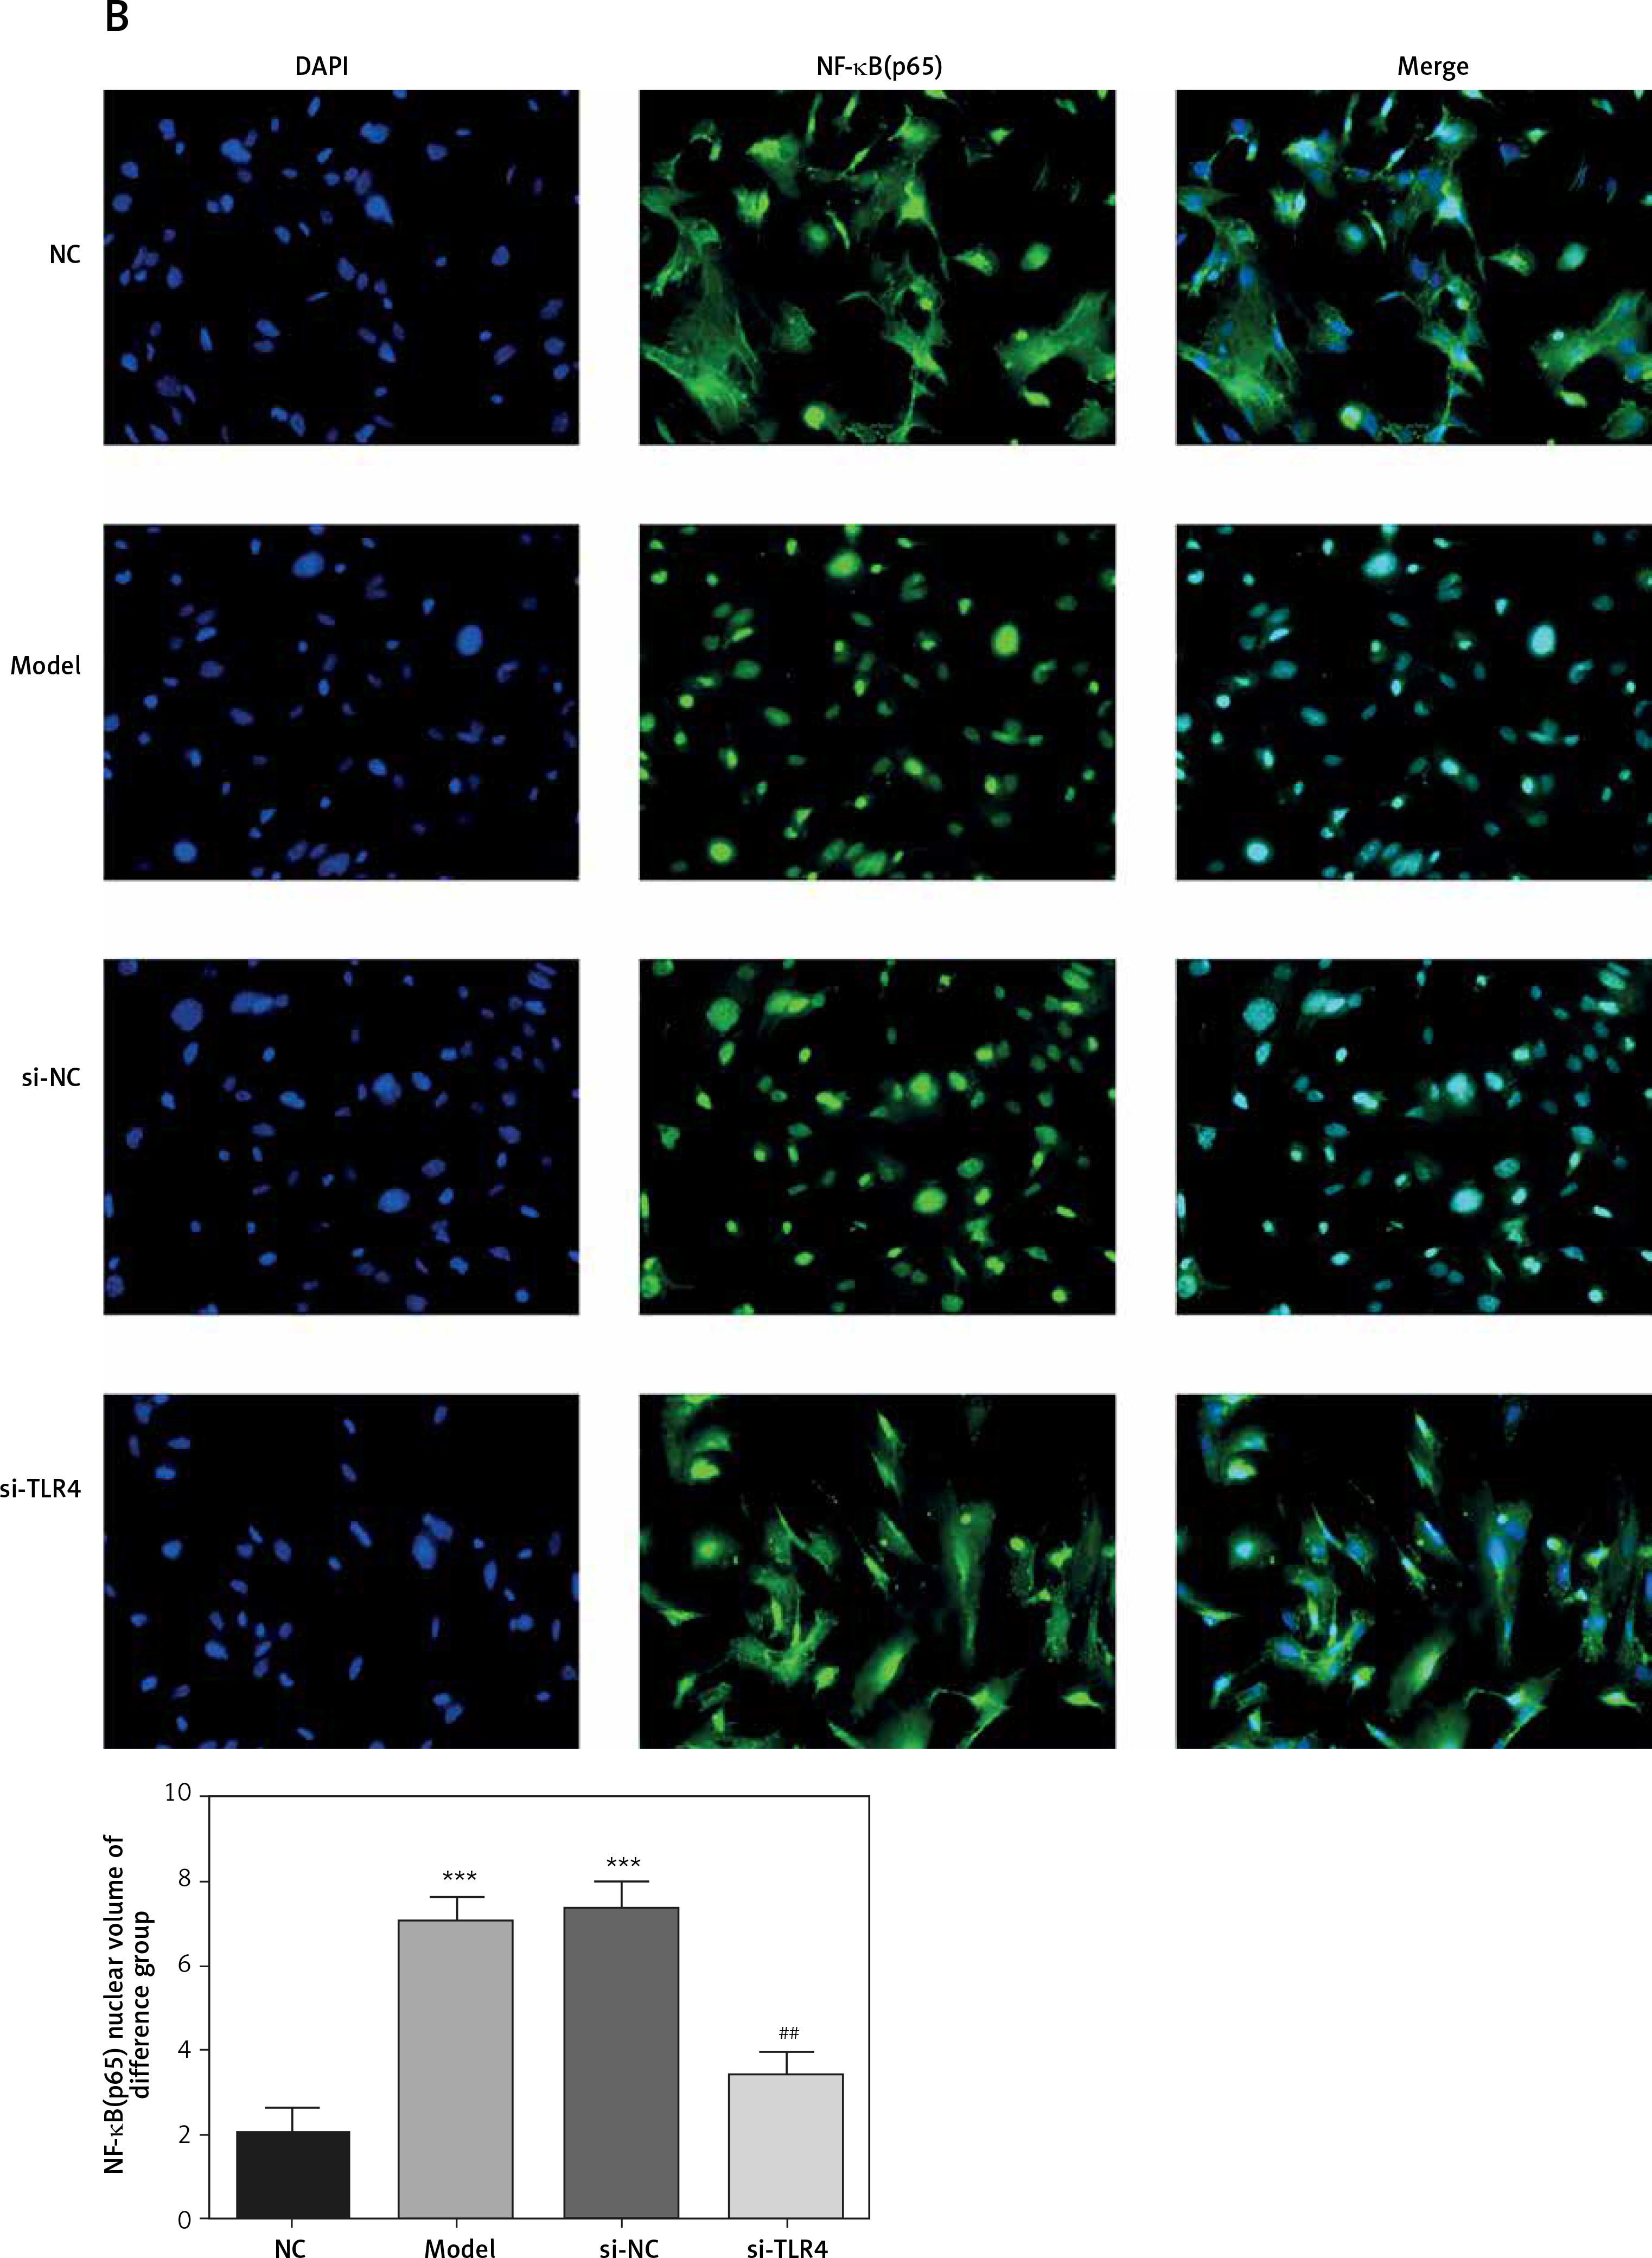
Influence of TLR4 knock-down on amounts of MyD88 and NF-κB(p65) that are transported to nucleus
Here, cell immunofluorescence detection was adopted. Compared with the NC group, amounts of MyD88 and NF-κB(p65) that are transported to the nucleus significantly increase in Model and si-NC groups (p < 0.001, respectively, Figure 5). After si-TLR4 is transferred into TDSCs, such amounts in si-TLR4 suffer significant inhibition (p < 0.01, respectively, Figure 5), which cannot be found among those in the Model group.
Figure 5
Influence of TLR4 knock-down on amounts of MyD88 and NF-κB(p65) that are transported to nucleus. NC – the TDSCs were treated with normal treatment; Model – the TDSCs were treated with 50 ng/ml TGF-β1; si-NC – the cells were transfected with si-NC (negative control) based on the model; si-TLR4 – the cells were transfected with si-TLR4 (knockdown TLR4) based on the model. A – TLR4 knock-down affect MyD88 nuclear volume. ***P < 0.001, compared with NC group; ##p < 0.01, compared with Model group. B – TLR4 knock-down affect NF-κB(p65) nuclear volume. ***P < 0.001, compared with NC group; ##p < 0.01, compared with Model group
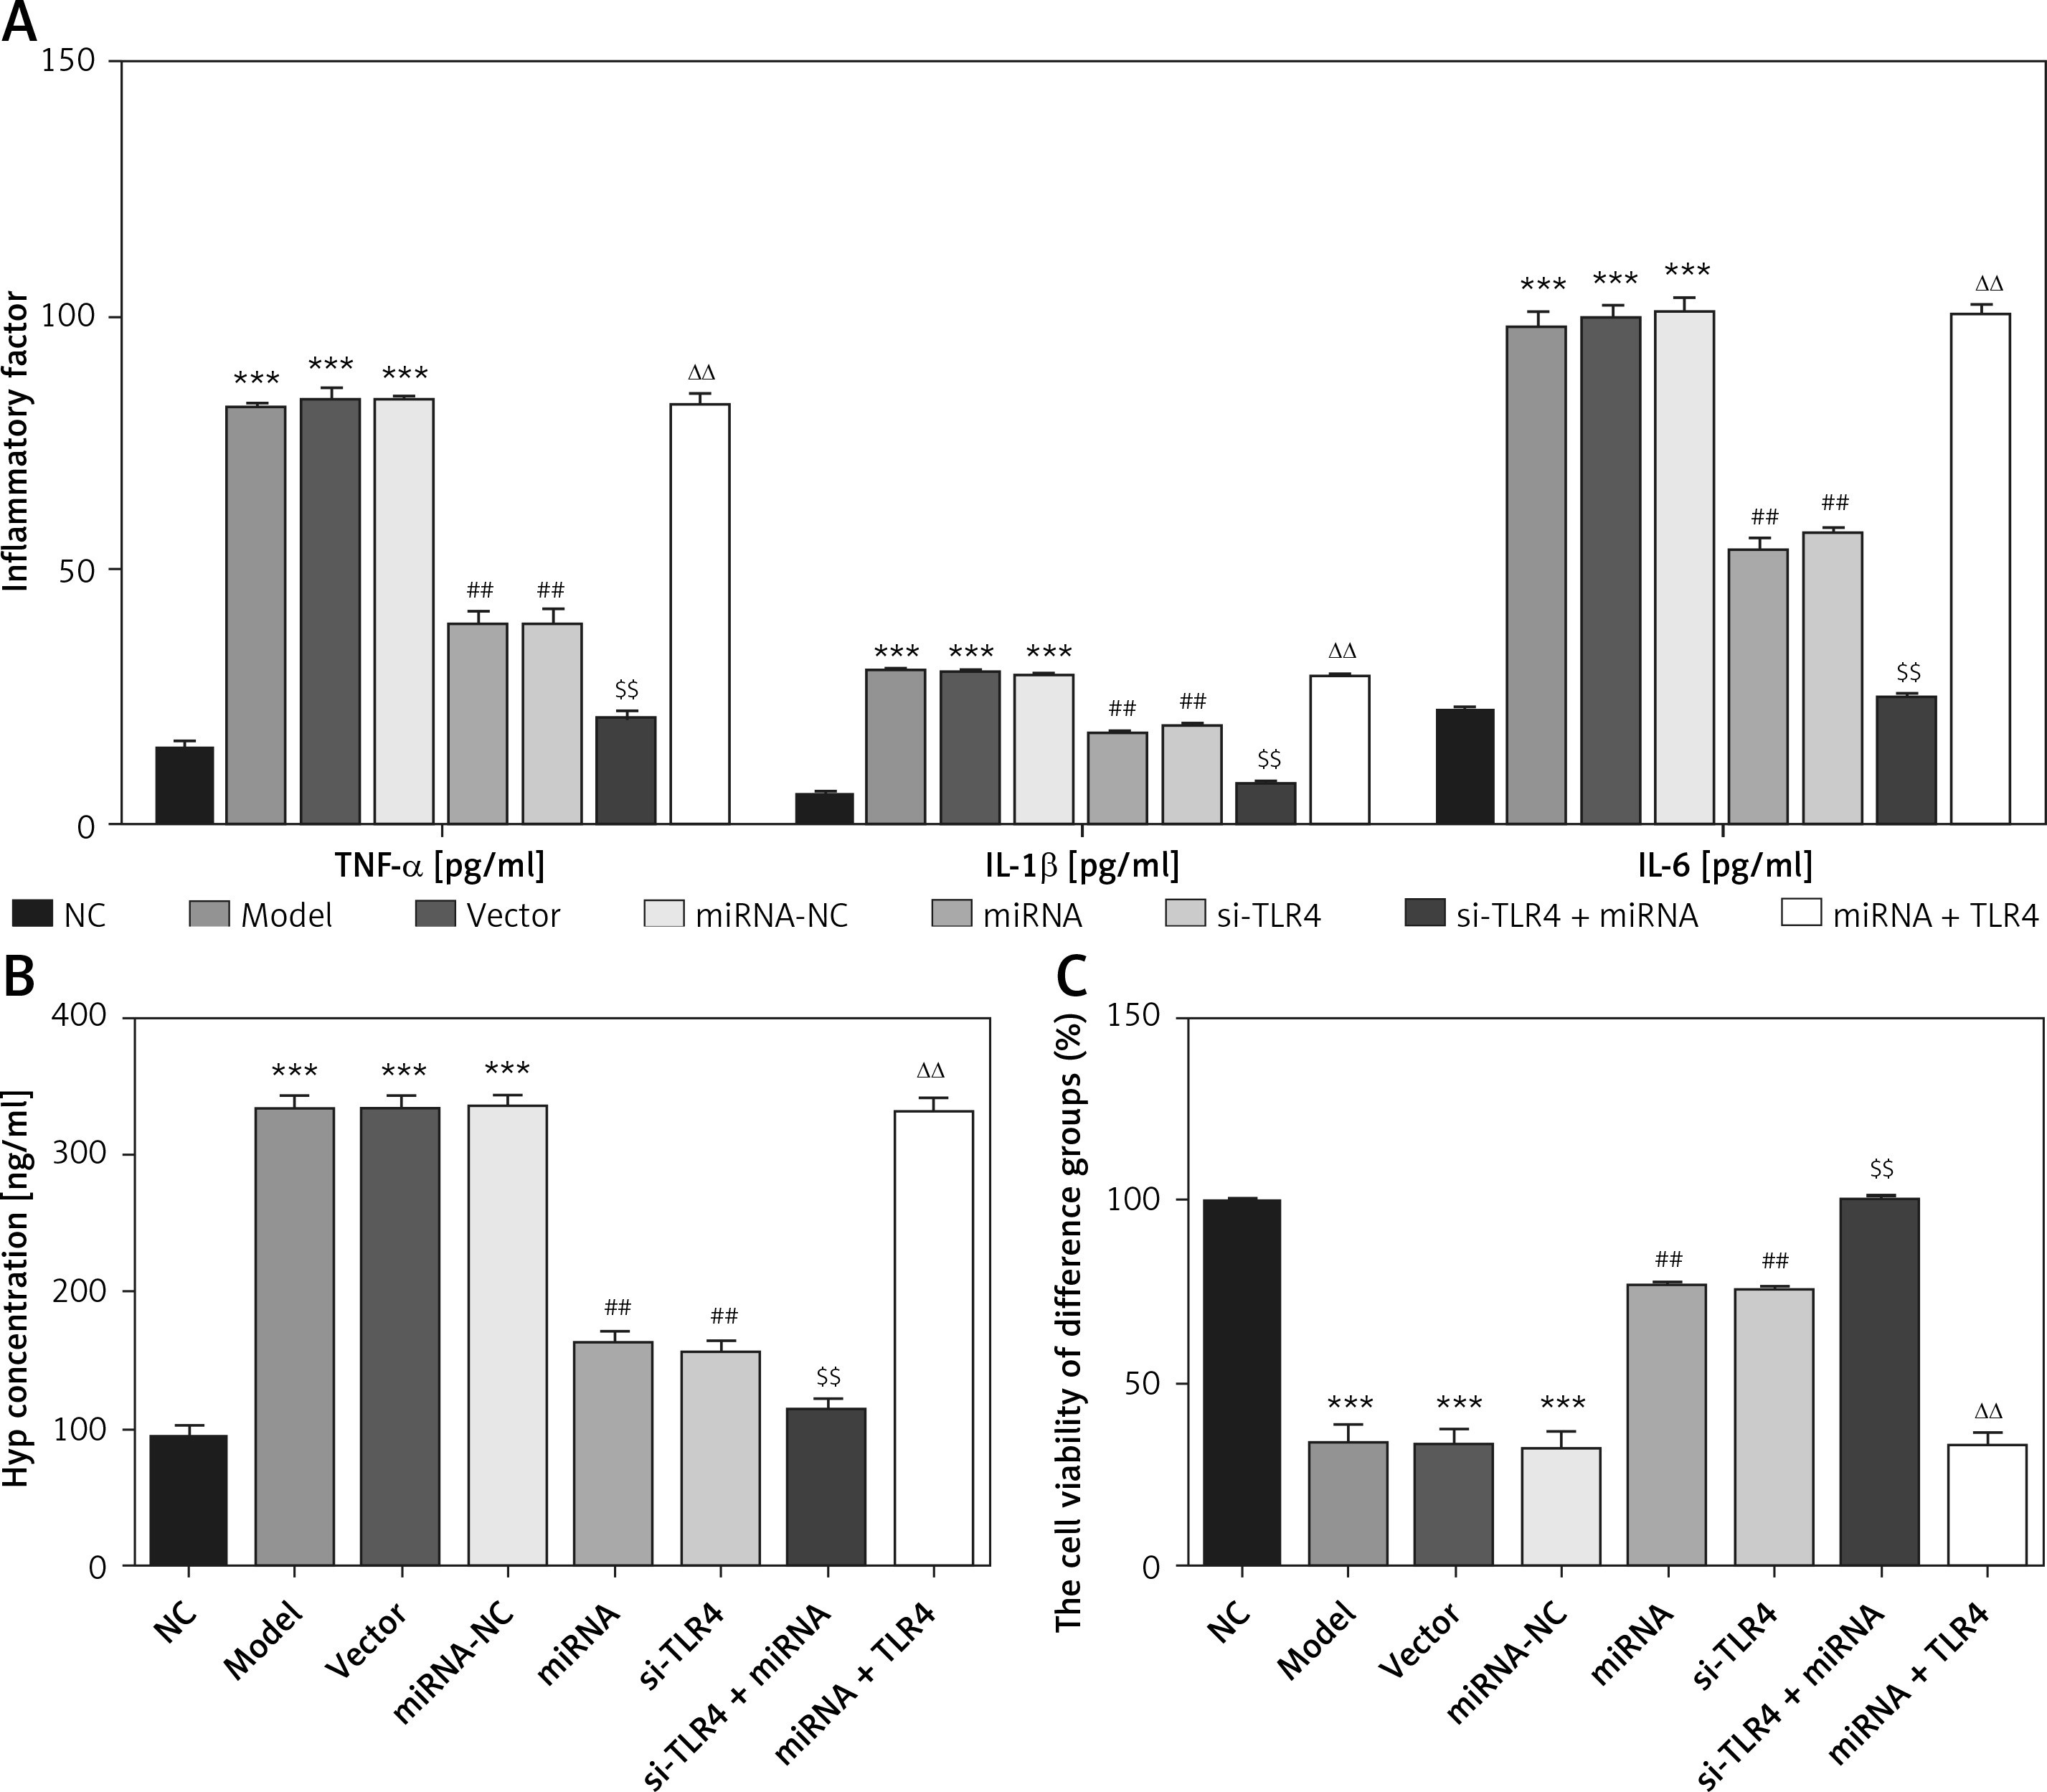
Influence of miRNA-140-5p on proliferation of inflammatory factors, Hyp and TDSCs
Unlike the NC group, concentration levels of TNF-α, IL-1β, IL-6 and Hyp in Model, Vector and miRNA-NC groups all rise significantly (p < 0.001, respectively, Figures 6 A and B). Subsequent to transfection of miRNA-140-5p or si-TLR4, compared with the Model group, TNF-α, IL-1β, IL-6 and Hyp concentration levels of miRNA and si-TLR4 groups markedly decrease (p < 0.01, respectively, Figures 6 A and B). Comparing the si-TLR4 group with the si-TLR4 + miRNA group, concentrations of TNF-α, IL-1β, IL-6 and Hyp of the latter remarkably decline (p < 0.01, respectively, Figures 6 A and B) in the event that transfection of miRNA-140-5p and si-TLR4 are conducted simultaneously. However, for simultaneous transfection of miRNA and TLR4, concentration levels of TNF-α, IL-1β, IL-6 and Hyp in the miRNA+TLR4 group all rise significantly (p < 0.01, respectively, Figures 6 A and B), which cannot be observed in the miRNA group. Cell viability of TDSCs in all groups was observed by means of MTT and relevant observation results are presented in Figure 6 C. Compared with the NC group, that in Model, Vector and miRNA-NC groups is significantly inhibited (p < 0.001, respectively). After miRNA or si-TLR4 transfection, cell viability of miRNA and si-TLR4 groups are enhanced enormously (p < 0.01, respectively), which is not the case for the Model group. When the miRNA + si-TLR4 group is compared with the miRNA group, cell viability of the former is highly elevated (p < 0.01, respectively). In case of simultaneous miRNA-140-5p and TLR4 transfection, cell viability is also remarkably inhibited (p < 0.01, respectively), which cannot be observed in the TLR4 + miRNA group.
Figure 6
Influence of miRNA-140-5p on inflammatory factors, Hyp and TDSCs proliferation. NC – The TDSCs were treated with normal treatment; Model – The TDSCs were treated with 50 ng/ml TGF-β1; Vector – The cells were transfected with empty vector based on the model; miRNA-NC – The cells were transfected with miRNA-NC (negative control) based on the model; miRNA – The cells were transfected with miRNA-140-5p based on the model; si-TLR4 – The cells were transfected with si-TLR4 (knockdown TLR4) based on the model; si-TLR4 + miRNA – The cells were transfected with miRNA-140-5p and si-TLR4 (knockdown TLR4) based on the model; miRNA + TLR4 – The cells were transfected with miRNA-140-5p and TLR4 (TLR4 overexpression) based on the model. A – miRNA-140-5p affect inflammatory factors by ELISA assay. ***P < 0.001, compared with NC group; ##p < 0.01, compared with miRNA-NC group; $$p < 0.01, compared with miRNA group; ΔΔp < 0.01, compared with si-TLR4 + miRNA group. B – miRNA-140-5p affect Hyp concentration by ELISA assay. ***P < 0.001, compared with NC group; ##p < 0.01, compared with miRNA-NC group; $$p < 0.01, compared with miRNA group; ΔΔp < 0.01, compared with si-TLR4 + miRNA group. C – miRNA-140-5p affects cell proliferation by MTT assay. ***P < 0.001, compared with NC group; ##p < 0.01, compared with miRNA-NC group; $$p < 0.01, compared with miRNA group; ΔΔp < 0.01, compared with si-TLR4 + miRNA group
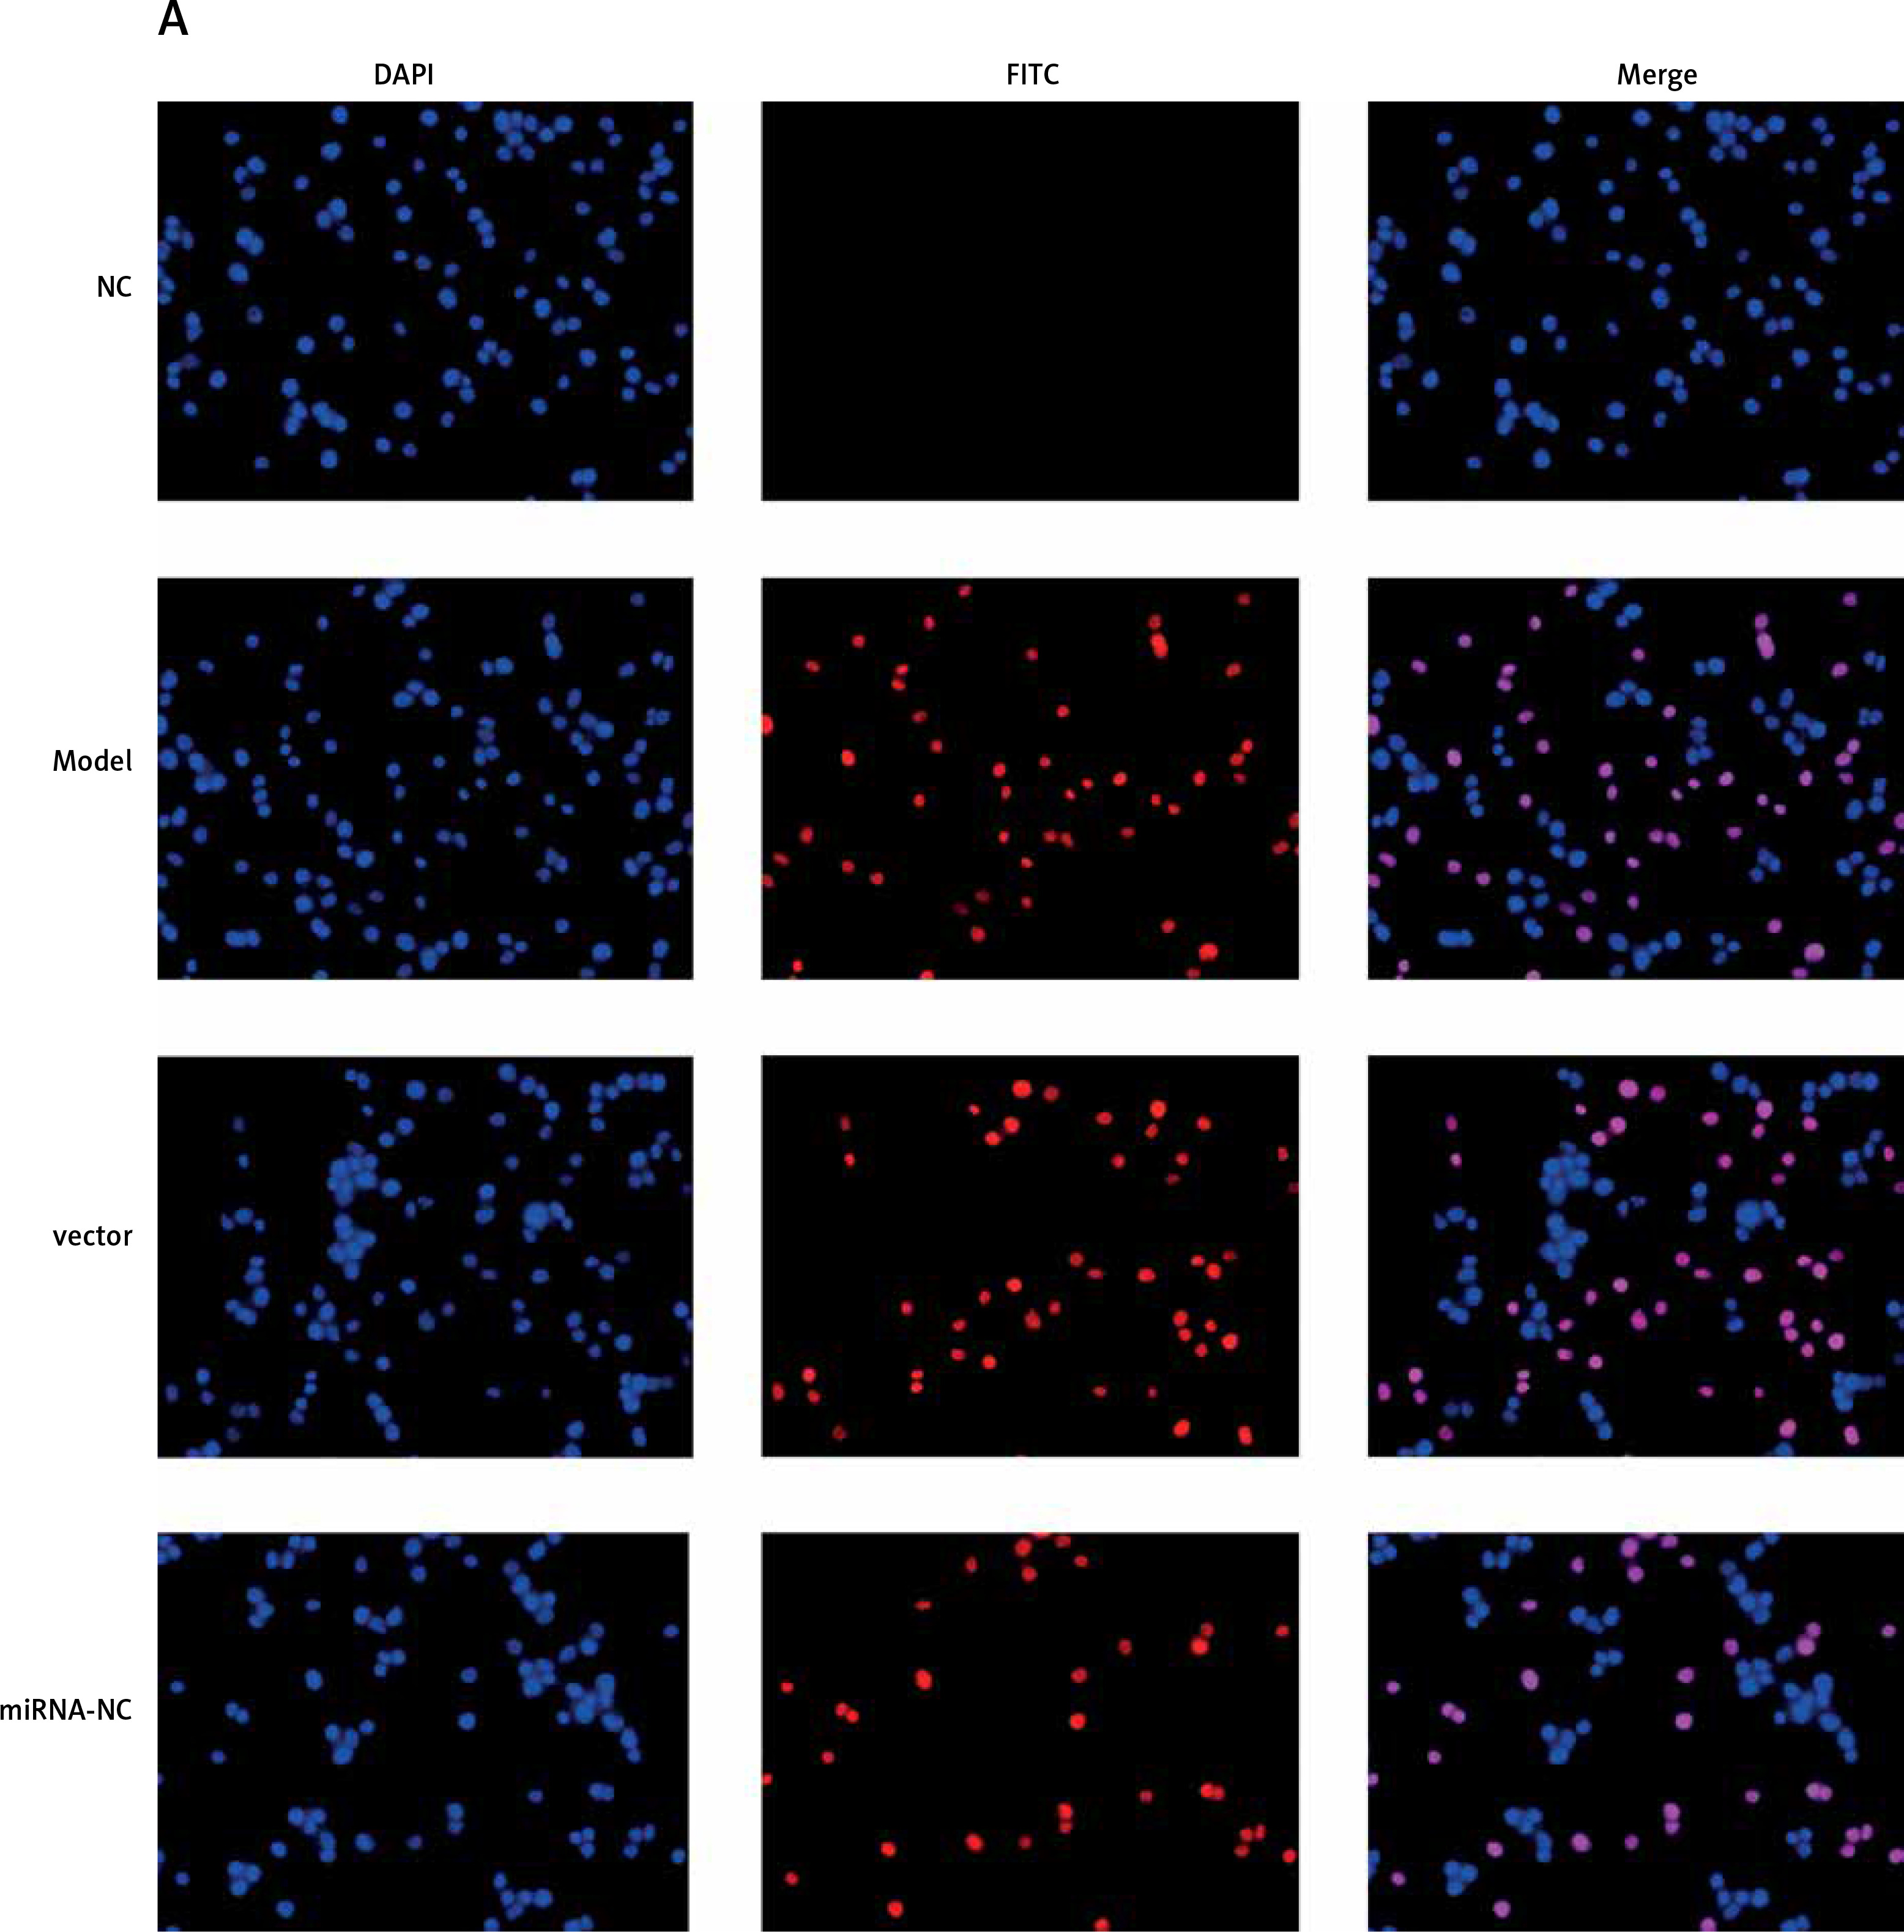
Influence of miRNA-140-5p on TDSC apoptosis
According to TUNEL assay outcomes, no TDSC apoptosis was found in the NC group. Comparatively, apoptosis rates of Model, Vector and miRNA-NC groups are raised significantly (p < 0.001, respectively, Figure 7). After miRNA-140-5p or si-TLR4 transfection, unlike the Model group, apoptosis rates of miRNA and si-TLR4 groups suffer great inhibition (p < 0.001, respectively, Figure 7), as does the apoptosis rate of the miRNA + si-TLR4 group which is compared with the miRNA group (p < 0.001, respectively, Figure 7). However, the apoptosis rate of the TLR4 + miRNA group obviously rises (p < 0.01, respectively), compared with the si-TLR4 group.
Figure 7
miRNA-140-5p affects cell apoptosis by TUNEL assay. NC – the TDSCs were treated with normal treatment; Model – the TDSCs were treated with 50 ng/ml TGF-β1; Vector – the cells were transfected with empty vector based on the model; miRNA-NC – the cells were transfected with miRNA-NC (negative control) based on the model; miRNA – the cells were transfected with miRNA-140-5p based on the model; si-TLR4 – the cells were transfected with si-TLR4 (knockdown TLR4) based on the model; si-TLR4 + miRNA – the cells were transfected with miRNA-140-5p and si-TLR4 (knockdown TLR4) based on the model; miRNA + TLR4 – the cells were transfected with miRNA-140-5p and TLR4 (TLR4 overexpression) based on the model. ***P < 0.001, compared with NC group; ##p < 0.01, compared with miRNA-NC group; $$p < 0.01, compared with miRNA group; ΔΔp < 0.01, compared with si-TLR4 + miRNA group
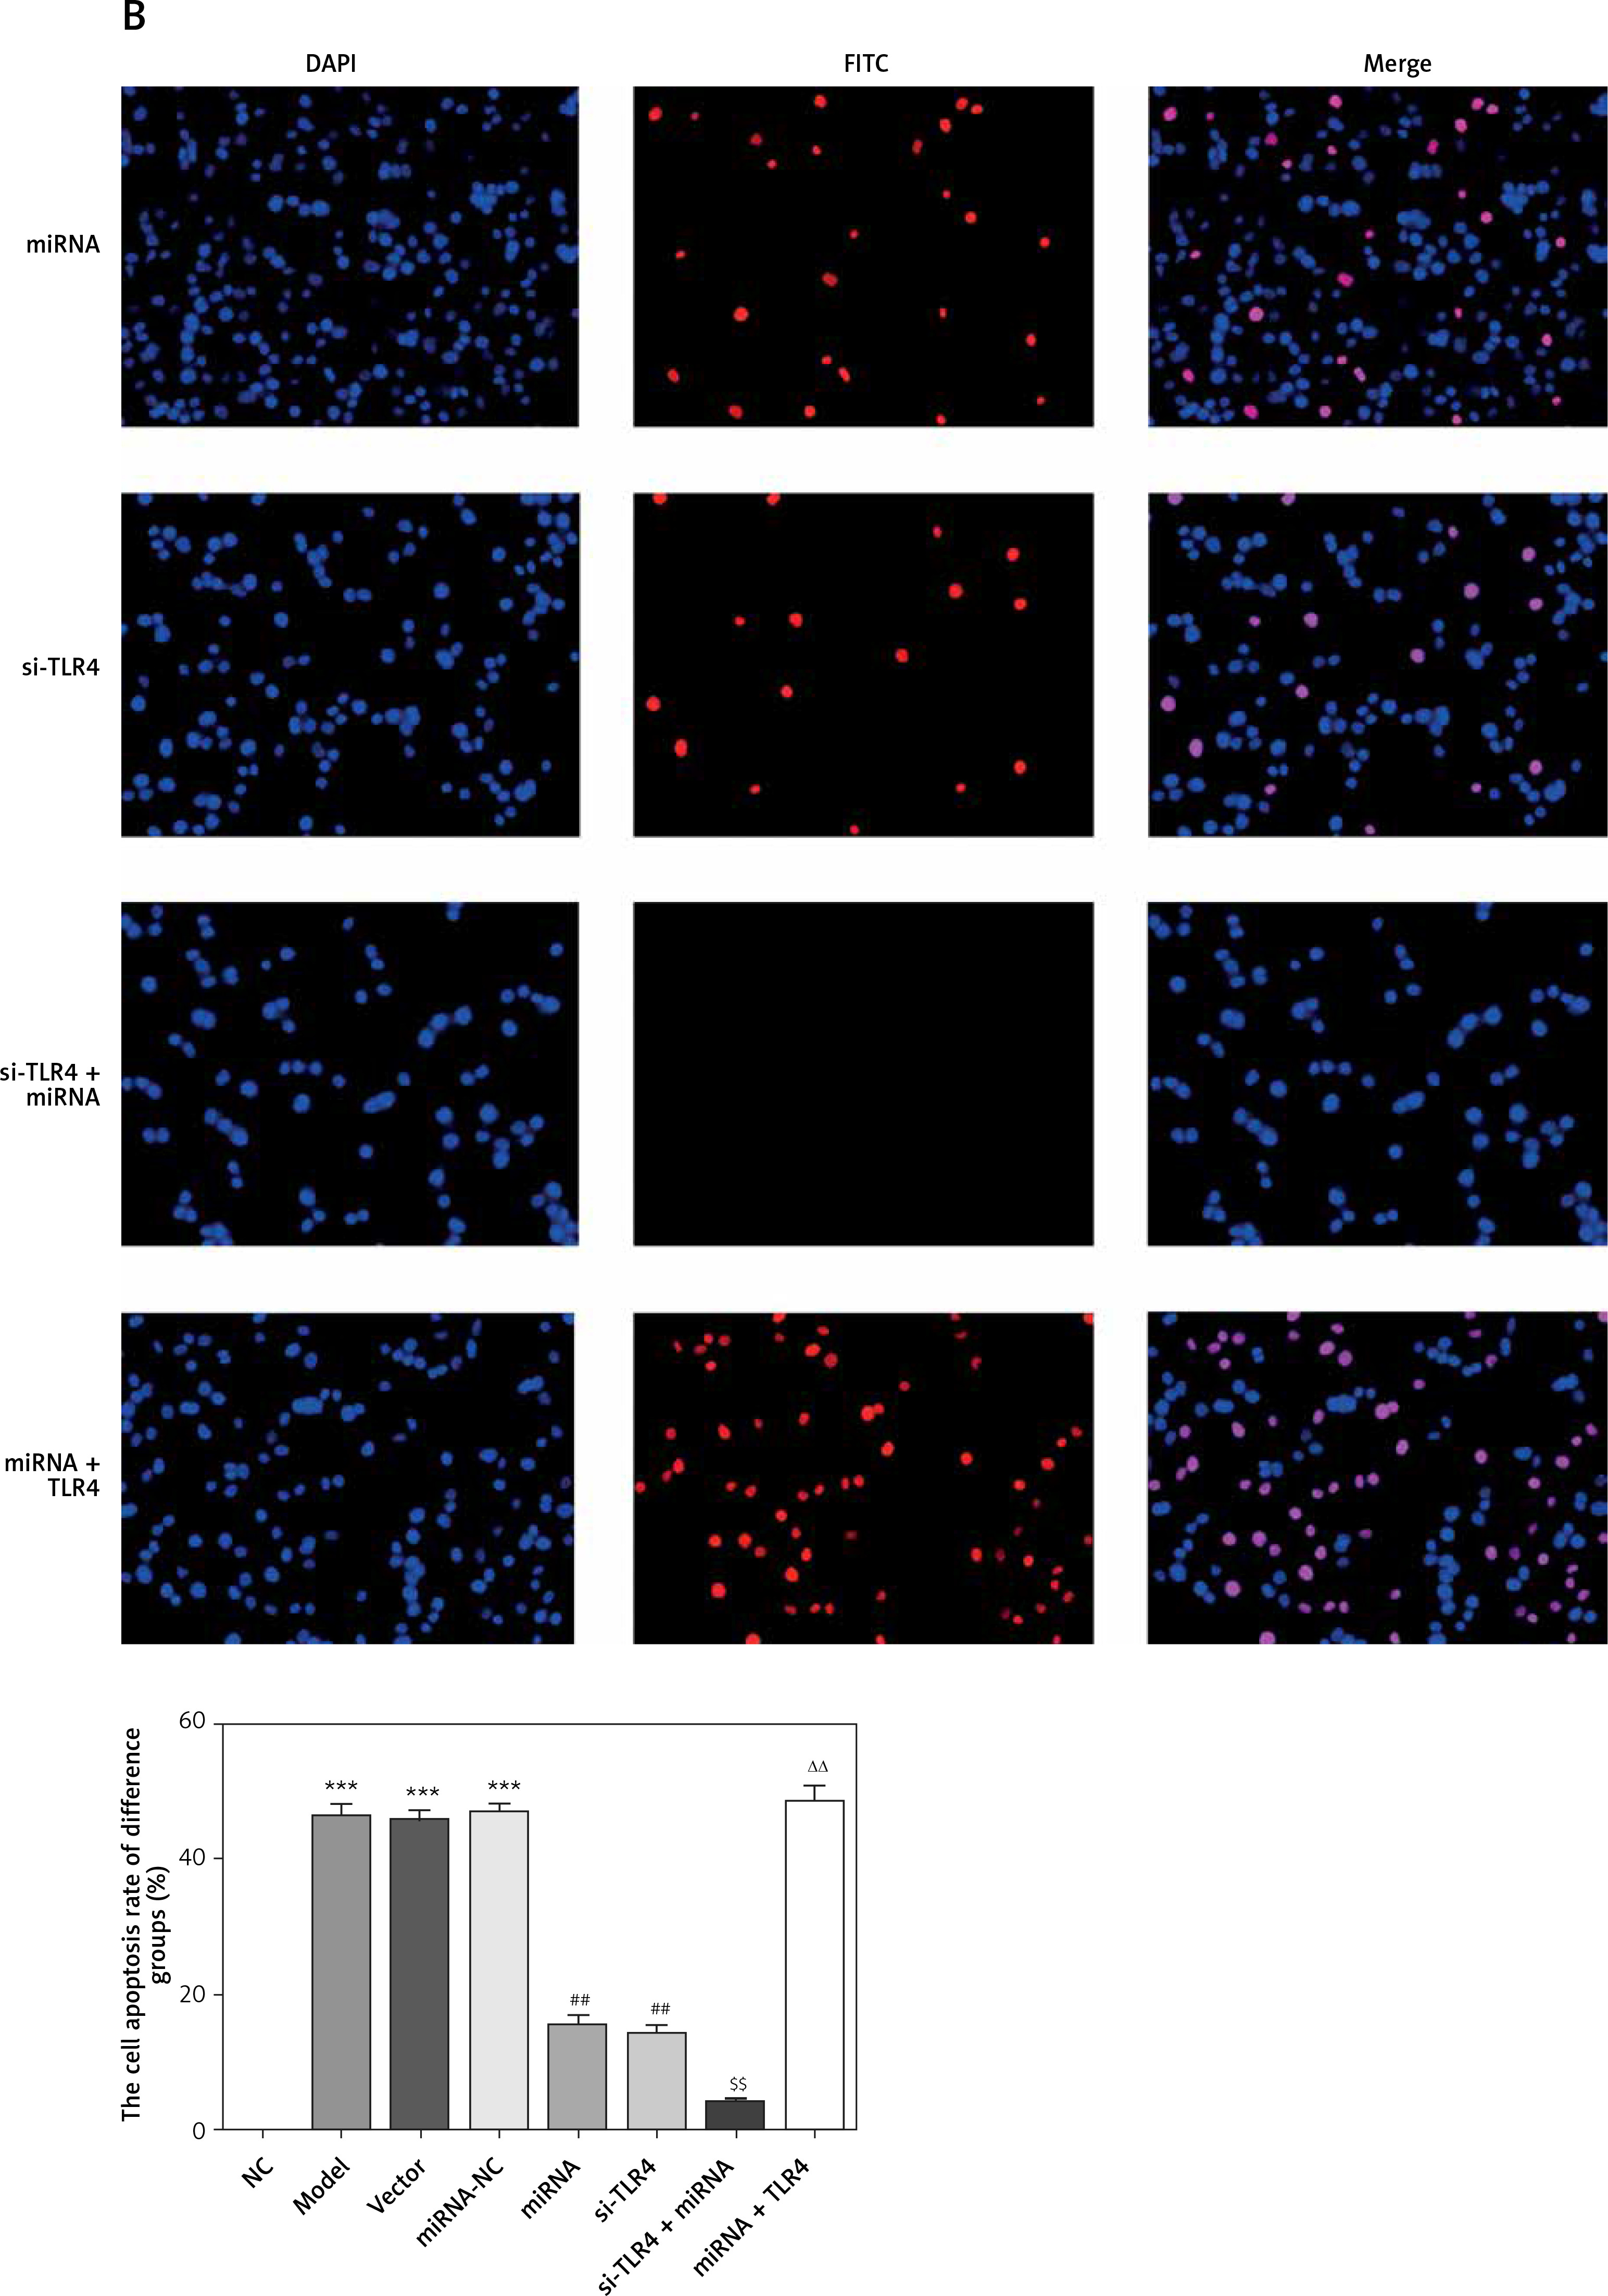
Influence of miRNA-140-5p in all groups on related gene expression
As demonstrated by RT-qPCR detection, miRNA-140-5pmRNA expression levels in Model, Vector and miRNA-NC groups are significantly lowered (p < 0.001, respectively, Figure 8), which is not the case for the NC group; when compared with the Model group, miRNA-140-5p mRNA expression levels in miRNA, si-TLR4 + miRNA and miRNA + TLR4 significantly increase (p < 0.001, respectively, Figure 8), so do TLR4, MyD88 and NF-κB(p65)mRNA expression levels in Model, Vector and miRNA-NC groups for comparison with the NC group; and, expression levels of TLR4, MyD88 and NF-κB(p65)mRNA in miRNA and si-TLR4 groups that are compared with the Model group all decline remarkably (p < 0.01, respectively, Figure 8). Additionally, unlike the miRNA group, TLR4, MyD88 and NF-κB(p65)mRNA expression levels in the miRNA + si-TLR4 group outstandingly drop (p < 0.01, respectively, Figure 8). In the context of simultaneous transfection of miRNA-140-5p and TLR4, a significant increase can also be found in TLR4, MyD88 and NF-κB(p65)mRNA expression levels in the TLR4 + miRNA group (p < 0.01, respectively, Figure 8).
Figure 8
miRNA-140-5p affect relative mRNA expression by RT-qPCR assay. NC – the TDSCs were treated with normal treatment; Model – the TDSCs were treated with 50 ng/ml TGF-β1; Vector – the cells were transfected with empty vector based on the model; miRNA-NC – The cells were transfected with miRNA-NC (negative control) based on the model; miRNA – the cells were transfected with miRNA-140-5p based on the model; si-TLR4 – the cells were transfected with si-TLR4 (knockdown TLR4) based on the model; si-TLR4 + miRNA – the cells were transfected with miRNA-140-5p and si-TLR4 (knockdown TLR4) based on the model; miRNA + TLR4 – the cells were transfected with miRNA-140-5p and TLR4 (TLR4 overexpression) based on the model. ***P < 0.001, compared with NC group; ##p < 0.01, compared with miRNA-NC group; $$p < 0.01, compared with miRNA group; ΔΔp < 0.01, compared with si-TLR4 + miRNA group
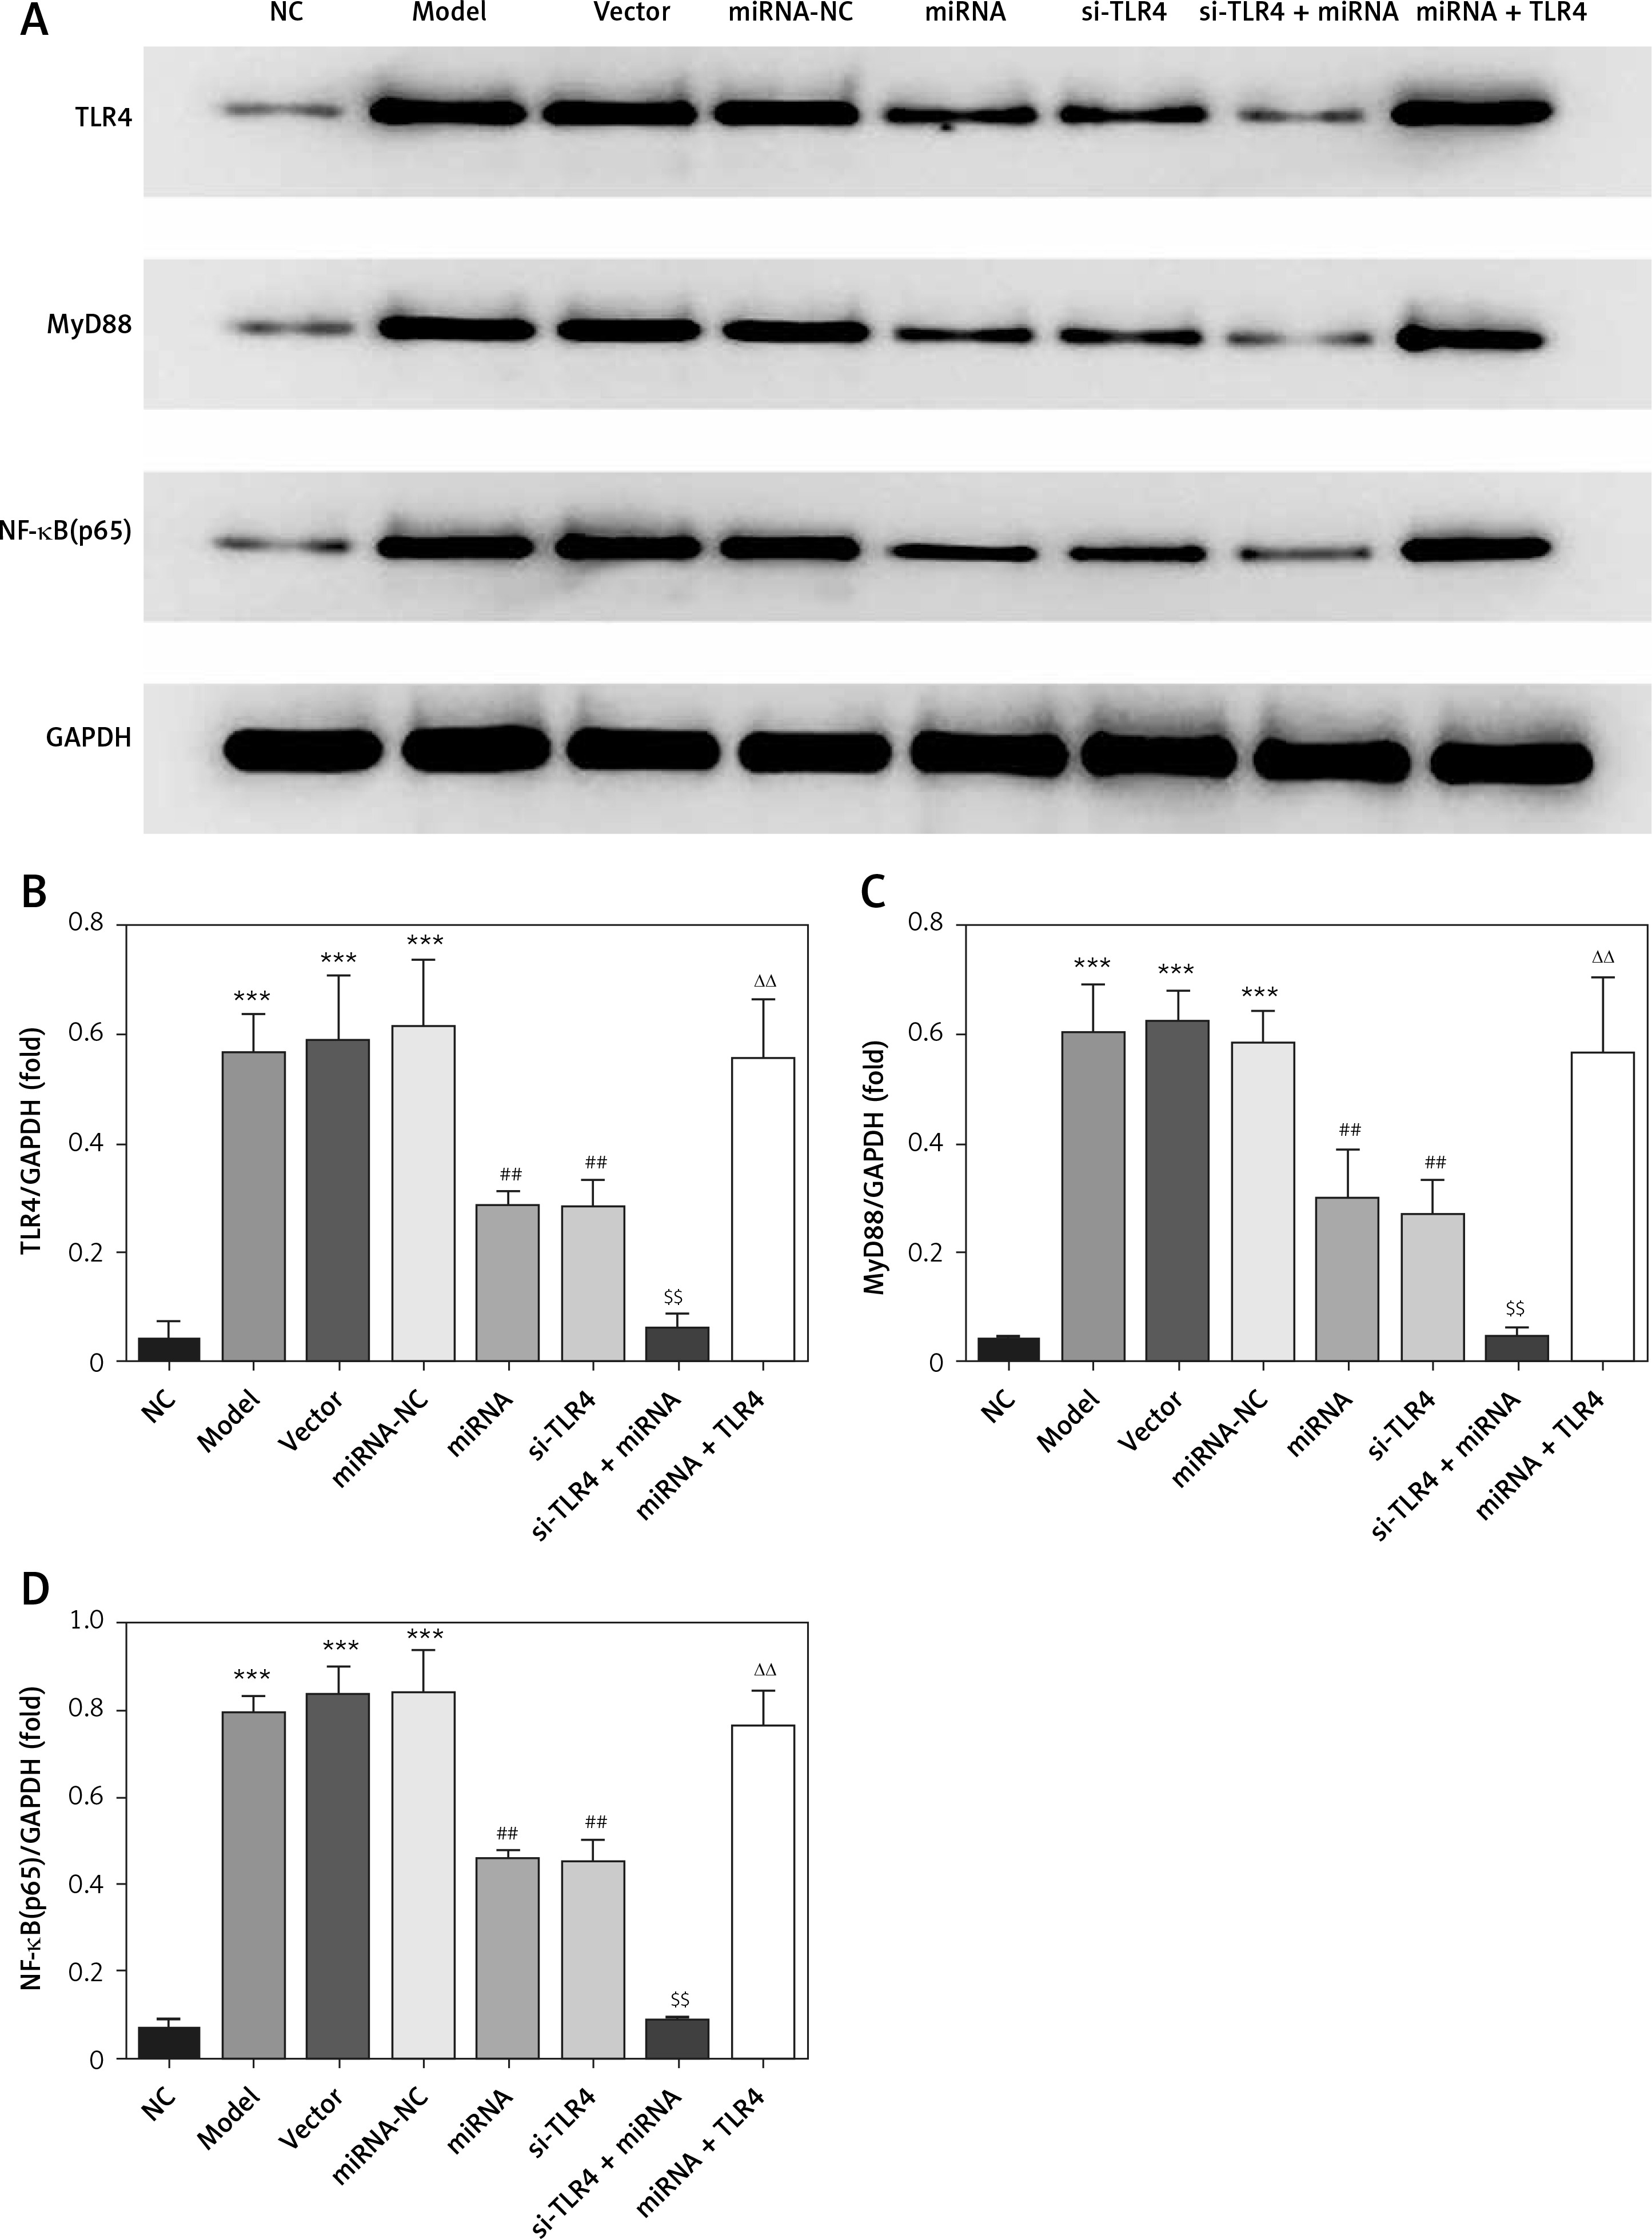
Influence of miRNA-140-5p detection by WB on related proteins
Compared with the NC group, The TLR4, MyD88 and NF-κB(p65) protein expression levels were significantly up-regulation in Model, Vector and miRNA-NC groups (p < 0.001, respectively, Figure 9); compared with the Model group, TLR4, MyD88 and NF-κB(p65) protein expression levels were significantly suppressed in miRNA and si-TLR4 groups (p < 0.01, respectively, Figure 9). Meanwhile, compared with the miRNA group, TLR4, MyD88 and NF-κB(p65) protein expression levels were significantly down-regulated in the miRNA + si-TLR4 group (p < 0.01, respectively, Figure 9); after transfection miRNA-140-5p and TLR4, compared with si-TLR4 group, TLR4, MyD88 and NF-κB(p65) protein expression levels were significantly up-regulated in the TLR4 + miRNA group (p < 0.01, respectively, Figure 9).
Figure 9
miRNA-140-5p affects relative protein expression by WB assay. NC – the TDSCs cells were treated with normal treatment; Model – the TDSCs were treated with 50 ng/ml TGF-β1; Vector – the cells were transfected with empty vector based on the model; miRNA-NC – the cells were transfected with miRNA-NC (negative control) based on the model; miRNA – the cells were transfected with miRNA-140-5p based on the model; si-TLR4 – the cells were transfected with si-TLR4 (knockdown TLR4) based on the model; si-TLR4 + miRNA – the cells were transfected with miRNA-140-5p and si-TLR4 (knockdown TLR4) based on the model; miRNA + TLR4 – the cells were transfected with miRNA-140-5p and TLR4 (TLR4 overexpression) based on the model. ***P < 0.001, compared with NC group; ##p < 0.01, compared with miRNA-NC group; $$p < 0.01, compared with miRNA group; ΔΔp < 0.01, compared with si-TLR4 + miRNA group
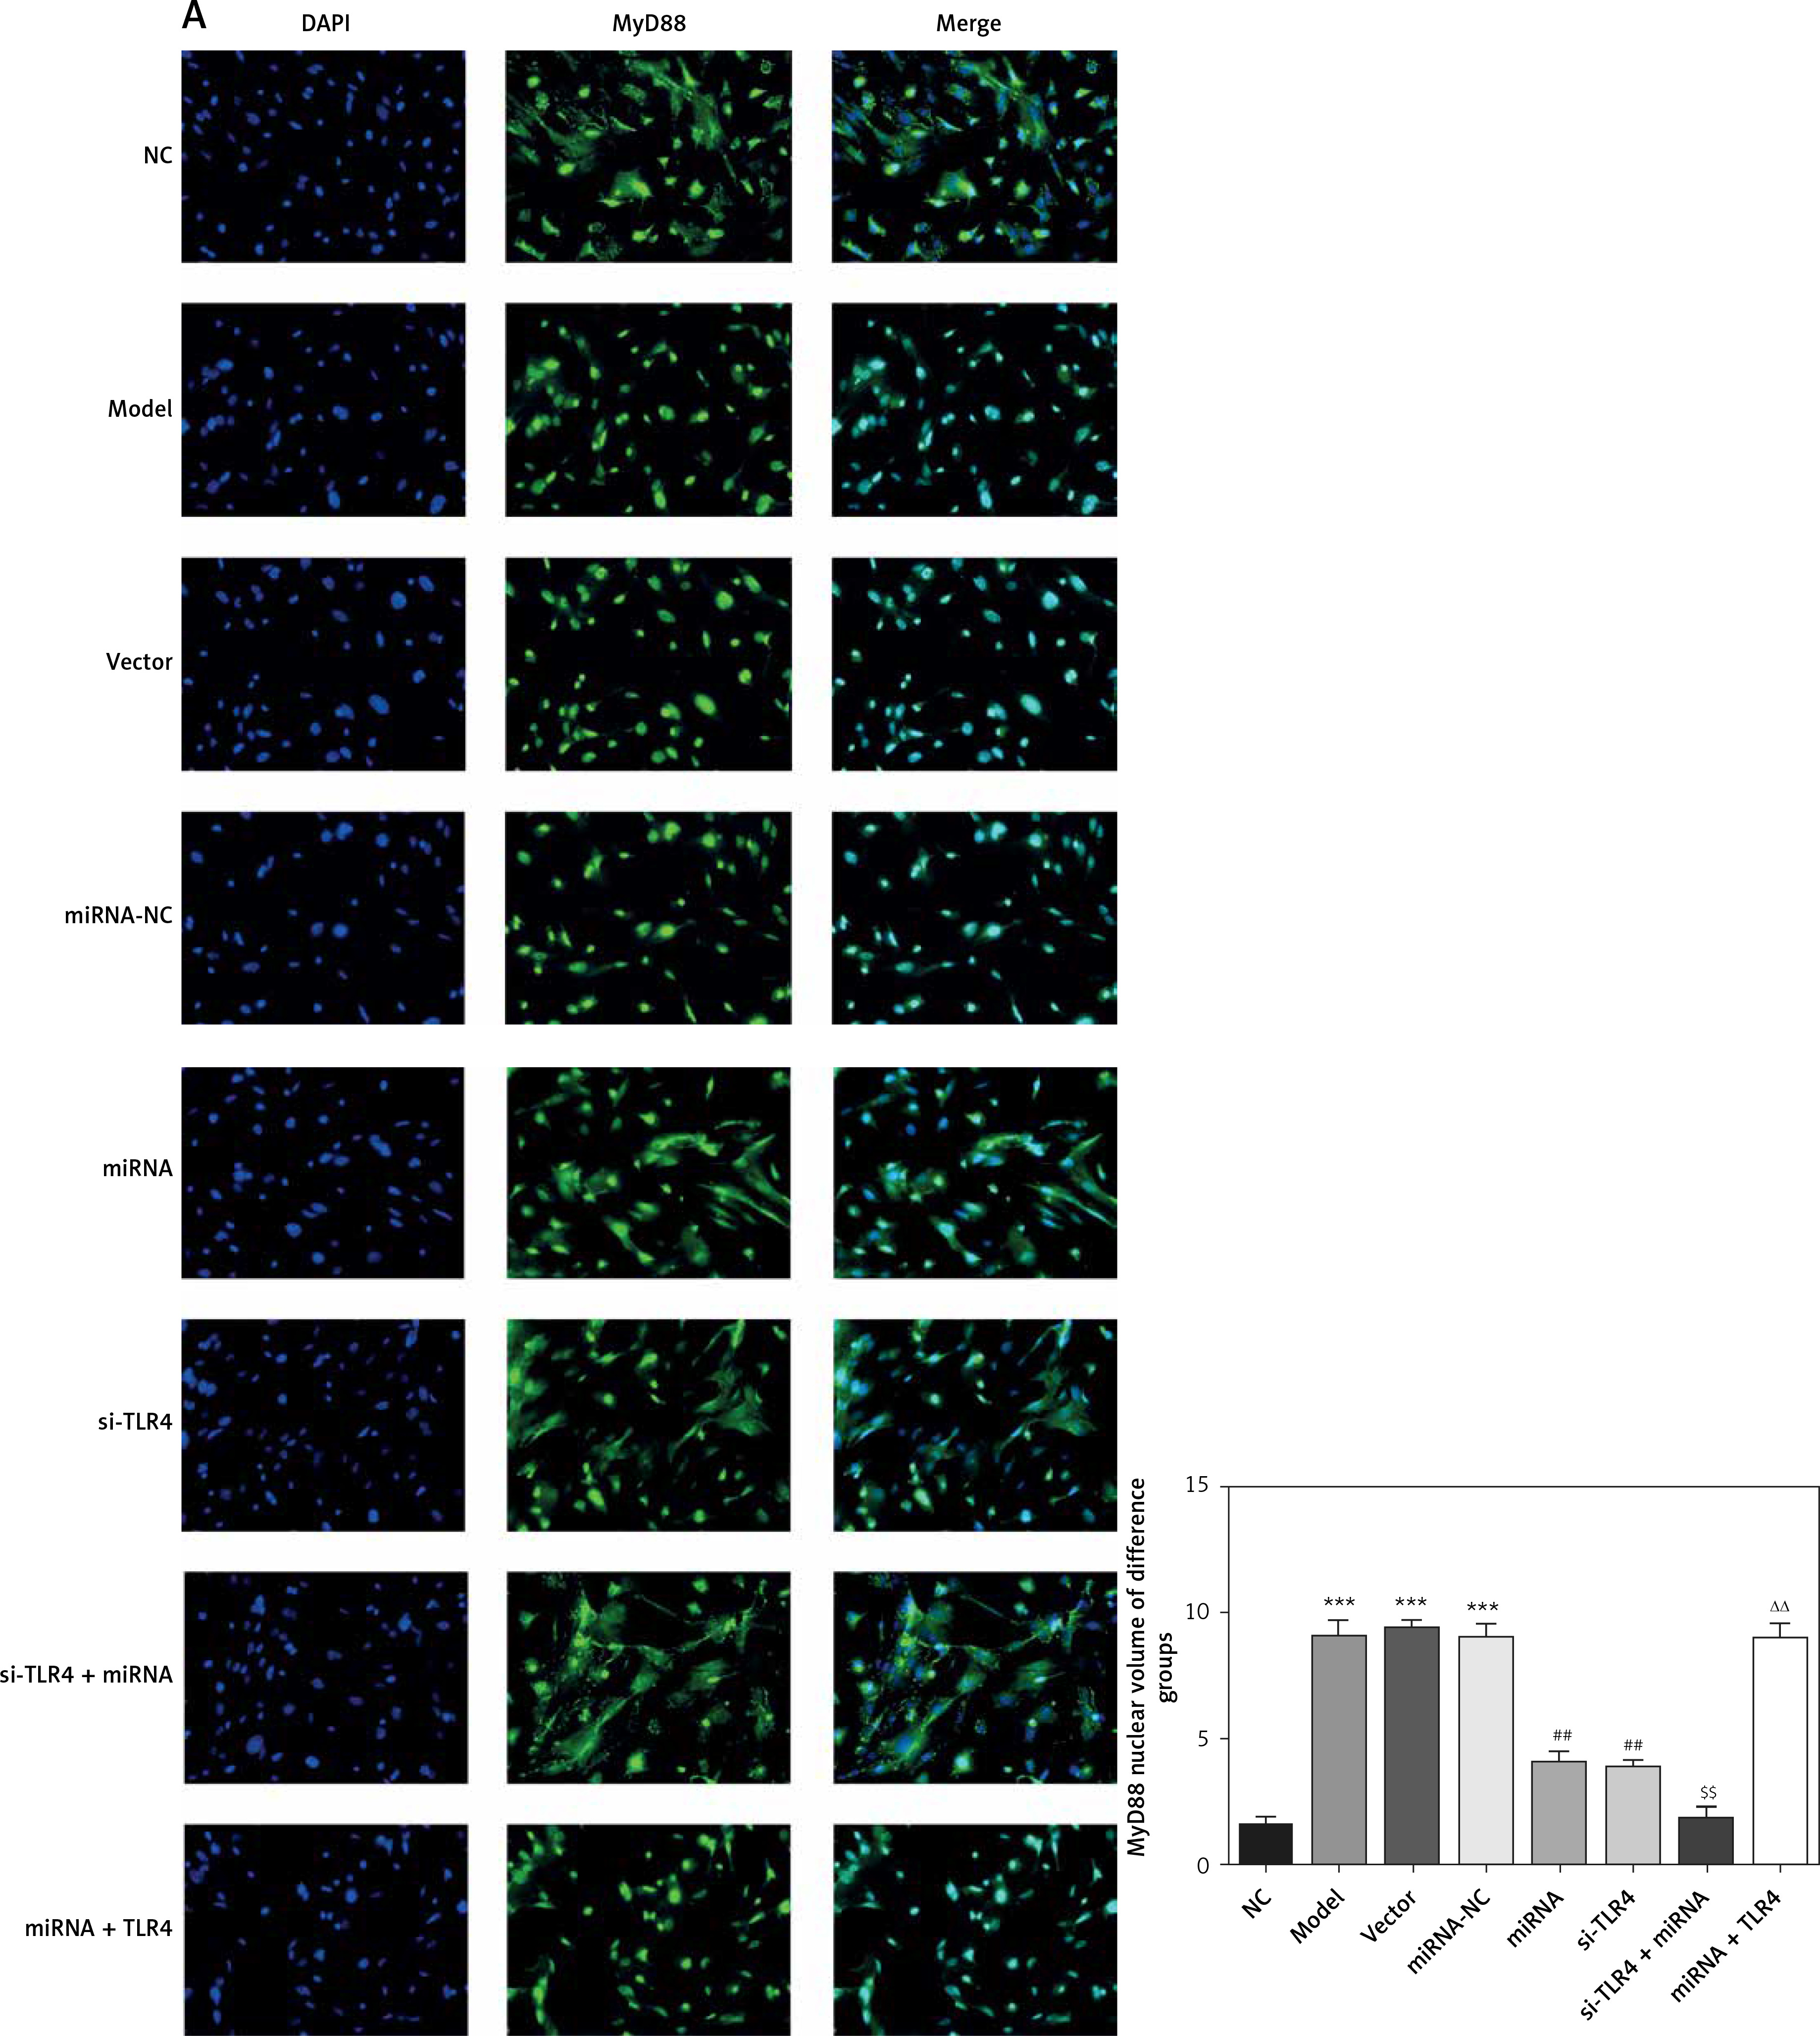
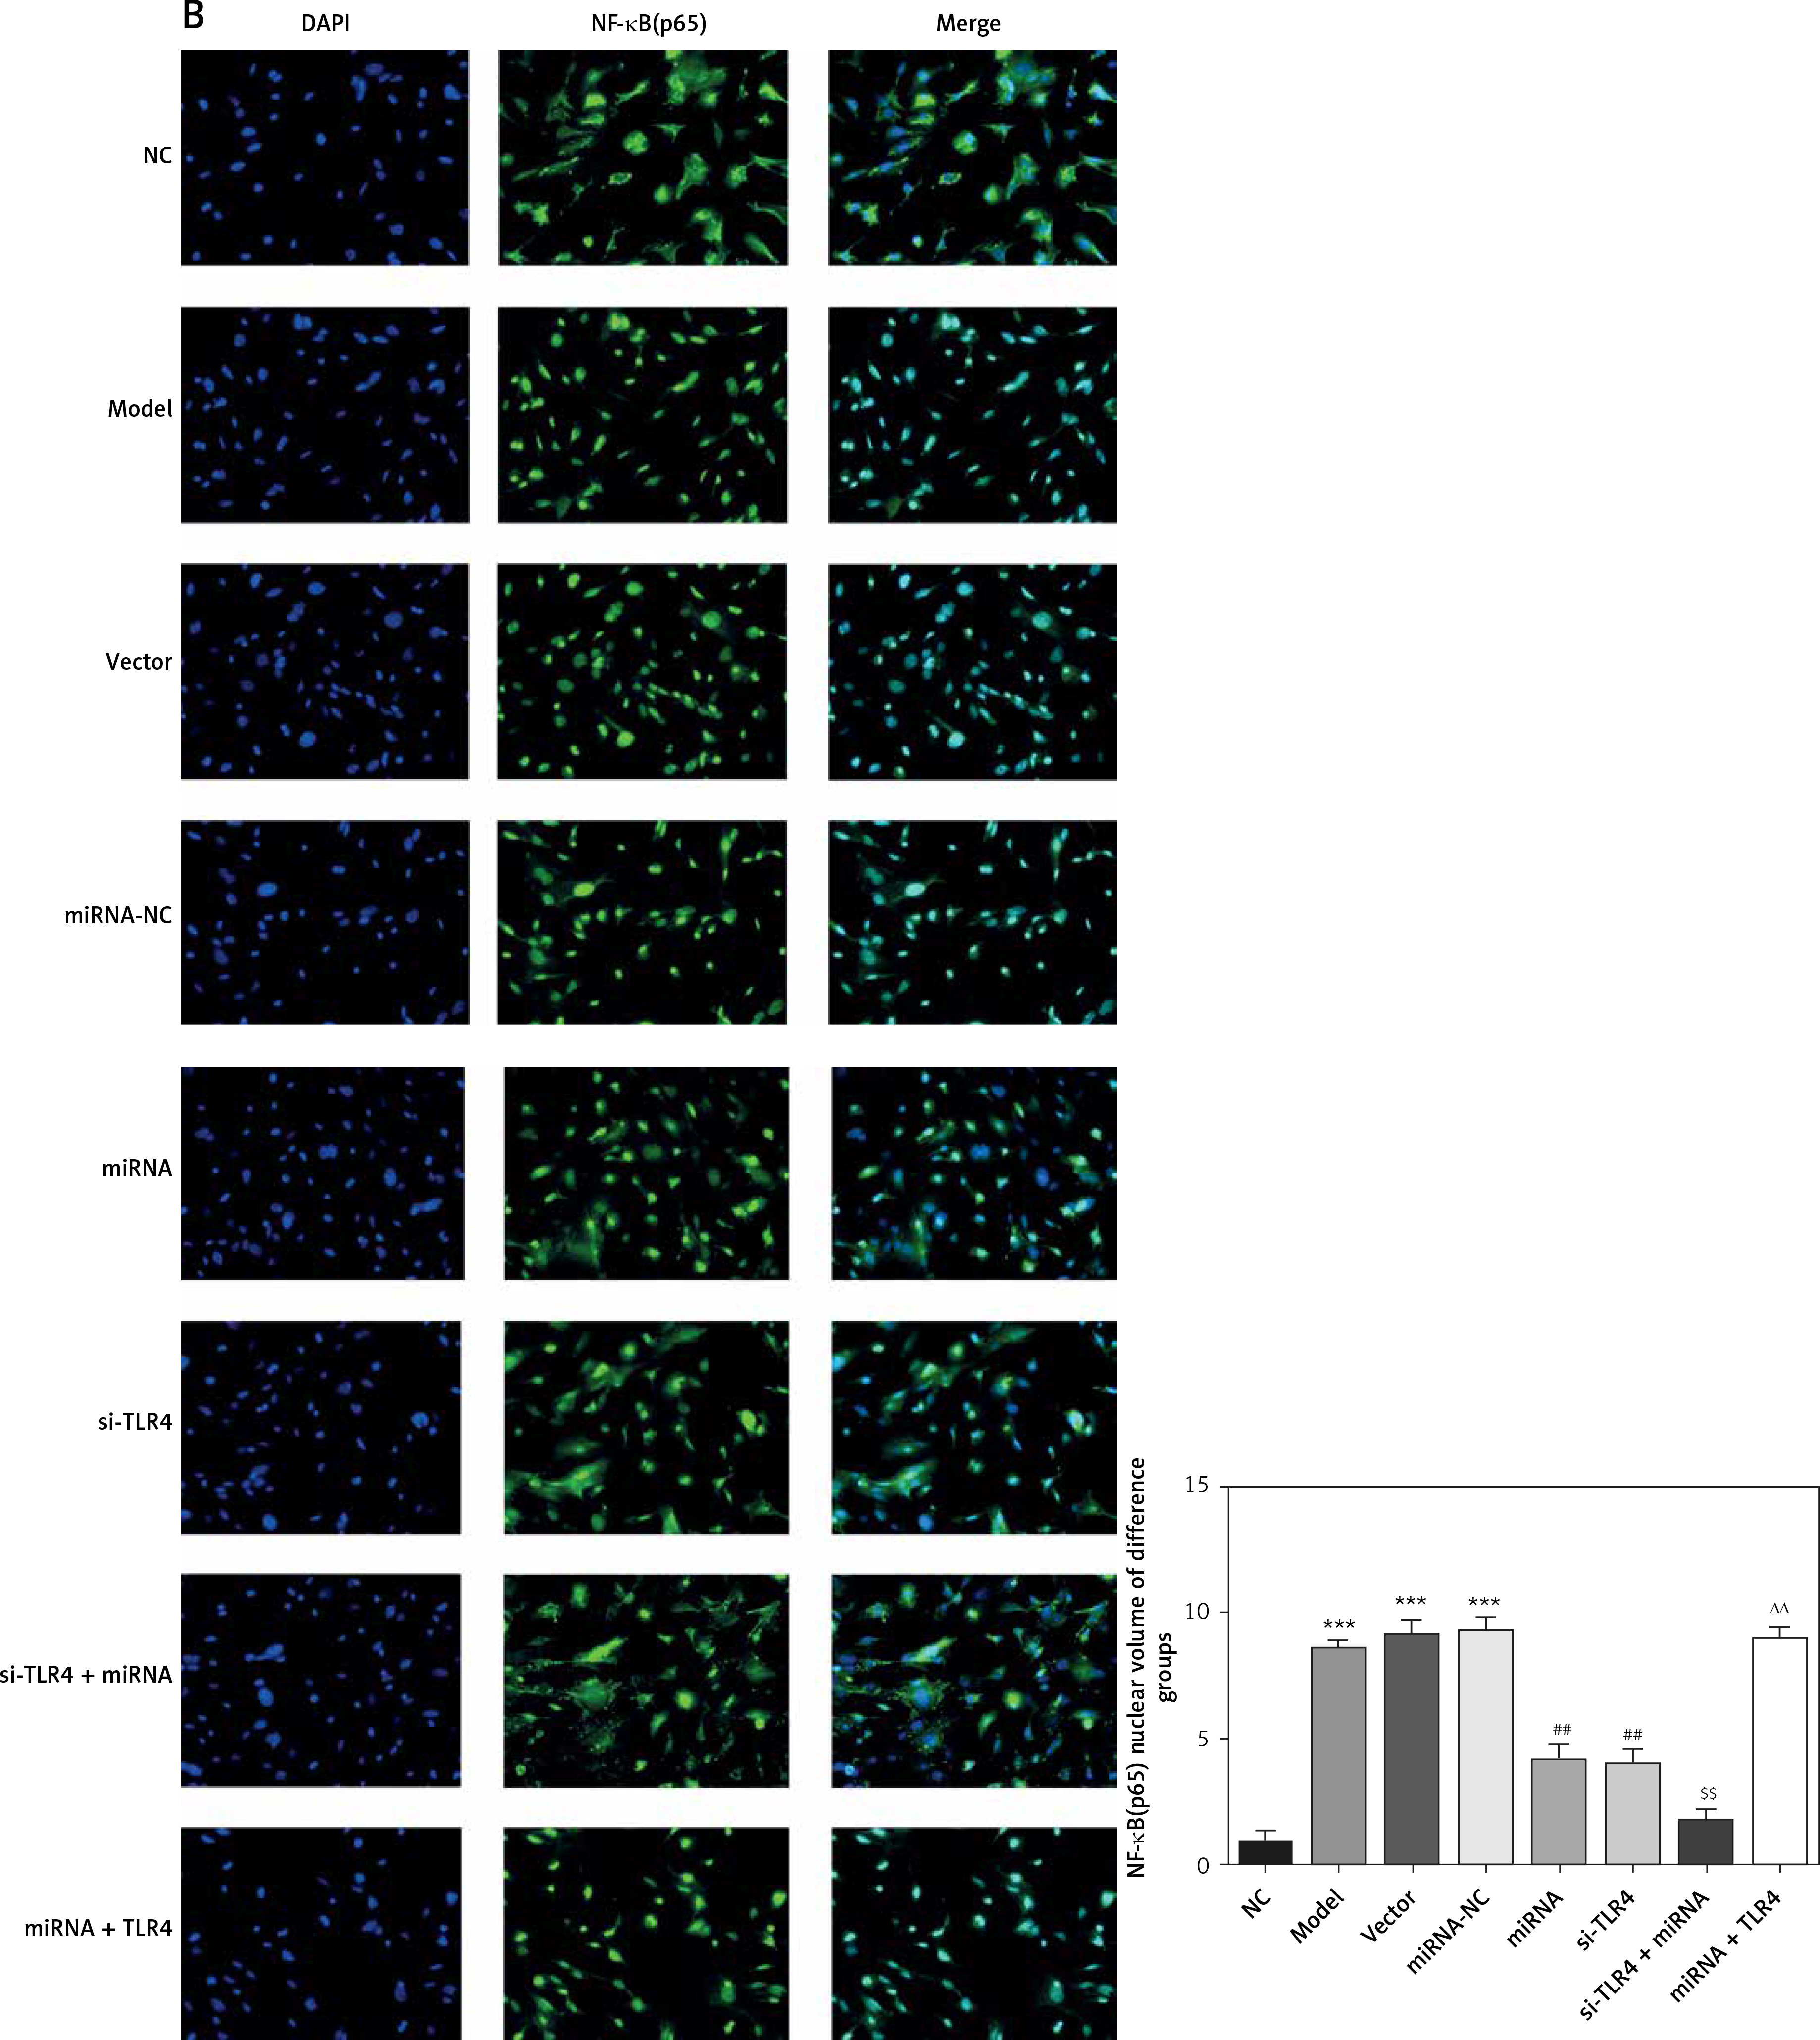
Influence of miRNA-140-5p on amounts of MyD88 and NF-κB(p65) that are transported to nucleus
Compared with the NC group, amounts of MyD88 and NF-κB(p65) proteins that are transported to the nucleus in groups Model, Vector and miRNA-NC significantly rise (p < 0.001, respectively, Figure 10). Compared with the Model group, their amounts that are transported to the nucleus in miRNA and si-TLR4 groups are enormously brought down (p < 0.01, respectively, Figure 10). In addition, such amounts in the miRNA + si-TLR4 group apparently decline compared with the miRNA group (p < 0.01, respectively, Figure 10). Comparatively, amounts of MyD88 and NF-κB(p65) proteins that are transported to the nucleus show an obvious increase in the TLR4 + miRNA that is compared with the si-TLR4 group subsequent to simultaneous transfection of miRNA-140-5p and TLR4 (p < 0.01, respectively, Figure 10).
Figure 10
miRNA-140-5p affect MyD88 and NF-κB(p65) protein nuclear volume. NC – the TDSCs cells were treated with normal treatment; Model – the TDSCs were treated with 50 ng/ml TGF-β1; Vector – the cells were transfected with empty vector based on the model; miRNA-NC – the cells were transfected with miRNA-NC (negative control) based on the model; miRNA – the cells were transfected with miRNA-140-5p based on the model; si-TLR4 – the cells were transfected with si-TLR4 (knockdown TLR4) based on the model; si-TLR4 + miRNA – the cells were transfected with miRNA-140-5p and si-TLR4 (knockdown TLR4) based on the model; miRNA + TLR4 – the cells were transfected with miRNA-140-5p and TLR4 (TLR4 overexpression) based on the model. A – miRNA-140-5p affects MyD88 nuclear volume. ***P < 0.001, compared with NC group; ##p < 0.01, compared with miRNA-NC group; $$p < 0.01, compared with miRNA group; ΔΔp < 0.01, compared with si-TLR4 + miRNA group. B – miRNA-140-5p affects NF-κB(p65) nuclear volume. ***P < 0.001, compared with NC group; ##p < 0.01, compared with miRNA-NC group; $$p < 0.01, compared with miRNA group; ΔΔp < 0.01, compared with si-TLR4 + miRNA group
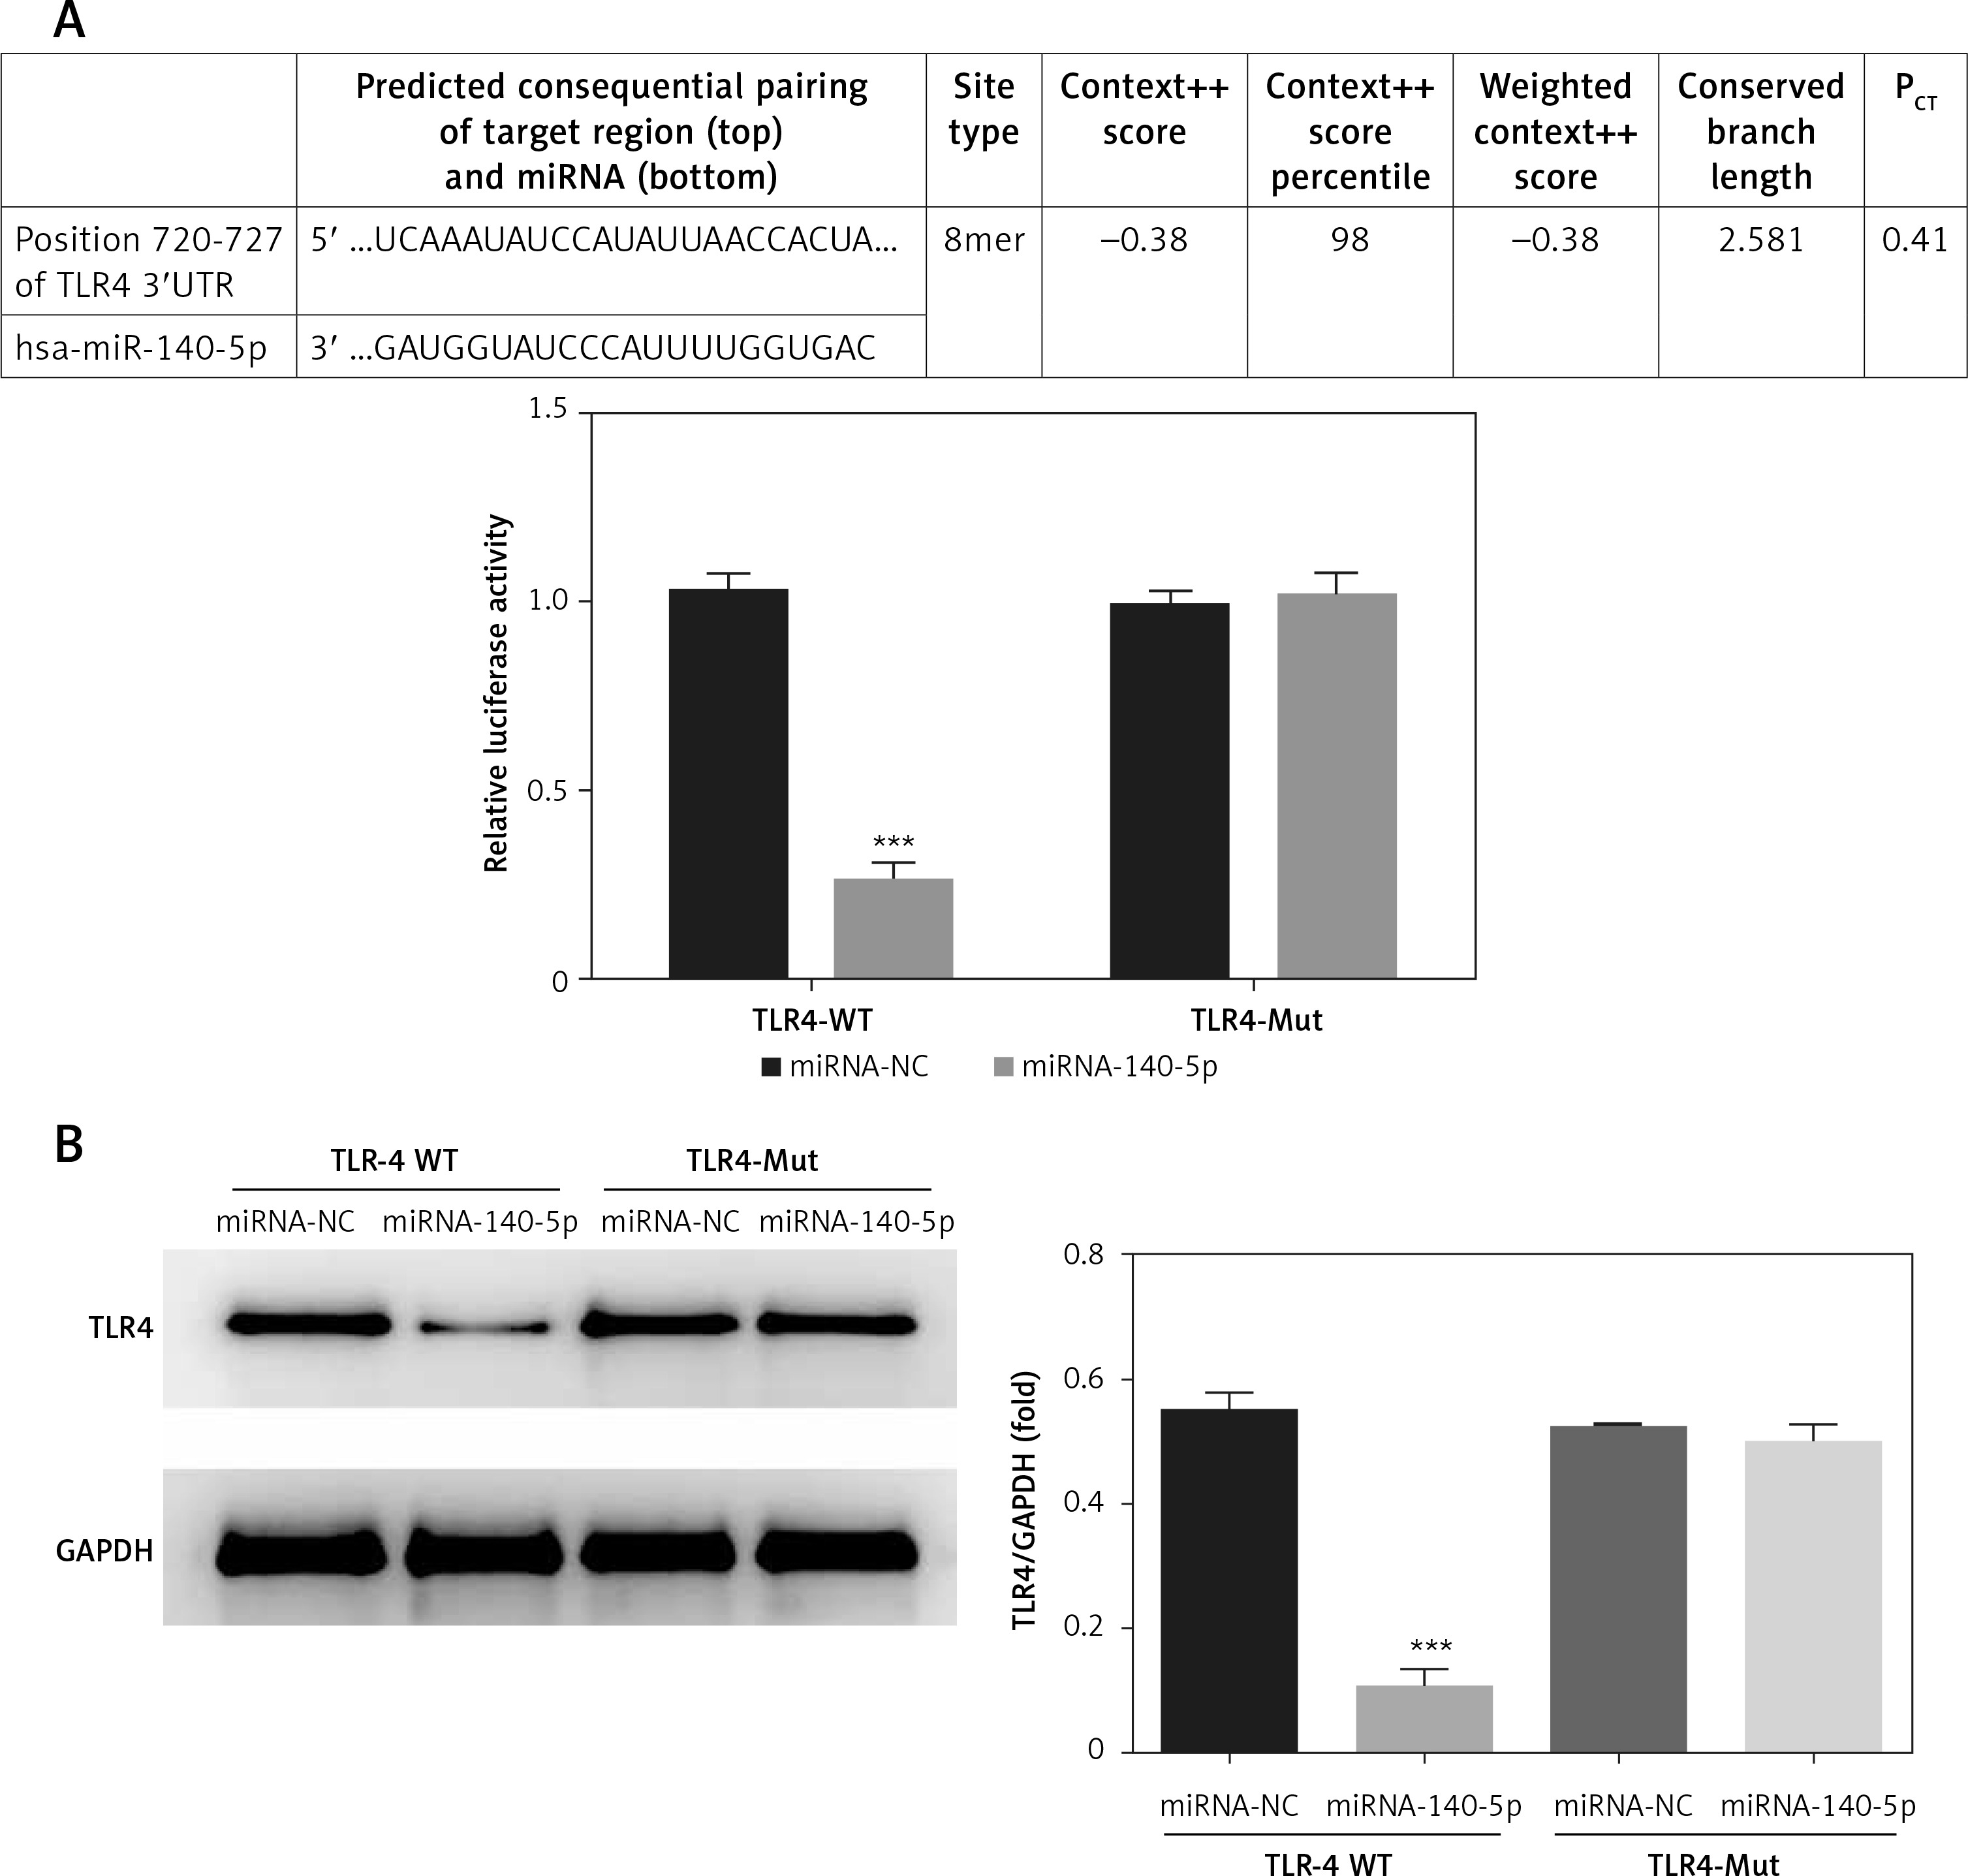
Analysis on correlation between miRNA-140-5p and TLR4
According to results presented in Figure 11 A, miRNA-140-5p is capable of performing targeted inhibition on TLR4 mRNA expression levels in TDSCs where TLR4 is normally expressed (p < 0.001, Figure 11 A). TLR4 protein was also validated by means of WB and the corresponding results are presented in Figure 11 B. They signify that miRNA-140-5p has the capability to effectively inhibit TLR4 after transfection (p < 0.001).
Figure 11
Analysis of correlation between miRNA-140-5p and TLR4. miRNA-140-5p – the cell containing TLR4-WT or TLR4-Mul were transfected with miRNA-140-5p mimics; miRNA-NC – the cell contained TLR4-WT or TLR4-Mul were transfected with miRNA-NC (negative control); TLR4-WT – TLR4-wild type; TLR4-Mut – TLR4-mutation. A – the correlation between miRNA-140-5p and TLR4 by Double Luciferase Report assay. ***P < 0.001, compared with miRNA-NC. B – TLR4 protein expression in different groups by WB assay. ***P < 0.001, compared with miRNA-NC
Discussions
Due to tendon overuse or degradation with age, different degrees of acute and chronic tendon injuries may be caused. Moreover, chronic tendinopathy shows a sharp increase as human beings grow old. According to relevant surveys, 13% of the aged are attacked by tendinopathy among the population from 50 to 59 years old; and regarding another two groups of the elderly who are 60–69 and 70–79 years old respectively, such a proportion rises to 20% and 31% [13, 14]. Considering that repaired tendons are usually scar tissues of an abnormal structure and poor mechanical properties, it is rather likely for them to rupture again. For example, 40% of post-operative patients suffer tendon rupture once again [15]. Meanwhile, problems such as adhesion and strength reduction may be found among repaired tendons that have been injured. Therefore, treatment of damaged tendons seems to be extremely important. Traditional tendon therapies mainly include currently used physical therapies, non-steroidal anti-inflammatory drugs (NSAIDs) and glucocorticoids [16–18]. However, their therapeutic effects are rather poor and their toxic and side effects may be rather serious. Consequently, there is some controversy over the use of these therapies.
In the later period of tendon healing, TGF-β1 overexpression facilitates ECM oversynthesis, which further gives rise to tendon adhesion, hyperfibrosis and the formation of many scar tissues. Great morphological and functional differences can be found between such scar tissues and normal tendon cells. These pericellular matrices are generally poorly structured and are in chaos in terms of their levels. The reason why such abnormal tissue remodeling results are generated is to increase a cross section of tendons. Although their strength can be slightly improved, the function and hardness are still very poor. Subsequent to breakage and reunion of flexor tendons of hands, their scar tissues may be twined with flexor tendon sheaths. Consequently, a severe adverse influence may be placed on hand functions. As pointed out by Riessen et al. through their experiments [19], TGF-β1 is able to directly activate gene expression levels of COMP/TSP-5, which plays a role of adhesion so as to incur tendon adhesion. In the opinion of Davies et al. [20], TGF-β1 pathways are involved in pathological fibrosis and apoptosis of multiple organs and tissues; and, in the progression of them, such pathways play an essential role. Here, TGF-β1 was selected to induce primary TDSCs; on this basis, a cell model was constructed for tendinopathy. It has been demonstrated by relevant results that levels of Hyp as a fibrosis marker and the apoptosis rate of TDSCs apparently go up in the Model group. Such a phenomenon indicates that we have gained success in modeling cells of the tendinopathy by virtue of TGF-β1.
The toll like receptor 4 (TLR4) signaling pathway also exerts a critical effect on inflammatory responses. TGF-β1 overexpression first results in TLR4/NF-κB signaling pathway activation. Furthermore, this may bring about increasing fibrosis and apoptosis [21–23]. As proven by experiments in this study, due to stimulation from TGF-β1, TLR4/MyD88/NF-κB(p65) signaling pathway activation takes place and amounts of MyD88 and NF-κB(p65) that are transported to the nucleus increase. Maybe, an increase in apoptosis rates and fibrosis degrees of TDSCs is a mechanism that leads to occurrence of tendinopathy. Moreover, it is also found by inhibiting TLR4 expression levels that apoptosis rates and fibrosis degrees of TDSCs decline. Therefore, it is inferred that TLR4 knock-down has the potential to effectively prevent tendinopathy from further deterioration.
miRNA is micro RNA that widely exists in the body. After combining a specific target, it begins to play a critical role in various physiological and pathological processes by firstly affecting its transcription [24]. As an important type of miRNA, miRNA-140-5p is closely related to innate immune responses, inflammatory responses and virus infections, etc., in the body. Besides, miRNA-140-5p can also perform targeted regulation of TLR4 [9, 12]. Nevertheless, we are still unclear about the roles and importance of miRNA-140-5p in tendinopathy. In this study, it has been found through RT-qPCR detection that miRNA-140-5p expression levels significantly decrease according to the cell model of tendinopathy; and after miRNA-140-5p is transferred to TDSCs, not only is their multiplication capacity remarkably recovered, but their fibrosis levels are also improved to a certain extent.
In conclusion, it can be seen miRNA-140-5p overexpression can inhibit activity of MyD88 and downstream NF-κB(p65) by target regulation on TLR4, thereby lowering inflammatory factor expression levels, apoptosis rates and fibrosis levels of TDSCs and eventually improving tendinopathy. On this basis, it is deduced that miRNA-140-5p may be used as a potential target to treat and improve tendinopathy.