Introduction
Chronic lymphocytic leukemia (CLL) is a serious disease of inherent immune dysfunction, which is the major type of adult leukemia in the western world. The defect in cell apoptosis and proliferation causes accumulation of leukemic cells, which was a typical characteristic of CLL [1]. This disease has a high incidence in North America and among elderly people, especially those more than 72 years old [2]. The clinical course of CLL is remarkably heterogeneous. Some patients need no treatment, while some patients die rapidly [3]. Patients with CLL are more likely to suffer from chronic infections, which lead to 50–60% of all deaths [4]. With the advances in therapeutic strategies, the relative 5-year survival rate rose from 67.5% in 1975 to 87.9% in 2007 [5], but drug resistance was still a formidable obstacle for some patients [6]. Novel drug treatment strategies for CLL have shifted their focus from nonspecific chemo-immunotherapy agents with potential side effects to more specific drugs with maximal efficacy and minimal toxicity [7]. Thus, there is a necessity to elucidate the underlying mechanism of CLL and offer a better therapy target for long-term treatments.
The balance between cell proliferation and cell apoptosis is essential for health. It has been widely recognized that tumor formation is a result of abnormal cell accumulation. Chronic lymphocytic leukemia is a malignant hematologic tumor due to the accumulation of abnormal monoclonal mature B lymphocytes [8]. Thus, inhibiting cell proliferation and promoting apoptosis are the common strategies for cancer prevention and treatment. Furthermore, CLL neoplastic cells can easily circulate through peripheral blood and secondary lymphoid organs, whereby the tumor metastasizes [9]. Distant metastasis often shortens the patient’s survival. Therefore, inhibition of tumor cell proliferation and invasion was essential for better outcome of CLL patients.
The premises for a transcription factor to be a potential therapeutic target in CLL are as follows. First, it should be overexpressed in CLL, and then its oncogenic mechanisms should be well elucidated in other tumors. Signal transducer and activator of transcription 3 (STAT3) is one of the transcription factors which meet these criteria as a potential therapeutic target in CLL. STAT3 was highly expressed in many cancers and was found to positively regulate neoplastic cell survival and proliferation, tumor angiogenesis, migration [10, 11]. Thus, STAT3 played a pivotal role in cancer initiation and progression [12]. The JAK/STAT3 signaling pathway was activated in various cells, thus leading to cell accumulation. Additionally, STAT3 has opposing impacts on inflammation, which means that it may influence the tumor microenvironment to facilitate tumor progression. Several solid tumors, hematologic malignancies and some tumor cells have found STAT3 constitutive phosphorylation on tyrosine residues [13]. Over-activated STAT3 facilitated tumor growth and deletion of it prevented many epithelial cancers [14] and hematologic tumors [15]. In CLL, STAT3 is constitutively phosphorylated on serine 727 residues and facilitates CLL cell survival [16]. Recently, some researchers found that STAT3 knockdown significantly decreased the production of IL-10 in CLL cells, thus leading to immunodeficiency in patients [17]. From these observations we can easily assume that STAT3 contributed to CLL initiation and progression, but the underlying pathways have not been interpreted in detail.
Recently, it has been accepted that dysregulation of histone methylation has an impact on tumorigenesis. SET and MYND domain-containing protein 3 (SMYD3), as one member of the SMYD family, is a histone methyltransferase which participates in various pathological processes and can promote many cancers’ formation and progression by activating target gene transcription [18]. SMYD3 was associated with epithelial-mesenchymal transition (EMT), cell proliferation and oncogene activation [19]. Overexpression of SMYD3 has been implicated in many cancers, such as colorectal carcinoma, hepatocellular carcinoma, and breast cancer, suggesting a carcinogenic role of SMYD3 [18, 20]. In human hepatocellular carcinoma (HCC), the expression of SMYD3 was negatively related to overall survival, new tumor occurrence, tumor grade and chemical drug resistance, suggesting the prognostic value of SMYD3 in HCC [19]. But the association between SMYD3 and CLL has not been fully investigated.
This study was performed to gain insights into the role of STAT3 and SMYD3 in CLL. We first detected the mRNA and protein expression of STAT3 in CLL neoplastic cells and cancerous cell lines, and then conducted cell transfection to knock down or overexpress specific proteins to elucidate the correlation between STAT3 and SMYD3. Furthermore, the effects of STAT3 reduction and SMYD3 overexpression on cell proliferation and invasion were investigated in two cancer cell lines, MEC1 and CCL. Our present data suggest that STAT3 can up-regulate SMYD3 to promote chronic lymphocytic leukemia cell proliferation and invasion.
Material and methods
Collection of chronic lymphocytic leukemia patients’ samples
Inclusion and exclusion criteria for chronic lymphocytic leukemia patients: All patients were clinically diagnosed with chronic lymphocytic leukemia and had not received any treatment. Written informed consent was obtained from all volunteers. Sample cells were harvested and isolated from peripheral blood cells of 77 chronic lymphocytic leukemia patients and 77 normal volunteers. Magnetic cell sorting (MACS) of Lymphoprep-separated buffy coats with MACS CD19 Microbeads (Miltenyi Biotec, Bergisch Gladbach, Germany) were applied to isolated different cells. All experiments were performed in accordance with the guidelines approved by Beijing University of Chinese Medicine Affiliated Dongzhimen Hospital and were done according to the principles of the Declaration of Helsinki.
Cell culture
The human chronic lymphocytic leukemia cancerous cell lines MEC1 (17p deletion) and CCL were obtained from American Type Culture Collection (ATCC) and maintained with DMEM (Gibco, USA) growth medium containing 10% fetal bovine serum (FBS) (HyClone) in culture flasks. Cells were incubated at 37°C with 5% CO2 in air.
Quantitative real-time PCR (RT-qPCR)
The RNAs (1 μg per sample) were extracted with TRIZOL reagent and isolated from patients’ neoplastic B cells, normal volunteers’ B cells and cancerous cell lines after specific treatments. After being generated with M-MLV reverse transcriptase (Invitrogen), cDNAs were used and incubated with SYBR Green reagents (Roche) and specific primers (Table I) following the manufacturer’s instructions. GAPDH was used as an internal control. StepOne Software v2.1 (Applied Biosystems) was used to detect the cycle threshold (Ct) values. The expression level of the target genes relative to GAPDH was calculated as 2–ΔΔCT.
Western blot analysis
Cells were homogenized on ice in cell lysis buffer (Cell Signaling Technology, USA) containing proteinase inhibitor cocktail and phosphatase inhibitors. After being centrifuged at 14 000 × g for 15 min, the protein supernatant was determined with a Bio-Rad DC protein assay kit (Bio-Rad Laboratories). Samples containing 100 μg of protein and SDS-PAGE loading buffer with 4% β-mercaptoethanol were heated at 100°C for 7 min and then loaded on a 10% polyacrylamide gel. After electrophoretic transfer to nitrocellulose membranes, membranes were incubated with anti-STAT3 or anti-SMYD3 or GAPDH antibodies at 4°C overnight. Then membranes were washed 3 times with wash buffer and incubated with secondary antibody conjugated with peroxidase for an hour. The signal was detected by chemiluminescence using the ECL-Plus detection system (PerkinElmer Life Sciences). All antibodies for western blot were obtained from Abcam (Cambridge, MA, USA).
Cell transfection
Small interfering RNAs (siRNAs) for human STAT3 and pcDNA3.1-SMYD3 plasmid were purchased from Gene Pharma in Shanghai, China. siRNA sequences are presented in Table II. For transfections, cells were plated in 6-well plates at a concentration of 1 × 10⁷/ml. After 24 h, cells were transfected with siRNA or plasmid using Lipofectamine 3000 (Life Technology, MD, USA) according to the manufacturer’s instructions. The mRNA and protein levels were assessed 48 h later.
Luciferase reporter assay
Cells were maintained in 24-well plates and were transfected with siRNA-STAT3 for a certain period. A Renilla luciferase-containing plasmid, which is driven by a thymidine kinase promoter, was taken as a transfection efficiency internal control. A dual luciferase reporter assay system was used to determine luciferase activity following the manufacturer’s instructions (Promega, Madison, WI).
Chromatin immunoprecipitation
A chromatin immunoprecipitation (ChIP) assay kit (Millipore) was employed following the manufacturer’s manual. Cells were plated at a density of 1 × 10⁷ cells/100-mm petri dish for 2 days in GM. After 1% formaldehyde was added to the medium, the cells were removed and suspended in a cell-lysis buffer. After centrifugation, the resulting cell pellet was resuspended in a nuclear-lysis buffer for 10 min. The sample was then sonicated to produce DNA fragments at lengths of 200–600 bp, followed by incubation with anti-SMYD3 antibodies (or IgG) and protein A/G magnetic beads at 4°C overnight. DNA-protein complexes were collected and treated with proteinase K at 62°C for 2 h. After DNA purification, the DNA fragments that potentially interacted with SMYD3 were analyzed by RT-qPCR using specific primers. IgG was used as a negative control.
Invasion assay
Cell invasion ability was detected using a 24-well Transwell chamber with an 8 μm pore (Costar), and the inserts were coated with 20 μl Matrigel (1 : 3 dilution, BD Bioscience). After transfection for 48 h, cells were collected, transferred to the upper Matrigel chamber in a 100 μl serum-free medium containing 3 × 10⁵ cells, and incubated for 18 h. A medium supplemented with 10% FBS was added to the lower chamber as the chemoattractant. Then, the non-invading cells on the upper membrane surface were removed with a cotton tip, and the cells that passed through the filter were fixed in 4% paraformaldehyde and then stained with hematoxylin.
MTT cell growth assay
Cell proliferation was determined with an MTT colorimetric assay. Cells were seeded in multi-well plates in a concentration of 5 × 10³ per well for all cell lines using DMEM medium containing 10% FBS. After transfection for 20, 44, and 68 h, MTT solution (5 mg/ml, Sigma) was added to each well and continually cultivated for another 4 h, followed by incubation with 10% sodium dodecyl sulfate (SDS) in 0.01N HCl overnight at 37°C. Absorbance was measured at 490 nm using an ELISA plate reader.
Statistical analysis
All experiments were repeated three times and data were analyzed with GraphPad prism 6. Data were expressed as means ± SD. One-way ANOVA was used to compare means in different experimental groups and Turkey’s test was used for multiple comparison. Differences are considered statistically significant at p < 0.05.
Results
STAT3 and SMYD3 were highly expressed in both chronic lymphocytic leukemia tumor samples and cell lines
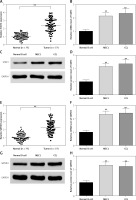
The neoplastic B cells from chronic lymphocytic leukemia patients and normal volunteers’ B cells were collected and detected for STAT3 mRNA expression. As shown in Figure 1, the mRNA level of STAT3 (Figure 1 A, p = 0.0045) and SMYD3 (Figure 1 E, p = 0.0034) was dramatically elevated in sample cells compared with normal volunteers’ B cells. The clinicopathological features of CLL patients are presented in Table III. We found that chromosome abnormalities were detected in 59 of 77 (76.6%) CLL patients by molecular cytogenetics (FISH) and G-banding cytogenetic analysis. 13q14 deletion (16.9%) was the most common finding followed by 17p13 deletion (13.0%) and trisomy 12 (7.8%). 11q23 deletion (6.5%) was also detected, as were several less frequent chromosome abnormalities. Consistently, the mRNA expression of STAT3 (Figure 1 B, p = 0.0057, p = 0.0049) and SMYD3 (Figure 1 F, p = 0.0048, p = 0.0046) in two cancerous cell lines, MEC1 and CLL, was significantly higher than in normal B cells. Moreover, the protein expression of STAT3 was determined by western blotting and normalized with GAPDH. Compared with normal B cells, protein levels of STAT3 (Figures 1 C and D, p = 0.0061, p = 0.0058) and SMYD3 (Figures 1 G and H, p = 0.0055, p = 0.0060) in MEC1 and CLL both were increased significantly. Collectively, these data suggested that STAT3 and SMYD3 are highly expressed in chronic lymphocytic leukemia and may play an important role in its evolution and progression.
Table III
Clinicopathological characteristics of CLL patients
Figure 1
Expression of STAT3 and SMYD3 was up-regulated in chronic lymphocytic leukemia and cancerous cell lines. The mRNA expression level of STAT3 (A) and SMYD3 (E) was detected in chronic lymphocytic leukemia patients’ sample cells and normal volunteers’ B cells by RT-qPCR analysis. **Represents p < 0.01, compared with normal volunteers’ B cells. The mRNA expression level of STAT3 (B) and SMYD3 (F) was detected by RT-qPCR in MEC1 and CCL cancerous cell lines. The protein expression level of STAT3 (C, D) and SMYD3 (G, H) was detected by western blot analysis. Data are means ± SD. **Represents p < 0.01, compared with normal B cells
Positive feedback regulation relationship between STAT3 and SMYD3
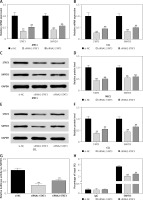
To investigate the effect of down-regulating STAT3 on the expression of SMYD3, we used two small interfering RNAs (siRNA1-STAT3, siRNA2-STAT3) to knock down the mRNA expression of STAT3 in two cancerous cell lines. After transfection, the STAT3 mRNA expression in the MEC1 cell line was dramatically decreased by about 70% for siRNA1-STAT3 (p = 0.0037) and 50% for siRNA2-STAT3 (p = 0.0044) (Figure 2 A). Accordingly, SMYD3 mRNA in MEC1 was respectively decreased to 40% (p = 0.0042) and 56% (p = 0.0048). The protein level was also detected; it showed a 50–60% reduction for STAT3, and a 40–45% reduction for SMYD3 (Figures 2 C, D) (p < 0.01). The same transfection was conducted in the CCL cell line. The mRNA and protein expression of STAT3 were similarly changed in CCL after transfection, and the reduction was slightly stronger than that for MEC1, suggesting a better effect for transfection. With the reduction of STAT3, mRNA and protein expression of SMYD3 were decreased by approximately a half (Figures 2 B, E, F) (p < 0.01). To verify the relationship between STAT3 and SMYD3, a luciferase reporter assay and a ChIP assay were performed after transfection. As Figure 2 G shows, the relative luciferase activity of SMYD3 was dramatically decreased in both transfection groups compared with the negative control group (si-NC), and the siRNA1-STAT3 group showed a better reduction. As Figure 2 H suggests, compared with IgG (as a base level control), SMYD3 expression was obviously higher than IgG. After STAT3 siRNA transfection, SMYD3 expression was significantly reduced and siRNA1 showed a better inhibition effect on SMYD3 (p = 0.0051). Collectively, these data showed that STAT3 may increase the oncogene SMYD3 to promote chronic lymphocyte leukemia progression. Figure 2 indicates that low expressed STAT3 suppressed the expression of SMYD3.
Figure 2
Knockdown of STAT3 restrained expression of SMYD3. Cells were plated into multi-well plates and divided into 3 groups to apply different transfection. si-NC group represents transfection with scramble siRNA, siRNA1-STAT3 group transfection with siRNA1- STAT3, siRNA2-STAT3 group transfection with siRNA2- STAT3. A – mRNA expression of STAT3 and SMYD3 in MEC1 cell line was detected by RT-qPCR. B – mRNA expression of STAT3 and SMYD3 in CCL cell line was detected by RT-qPCR. C, D – Protein expression of STAT3 and SMYD3 in MEC1 cell line was detected by western blotting. E, F – Protein expression of STAT3 and SMYD3 in CCL cell line was detected by western blotting. G – mRNA correlation between STAT3 and SMYD3 was investigated through luciferase reporter experiment. H – Protein correlation between STAT3 and SMYD3 was investigated through co-immunoprecipitation experiment. Normalized by IgG
Data are means ± SD. **P < 0.01, compared with si-NC group.
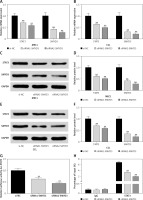
Then we used two small interfering RNAs (siRNA1-SMYD3, siRNA2-SMYD3) to knock down the mRNA expression of SMYD3 in two cancerous cell lines to investigate the effect of down-regulating SMYD3 on the expression of STAT3, and repeated the above experiment. All the results are shown in Figure 3, which indicates that low expressed SMYD3 suppressed the expression of STAT3. Hence, we concluded that there was a positive regulation relationship between STAT3 and SMYD3.
Figure 3
Knockdown of SMYD3 restrained expression of STAT3. Cells were plated into multi-well plates and divided into 3 groups to apply different transfection. si-NC group represents transfection with scramble siRNA, siRNA1-SMYD3 group transfection with siRNA1- SMYD3, siRNA2-SMYD3 group transfection with siRNA2-SMYD3. A – mRNA expression of STAT3 and SMYD3 in MEC1 cell line was detected by RT-qPCR. B – mRNA expression of STAT3 and SMYD3 in CCL cell line was detected by RT-qPCR. C, D – protein expression of STAT3 and SMYD3 in MEC1 cell line was detected by western blotting. E, F – Protein expression of STAT3 and SMYD3 in CCL cell line was detected by western blotting. G – mRNA correlation between STAT3 and SMYD3 was investigated through luciferase reporter experiment. H – Protein correlation between STAT3 and SMYD3 was investigated through co-immunoprecipitation experiment. Normalized by IgG
Data are means ± SD. **P < 0.01, compared with si-NC group.
STAT3 promoted cell proliferation in chronic lymphocytic leukemia through increasing SMYD3 expression
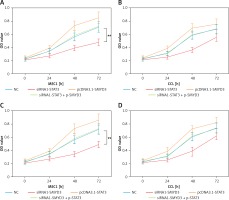
In order to determine whether STAT3 promotes cell proliferation through targeting SMYD3, we designed two sets of experiments. In the first set of experiments, the results of which are shown in Figure 4, we used siRNA1-STAT3 to reduce SMYD3 expression and the pcDNA3.1-SMYD3 plasmid for SMYD3 overexpression, siRNA1-SMYD3 to reduce SMYD3 expression and the pcDNA3.1-STAT3 plasmid for SMYD3 overexpression. Then an MTT assay was performed to determine cell proliferation in MEC1 and CCL. We found that cell proliferation in MEC1 was strongly inhibited when SMYD3 was decreased by STAT3 reduction, and was increased with SMYD3 overexpression. When siRNA1-STAT3 transfection combined with SMYD3 overexpression, cell proliferation could be restored and little difference was observed compared with the negative control (Figure 4 A) (p = 0.0072). MTT assay results in CCL showed a similar effect to that in MEC1, though the inhibition or elevation had no significance (Figure 4 B). Figures 4 C and D indicate that up-regulating STAT3 significantly increased cell proliferation but it was attenuated by adding siRNA-SMYD3 (p = 0.0061). Taken together, these data showed that STAT3 promoted cell proliferation in chronic lymphocytic leukemia through increasing SMYD3 expression.
Figure 4
SMYD3 promoted cell proliferation in MEC1 and CCL cancerous cells through increasing STAT3 expression. Cells were plated into multi-well plates and divided into four groups to apply four different treatments: NC group, negative control, STAT3 knockdown group, indicating transfection with siRNA1-STAT3, SMYD3 overexpression group, indicating transfection with pcDNA3.1-SMYD3 vectors and combination group, indicating transfection with siRNA-STAT3 and pcDNA3.1-SMYD3. A – Cell viability was detected in MEC1 cell line by MTT assay. B – Cell viability was detected in CCL cell line by MTT assay. C – Cell viability was detected in MEC1 cell line by MTT assay. D – Cell viability was detected in CCL cell line by MTT assay (B)
STAT3 promoted invasion in chronic lymphocytic leukemia through increasing SMYD3 expression
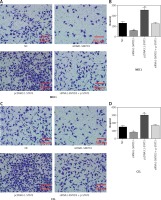
Transwell assays were performed to detect cell invasion ability changes after applying identical transfection treatments to MEC1 and CLL cell lines also in two sets of experiments as mentioned above. We found that the invasion ability of MEC1 was significantly restrained by STAT3 down-regulation (p = 0.0083), while it was dramatically facilitated by SMYD3 overexpression compared with the NC group (p = 0.0039). Also, the invasion ability of MEC1 remained at its original level when the combination of siRNA1-STAT3 and pcDNA3.1-SMYD3 was used (Figures 5 A, B). In CLL, STAT3 low expression correlated with inhibition of invasion, while SMYD3 high expression was related to acceleration of invasion. Not surprisingly, when these two treatments were combined, the invasion rate returned to the NC level (Figures 5 C, D). Figure 6 indicated that up-regulating STAT3 significantly increased cell invasion in these two cell lines, but was restored to the NC level by adding siRNA-SMYD3. Altogether, these data suggested that STAT3 may accelerate invasion ability through upregulating SMYD3 expression.
Figure 5
SMYD3 promoted invasion in MEC1 and CCL cancerous cells through increasing STAT3 expression. Cells were plated into multi-well transwell plates and divided into four groups to apply four different treatments: NC group, negative control, STAT3 knockdown group, indicating transfection with siRNA1-STAT3, SMYD3 overexpression group, indicating transfection with pcDNA3.1-SMYD3 vectors and combination group, indicating transfection with siRNA-STAT3 and pcDNA3.1-SMYD3. A, B – Cell invasion ability of MEC1 was investigated in different transfection groups. C, D – Cell invasion ability of CCL was investigated in different transfection groups
Data are means ± SD. **P < 0.01, compared with NC group.
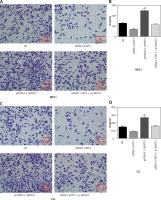
Figure 6
STAT3 promoted invasion in MEC1 and CCL cancerous cells through increasing SMYD3 expression. Cells were plated into multi-well transwell plates and divided into four groups to apply four different treatments: NC group, negative control, SMYD3 knockdown group, indicating transfection with siRNA1-SMYD3, STAT3 overexpression group, indicating transfection with pcDNA3.1-STAT3 vectors and combination group, indicating transfection with siRNA-SMYD3 and pcDNA3.1-STAT3. A, B – Cell invasion ability of MEC1 was investigated in different transfection groups. C, D – Cell invasion ability of CCL was investigated in different transfection groups
Data are means ± SD. **P < 0.01, compared with NC group.
Discussion
In the samples from CLL patients, STAT3 was highly expressed compared with the normal volunteers’ B cells, indicating that STAT3 may play a role in CLL evolution. In vitro, we found that reduced STAT3 expression attenuated the cell proliferation and inhibited invasion in cancer cell lines MEC1 and CLL. The reduced expression of oncogenic SMYD3 was closely related to STAT3 knockdown. Liu et al. reported that overexpression of SMYD3 was associated with increased STAT3 activation in gastric cancer [21], and Sarris et al. found that in liver and colon SMYD3 functions in the nucleus, stimulating the transcription of several key regulators involved in cell proliferation, epithelial-mesenchymal transition, and the JAK/Stat3 oncogenic pathway [19]. Thus we speculated that the regulation by STAT3 of cell proliferation and invasion may depend on oncogenic SMYD3. While SMYD3 overexpression dramatically facilitated cell proliferation and invasion, the combination of STAT3 reduction and SMYD3 overexpression restored the cell function back to the basic level, perfectly certifying the assumption. Collectively, our study suggests that STAT3 can promote chronic lymphocytic leukemia progression through up-regulated oncogenic SMYD3 expression.
It has been demonstrated frequently that STAT3 participated in numerous cancers including both solid and hematologic tumors [22]. STAT3 is involved in inflammation and signal initiation. Activated STAT3 protein translocates into the nucleus to regulate gene transcription [23]. In CLL, STAT3 is constitutively and exclusively phosphorylated [16, 24, 25], but the downstream signal pathways related to its function remain unknown. Doshi et al. reported that STAT3 may mediate C6-ceramide-induced cell death in CLL [26]. More research suggested that STAT3 intertwined with NF-kB to promote CLL inflammation [27]. Rozovski et al. [28] found that the JAK/STAT3 signaling pathway was activated in CLL through B-cell receptor stimulation, then anti-apoptotic signals were activated. When STAT3 expression levels were sufficiently high, STAT3 could also activate pro-apoptotic mechanisms and induce cell apoptosis in CLL [29]. Except for apoptosis, STAT3 activation was found to regulate every step of cancer metastasis [30]. One of the key steps in tumor metastasis is invasion to the extracellular matrix, which was regulated by the matrix metalloproteinases (MMPs). Not surprisingly, STAT3 has a crucial impact on this complex process. In a pancreatic cancer model, using siRNA to knock down STAT3 expression significantly reduced cell invasiveness and MMP-7 expression in nude mice [31]. Consistently, our data showed that the knockdown of STAT3 attenuated MEC1 and CLL cell proliferative and invasion ability, verifying the tumor promotion role of STAT3.
A direct functional relationship between SMYD3 and cell proliferation and invasion in CLL has been found in this study. Many studies have revealed that Smyd3 protein was recruited together with trimethylated H3K4 histone tails to active gene regulatory regions and act as an important transcriptional potentiator. In hepatic cancer cells, Smyd3 regulated cancer-related nuclear processes, through activating oncogenes or potentiating transcription of cancer-promoting genes [19]. While some oncogenic transcription factors, such as Myc and stat3 were regulated by Smyd3, Smyd3 inactivation inhibited cancer formation by attenuating cell proliferation in HCC. Interestingly, our data revealed that SMYD3 was elevated by STAT3 in CLL cancer cell lines MEC1 and CCL, which suggested an intimate relationship between these two oncogenic genes. When STAT3 mRNA expression was knocked down by small interfering RNA transfection, cell proliferation was suppressed and invasion ability was restrained. In contrast, when SMYD3 was overexpressed by plasmid transfection, the proliferation and invasion ability were dramatically facilitated. Intriguingly, we found that SMYD3 overexpression can equilibrate the declination of STAT3. Cell function determination of proliferation and invasion showed consistent results. Thus, there may be an interaction between STAT3 and SMYD3 which needs further investigation.
This study was a superficial exploration of the relationship between STAT3 and SMYD3 and the results were limited. We did not investigate the role of STAT3 or SMYD3 in patients’ prognosis due to the lack of follow-up data. Furthermore, we did not interpret the involved upstream or downstream elements in this pathway, and there may be some unknown intermediate targets. More experiments are required to elucidate their interaction. Also clinical trials are required to determine whether the STAT3-SMYD3 pathway can be a potential target for therapy.
In conclusion, we identified that STAT3 promoted chronic lymphocytic leukemia cell lines’ proliferation and invasion ability by inducing oncogenic SMYD3 expression. We speculated that the induction of STAT3 to SMYD3 in CLL may lead to a poor prognosis in CLL cancer. Targeting STAT3-SMYD3 may be a potential strategy for CLL treatment.


