Introduction
Polycystic ovary syndrome (PCOS) is the most common endocrine disorder in an-ovulatory infertile women with a prevalence of up to 75% in this population [1]. Polycystic ovary syndrome is characterized by oligomenorrhea/anovulation, clinical and/or biochemical hyperandrogenism and polycystic ovaries [2].
Polycystic ovary syndrome is a multifactorial disease. Differential genetic and epigenetic alterations of several genes in various tissues and cell types have been identified as important factors in the etiopathogenesis of this syndrome [3, 4]. Although its exact etiology is poorly understood, some evidence suggests that epigenetic factors are associated with the molecular features underlying PCOS [5]. A variety of factors have been demonstrated to cause epigenetic changes that compromise normal follicular development in PCOS, such as environment, diet, and hyperandrogenism [4].
In PCOS, due to an imbalance in luteinizing hormone (LH), follicle-stimulating hormone (FSH) and some factors involved in the inappropriate progression of folliculogenesis, development of the follicle toward the dominant stage becomes arrested [6]. Changes in gene expression in granulosa and cumulus cells, which surround the oocyte, are one of the main contributing factors associated with polycystic ovaries [6–8]. Previous studies showed that epigenetic changes play a definite role in the steroidogenic activity in both cells in response to FSH. These aberrations are the main feature of impaired maturation of antral follicles to their later-stage development [9]. On the other hand, human CC gene expression could direct oocyte developmental competence or non-invasively be used to predict the embryo development [10, 11]. Of essential roles of granulosa-cumulus cells, related to steroidogenesis and the subsequent follicular selection and development, is estradiol (E2) production from androgen precursors which is catalyzed by the enzyme aromatase [12]. CYP19A1 (aromatase coding gene) is well identified to be regulated in a very pronounced tissue-specific manner through ten promoters that are alternatively used in different cell types [13, 14]. Aromatase mRNA is predominantly expressed in the ovarian cell under the control of PII promoter. Also, PI.3 and PI.4 promoters are two regulators of aromatase expression in these cells, although to a lesser extent [15]. Several studies have reported that aromatase gene expression and consequent estradiol production are reduced in preovulatory PCOS follicles compared to healthy controls [4, 16].
Inter- and intracellular regulatory mechanisms regulate the CYP19A1 gene expression in ovarian cells by multiple factors, including estrogen receptors (mainly estrogen receptor β) and epigenetic modifications that are induced by FSH [17]. In this study the global histone methylation and acetylation levels of PCOS cumulus cells and epigenetic alterations in cumulus cells that are involved in the ovarian aromatase expression in infertile PCOS undergoing control ovarian stimulation (COS) cycles were investigated.
MATERIAL AND METHODS
Ethical approval
This cross-sectional study was approved by the Iran University of Medical Sciences Ethics Committee and Royan Institute (IUMS, No: 23108-April 2014). All the patients had signed the informed consent before undergoing the treatment.
Patient history
Twenty-four patients (12 women with PCOS and 12 normo-ovulatory patients) who underwent ovarian stimulation for in vitro fertilization (IVF)/intracytoplasmic sperm injection (ICSI) were recruited for the study between November 2014 and April 2015 at the ART Centre of the Royan Institute, Iran.
The diagnosis of PCOS phenotype was based on the three following Rotterdam diagnostic criteria: (I) chronic oligo and/or anovulation (cycle length < 26 days or > 35 days) (II) clinical hyperandrogenism (presence of hirsutism evaluated by a Ferriman-Gallwey score > 8, severe acne and alopecia) and biochemical hyperandrogenism (total testosterone concentration > 0.5 ng/ml) and (III) polycystic ovaries on ultrasound (defined as the presence of 12 or more ovarian cysts with 2–10 mm diameter per ovary and/or ovarian volume ≥ 10 cm3) [2]. Women with hypothalamic amenorrhea, hyperprolactinemia, Cushing’s syndrome and thyroid dysfunction were detected via hormonal tests and excluded from the study. For homogenization of patients recruited to the study, only PCOS patients with phenotype A (the coexistence of chronic anovulation, hyperandrogenism, and polycystic ovaries) were selected.
All patients had the following inclusion criteria: the first IVF/ICSI cycle, antagonist protocol for ovarian hyperstimulation, age ≤ 38 years and body mass index (BMI) of 18–28 kg/m2.
The control group was the oocyte donor patients who had no clinical or biochemical signs of hyperandrogenism or polycystic ovaries, regular menstrual cycles, normal hormone profile (FSH, LH, and thyroid-stimulating hormone – TSH) and no diabetes. Infertile couples with severe male factor infertility (oligo-terato-asthenozoospermia, frozen and surgically retrieved sperm) were excluded from the study. Semen analysis was performed according to the World Health Organization (WHO) criteria (5th edition).
All the hormonal (FSH and LH) assays were performed on days 2–3 of the menstrual cycle in the Royan Institute laboratory. Further evaluation in PCOS patients was performed by measurement of total testosterone concentrations by the ELISA kits (Monobind Inc., USA). The FSH and LH concentrations were assessed using electro-chemiluminescence immunoassay kits (ECLIA kits, Roche Diagnostics GmbH, Germany).
Control ovarian stimulation (COS) protocol
All PCOS patients and the control group underwent pituitary down-regulation with the GnRH antagonist protocol. COS was performed with 75–150 IU of recombinant FSH (Gonal F; Merck Serono, or Puregon; MSD, the Netherlands) considering the antral follicle count (AFC) and the women’s age and continued until the day of human chorionic gonadotropin (hCG) (Ovitrelle, Merck-Serono) administration according to ovarian response. GnRH antagonist treatment (cetrorelix acetate, Cetrotide; Merck Serono SA, Switzerland) was commenced when at least 2 follicles reached 13–14 mm and continued until the day of HCG administration. Oocyte retrieval was performed 36 h after hCG. Metaphase II oocytes were submitted to ICSI with ejaculated sperm after oocyte denudation.
Cumulus-oocyte complex (COC) collection
Following oocyte retrieval, the COCs were washed several times in culture medium G1V5 (Vitrolife, Sweden), then incubated at 37°C until denudation. In some patients, a portion of oocytes underwent ICSI while others were inseminated by IVF. Shortly before ICSI, CCs were stripped from the COC with hyaluronidase, washed in several droplets of the free enzyme medium; only cumulus–oocyte complexes with metaphase II oocytes (characterized by the presence of the first polar body) were selected for this study. The collected CCs were washed in cold phosphate-buffered saline (PBS) and centrifuged twice at 800 g for 8 min; the cell pellet was resuspended in cold PBS and equally divided into two aliquots for chromatin and RNA extraction. Afterwards, the samples were centrifuged, then the pellets of cumulus cells were snap frozen in liquid nitrogen then stored at –80°C.
RNA extraction and cDNA synthesis and reverse transcription-polymerase chain reaction (RT-PCR)
Total RNA was isolated from the cumulus cells using the Allprep DNA/RNA Micro Kit (Qiagen, Cat. No: 80284) according to the manufacturer’s instructions. Twenty ng/μl of RNA was used for cDNA synthesis by the QuantiTect Whole Transcriptome Kit (Qiagen, Cat. No: 207045) according to the manufacturer’s instructions.
Quantitative real-time polymerase chain reaction (qRT-PCR)
Messenger RNA (mRNA) quantification was performed by qRT-PCR on the Step-One RT-PCR system (Applied Biosystems, USA). Each reaction was run in triplicate. Melt curve analysis was performed to confirm the specificity of the amplified product. To evaluate primer efficiency, a standard curve was obtained for each gene using the logarithmic dilution series of total cDNA [18]. The CYP19A1 mRNA relative to the level of 18s rRNA as the endogenous control was calculated using the 2–ΔΔCt algorithm. Primer sets, product size and annealing temperatures were previously described by Hosseini et al. [19].
Chromatin immunoprecipitation (ChIP) assay
Chromatin immunoprecipitation assays were performed using the low cell number ChIP kit (Diagenode, Cat. No. C01010072) according to the manufacturer’s instructions as previously described [19]. Briefly, proteins were cross-linked to DNA by incubating the cumulus cells with formaldehyde (36.5%; Sigma, USA). Then, formaldehyde reaction was quenched by the addition of glycine. Afterwards, cells were lysed and chromatins were sonicated on ice (30”on/30”off) to obtain soluble sheared chromatin (average DNA length of 200–500 bp). One percent of the soluble chromatin was saved at –20°C for input DNA, and the remainder was used for immunoprecipitation by specific antibodies.
Protein A/G-coated magnetic beads (Diagenode, Cat. No: K02141006/C03010021) were incubated either with the following ChIP-validated antibodies (Abs): anti-methyl-CpG-binding domain protein2 (MeCP2; ab2828, Abcam, UK), H3 dimethyl Lys9 (H3K9me2, ab1220, Abcam, UK) H3 acetyl Lys9 (H3K9ac, ab4441, Abcam, UK) or estrogen receptor beta (ERβ, ab3577, Abcam). The beads were combined with chromatin extracts of CCs at 4°C overnight with rotation. The immunoprecipitated DNA was purified using DNA isolation buffer (Diagenode). Quantification of ChIP-enriched DNA and the relative levels of DNA methylation and histone modifications of CYP19A1 PII, PI.3, and PI.4 promoters were analyzed by real-time PCR with specific primer sets previously described in Hosseini et al. The IP/INPUT ratio of target sequence was determined using the following formula: (% IP/INPUT = 2[(Ct (x% input) – log (x %) /log2) – Ct (IP)] × 100).
Nucleosome ELISA
Enzyme-linked immunosorbent assay on nucleosomes (NU-ELISA) was performed for quantitative analysis of global levels of DNA methylation, histone acetylation and histone methylation (according to Dai et al.) [20]. Briefly, after spectrophotometry of sheared chromatin, which had been prepared by the ChIP method, sheared chromatin was coated in coating solution (KPL Cat. No. 50-84-00) overnight at 4°C into ELISA plates (Nunc Maxi-Sorp plates). Background control was obtained from wells without sheared chromatin. An anti-histone H1 Ab was used as a loading control.
After overnight incubation, wells were washed four times with Wash Solution (KPL Cat. No. 50-63-00) for 2.5 min, then blocked with blocking solution (KPL Cat. No. 50-84-00) and incubated for 1 h at room temperature (RT). Afterwards, blocking buffer was aspirated and primary antibodies (anti-MeCP2, anti-H3K9me2 and anti-H3K9ac) were added and incubated at RT for 2 h, then washed again four times and HRP-conjugated secondary Abs were added and incubated at RT for 1 h. After washing, tetramethylbenzidine (TMB) peroxidase substrate (KPL, Cat. No. 50-7600) was added. Finally, the reaction was stopped using H2SO4. Optical absorption of plates was read at 450 nm by an ELISA reader (Biotech, ELX800). Relative assay levels for incorporation of MeCP2, H3K9me2 and H3K9ac proteins in chromatin fractions were calculated by normalizing ELISA signals (after background subtraction) to core histone H1 content.
Statistical analysis
Statistical calculations were performed using the IBM SPSS Statistics 21 software (Armonk, NY: IBM Corp). Data were analyzed for normal distribution. The Student t-test with a two-tailed distribution and Levene’s test for equality of variances were used when the distribution of the values was normal and the non-parametric Mann-Whitney test was used when the distribution was not normal to compare samples. Spearman correlation was used to show a correlation between variables. The level of p < 0.05 was considered to be statistically significant.
RESULTS
Demographic information
All demographic data are presented in Table I. Age and BMI were similar across the two groups (p > 0.05).
Table I
Demographic information
| Variables | Control (n = 12) | PCOS (n = 12) | P-value |
|---|---|---|---|
| Age [years] | 28.9 ±6.3 | 30.58 ±5.1 | NS |
| BMI [kg/m2] | 22.35±2.03 | 23.41 ±1.45 | NS |
| FSH [IU/l] | 5.6 ±1.1 | 4.1 ±1.7 | 0.03 |
| LH [IU/l] | 3.31 ±0.97 | 7.12 ±2.96 | 0.002 |
| LH/FSH ratio | 0.59 ±0.12 | 1.75 ±0.37 | 0.001 |
| AFC | 11.16 ±2.3 | 20.8 ±3.1 | < 0.001 |
| TT [ng/ml] | # | 1.5 ±0.4 | NA |
| Total no. of COCs | 111 | 183 | NA |
| *Total no. of COCs for ICSI | 108 | 138 | NA |
| No. of oocytes retrieved | 9.25 ±3.36 | 15.25 ±5.02 | 0.002 |
However, there were statistically significant differences between the control and PCOS group according to the features of PCOS, such as the ratio of luteinizing hormone/follicle-stimulating hormone and AFC (Table I). The PCOS group showed significantly lower basal FSH levels and higher LH as compared to the non-PCOS women (p < 0.05).
Nucleosome ELISA analysis of DNA methylation and histone modifications in cumulus cells
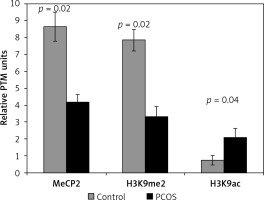
The hypomethylation profile in PCOS patients was significantly lower than that of the control subjects (p = 0.02) (Figure 1).
Figure 1
Differential incorporation of epigenetic marks (MeCP2, H3K9me2, and H3K9ac) into chromatin of cumulus cells of PCOS patients vs. control normalized to histone H1 content

Also, the level of H3K9 methylation was significantly lower in the PCOS than in the control group, while cumulus cells of PCOS had a significant higher level of chromatin-wide occupancy of H3K9ac than the non-PCOS control (p = 0.02 and p = 0.04, respectively) (Figure 1).
CYP19A1 mRNA expression
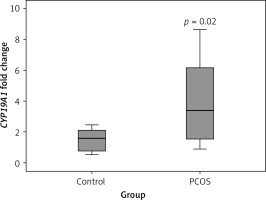
As shown in Figure 2, according to the qRT-PCR results, PCOS cumulus cells showed significant up-regulation of the CYP19A1 gene when compared to the control group (p = 0.02).
DNA methylation, histone methylation and histone acetylation of the CYP19A1 promoters
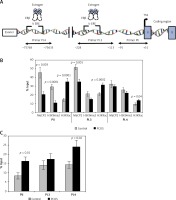
Incorporation of MeCP2 (repression marker) in PII and PI.3 promoters was significantly lower in PCOS cumulus cells compared to the control group (p = 0.003 and p = 0.001, respectively). However, the level of MeCP2 binding to the PI.4 promoter did not show a significant difference between the two groups (p > 0.05) (Figure 3 B).
Figure 3
Analysis of the epigenetic profile of CYP19A1 gene. A – Schematic diagram of CYP19A1 gene promoters (PII, PI.3, and PI.4) examined by chromatin immunoprecipitation (ChIP) assay. Regions amplified by qPCR are shown by arrows, and nucleotide numbers are relative to the transcription start site (TSS). B – Incorporation of MeCP2, H3K9me2, and H3K9ac into PII, PI.3, and PI.4. C – Incorporation of ERβ into three evaluated regulatory regions of the CYP19A1 gene. The results are expressed relative to a 1/100 dilution of input chromatin (mean ± SEM)

In CCs of PCOS patients, PII, PI.3 and PI.4 promoter regions of CYP19A1 were significantly hyperacetylated (activation marker) in comparison to controls (p = 0.0001, p = 0.002, and p = 0.04, respectively). Moreover, significant hypomethylation at H3K9 of promoter PII (repression marker) was observed in PCOS patients (p = 0.0001), whereas no significant difference of H3K9 methylation level was detected in PI.3 and PI.4 promoters between patient and the control groups (Figure 3 B).
Differential ERβ incorporation on the CYP19A1 promoters
Significant differences between the control and patient groups were found in terms of ERβ binding to the three analyzed promoters. The binding of ERβ to promoters PII and PI.4 in the PCOS patients was significantly higher than in the control group (p = 0.01 and p = 0.02, respectively) (Figure 3 C).
Correlations between CYP19A1 gene expression with DNA methylation and histone modifications
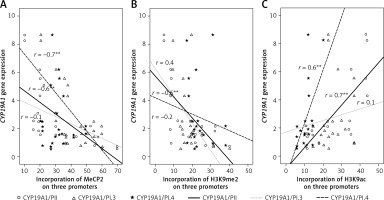
To evaluate the association between the levels of the CYP19A1 gene expression and different epigenetic markers, bivariate correlation was used. As expected, there were strong negative correlations between CYP19A1 mRNA levels and DNA methylation in PII and PI.3 promoters as well as between CYP19A1 mRNA level and histone methylation in PII (Figure 4).
Figure 4
Correlations between CYP19A1 mRNA expression levels and DNA methylation or histone modifications in CCs analyzed using Pearson’s correlation
*Correlation is significant at the 0.05 level, **correlation is significant at the 0.01 level.

CYP19A1 mRNA levels and histone acetylation level in PII and PI.4 promoters were also strongly correlated in CCs from PCOS and control patients (Figure 4).
Discussion
Differential occupancy of H3K9 di-methylation and DNA methylation (repression markers) and H3K9 acetylation (activation marker) were detected in chromatin of PCOS cumulus cells compared to the healthy control women. Potential epigenetic modification as a key mechanism contributing to developing PCOS has been previously investigated in several studies. Shen et al. employed peripheral blood genome-wide DNA methylation analysis and reported 79 differentially methylated genes between PCOS-noninsulin resistance and PCOS-insulin resistance women, and 40 differentially methylated genes between PCOS and controls [3]. However, Xu et al. reported that DNA global methylation in peripheral blood was not significantly altered in PCOS patients compared to healthy controls [21]. Further studies have shown that ovary genome-wide DNA methylation and expression patterns were significantly different between normal and PCOS ovaries [22]. In contrast to previous global epigenetic studies on whole ovaries, other researchers, such as Jiawei et al., focused on the investigation of specific cell genome-wide DNA methylation patterns of PCOS. They indicated that altered genome-wide DNA methylation of granulosa cells may be responsible for the PCOS clinical pathology [23]. However, to date, no study has analyzed global DNA methylation, histone acetylation and methylation status of PCOS cumulus cells in COS cycles. This study reported for the first time that there is almost a three-fold increase in total occupancy of the chromatin by H3K9 acetylation and a two-fold reduction in H3K9 methylation in PCOS cumulus cells versus the control group.
Different epigenetic modifications mediate the disturbances in folliculogenesis which may lead to ovarian dysfunction and anovulatory cycles in PCOS [24]. It is well known that several genes whose expression is controlled by epigenetic factors are involved in the pathophysiology and origin of PCOS or may predispose women to this syndrome [22, 24, 25].
CYP19A1, which encodes cytochrome P450 aromatase that converts androgens to 17β estradiol (E2), is considered to be one of the essential genes in the follicular arrest in PCOS [26]. The timely production of E2 in the follicular microenvironment plays a pivotal role in the ovarian functions, folliculogenesis, follicular growth and development [27, 28]. Because of its role in PCOS disease status, CYP19A1 was our candidate gene for further epigenetic investigations in this study.
CYP19A1 gene expression patterns have obvious differences in PCOS patients before and during ovarian stimulation in COS cycles. Several studies have reported low levels of P450arom mRNA, a reduction in ovarian aromatase activity and E2 production in various sizes of PCOS follicles [29–31]. In this situation, the follicles in polycystic ovary arrest at the small antral stage just before expression of aromatase, so androgen excess following from this reduced expression and activity might contribute to abnormal folliculogenesis [6].
Suboptimal levels of FSH and defects in the regulation of hormones and intracellular signaling for CYP19A1 induction or epigenetic changes in regulatory regions of this gene are among the major causes of aromatase deficiency and the pathogenesis of PCOS [9, 32]. However, in ovarian stimulation cycles, the exaggerated responsiveness of granulosa cells to exogenous FSH in terms of estradiol production leads to ovarian hyperstimulation syndrome (OHSS) in some patients. Furthermore, when the GCs of PCOS are isolated from their follicular milieu in arrested follicles and cultured and stimulated by FSH in vitro, they produce a markedly increased level of estradiol [9, 26]. Our results, consistent with the results from others [27, 33, 34], demonstrate that CYP19A1 gene expression was significantly higher in CCs of PCOS versus the control group.
It is well known that aromatase expression in human tissues is regulated by quite complex pathways, involving combined action of tissue-specific promoters that are alternatively used in various cell types and also by transcription factors [14, 27]. Also, transcriptional regulation by epigenetic mechanisms, such as DNA methylation and histone modifications, is another distinct pathway for aromatase gene expression [35].
The acetylation of histone H3 at lysin 9 (H3K9ac) activates transcription. In contrast, DNA and also H3K9 methylation (H3K9me2) usually lead to the silencing of a variety of genes [36]. MeCP2, as a part of the methyl-binding protein family, can specifically bind to a methylated CpGs on the DNA and functions as a repressor of transcription [37–39].
As reported previously [19], since a part of the first exon (exon I) of CYP19A1 (regions between –228 and +51 bp) contains the regulatory element binding sites which authorize promoter regulation in the ovarian cells [27], this region was studied here. Also, we searched and found two estrogen receptor half-site sequences (1/2ERE: AGGTCA) in PI.3 and PI.4 promoters (details are shown in Figure 2 A); thus, these regulatory sequences were selected for primer design and screened for ERβ binding and epigenetic alterations.
In the present study we demonstrated that DNA methylation (MeCP2 level) at PII and PI.3 promoters as well as the incorporation of the histone H3K9me2 mark in promoter PII were almost two-fold lower in CCs of PCOS than those of cells in the control group. This study shows that enhanced PCOS aromatase expression during COS is associated with promoter hypomethylation.
Moreover, in the current study, incorporation of the histone H3K9ac mark in three analyzed promoters (PII, PI.3, and PI.4) of CYP19A1 was significantly higher than the control group. These results reinforce the possibility of an epigenetic contribution to aromatase gene expression in PCOS patients during COS.
Aromatase expression in granulosa and cumulus cells is controlled by several ovarian regulatory factors [27]. Each promoter of the CYP19A1 gene is controlled by a distinct set of regulatory sequences, such as estrogen response element (ERE), and transcription factors that bind to these definite sequences. FSH receptor (FSHR) modulates FSH action through activation of the aromatase gene by ERβ. The main mechanism of action of E2- ERβ complex, as a transcription factor, to regulate its target genes involves direct binding of ER to the ERE on the promoter regions of genes or binding to other docking transcription factors. This pathway is considered to be one of the main signaling cascades through which the ovarian aromatase is regulated [27].
COS with gonadotropins leads to a higher risk of ovarian hyperstimulation syndrome (OHSS) for PCOS patients, because of higher sensitivity and an exaggerated response to gonadotropins. Elevated estrogen and estradiol level have been implicated in OHSS [40]. Regarding the importance of the regulatory role of ERβ in the expression of the CYP19A1 gene, an augmented ovarian cell reaction, relevant to aromatase expression, may not only be described by a possible epigenetic change in the CYP19A1 gene but also by subsequently increased incorporation of ERβ into its promoters. Thus, ERβ-selective antagonist compounds that antagonize estradiol production may constitute a future treatment strategy for the prevention of OHSS.
Further studies with additional samples are necessary to evaluate the interactions of other transcription factors with ERβ and to elucidate the precise mechanisms involved in aromatase gene expression in PCOS patients undergoing ovarian stimulation and to confirm the validity of these findings. Also, the relationship between aromatase epigenetic changes from the point of view of the oocyte maturation and embryo development will be investigated in future studies.
In conclusion, according to the above-mentioned results, several epigenetic alterations that include DNA hypomethylation, histone hyperacetylation, and hypomethylation may contribute to chromatin remodeling. Thus, this enables estrogen receptor β to have better access to the DNA. It is likely that higher binding of ERβ proteins to the promoter regions triggers a pathogenic mechanism in the PCOS patients by up-regulating the expression of CYP19A1.


