Introduction
According to the WHO definition, human health means “a state of complete physical, mental and social well-being and not merely the absence of disease or infirmity” [1].
The patient’s health condition is worsened by chronic diseases, especially if the phenomenon of multimorbidity occurs. Chronic diseases are one of the main global factors leading to human disability and death [2].
The concept of quality of life (QoL) appeared in the literature at the beginning of the 20th century. There are many definitions of QoL. However, a general definition states that it is an integral feature of the physical, mental and social functioning of a person, considering his/her subjective perception of the surrounding environment [3]. Constant epidemiological and demographic changes, development of medicine, climate change, new technologies, development of food industry and civilization development resulted in changes in health standards, including the increase in morbidity and the comorbidity of chronic diseases, contributed to the change in the level of perceived QoL [4–6]. Such a state requires constant monitoring, analysis and control of health as well as analysis assessing the impact of these factors on the occurrence of diseases and assessing the health-related quality of life (HRQoL). Expanding knowledge in the field of HRQoL is attributed to Schipper, whose research in the 1990s defined HRQoL as “the direct and indirect influence of disease and the treatment process, experienced and perceived by a patient” [7]. According to the current WHO definition, the HRQoL is “the direct and indirect influence of disease and the treatment process, experienced and perceived by a patient” [8]. Thus, HRQoL is a multidimensional broad concept, as well as a useful indicator of overall health due to the information contained regarding physical and mental health and their impact on QoL, where the patient plays the primary role [9–11].
According to the available knowledge, HRQoL is considered a strong predictor of mortality. For this reason, it is an important factor in assessing the prognosis in various disease entities, such as cardiovascular diseases (CVDs) [12]. These factors mean that in recent years, the HRQoL analysis of patients has become a special subject of research not only in the field of social sciences, but also in the field of medicine. QoL and the HRQoL are the subjects of many studies, are also relevant on a daily basis in medical practice and constitute an important determinant of the quality of medical interventions [13], with particular emphasis on the patient’s independence in everyday functioning [14].
The main purpose of the study was to prepare a ranking of diseases considering 13 disease entities, indicating which spheres and dimensions of QoL are rated the best and worst, and what the chance for better QoL is in individual disease entities. This will allow us to make general conclusions regarding which groups of diseases form homogeneous groups and most significantly affect the quality of life, considering mental and physical dimensions. It will also allow us to prepare a ranking of diseases that have the strongest impact on quality of life, and to assess the chance of a better quality of life in individual disease entities.
Material and methods
Organization of the study
At the beginning of the study, the scientific reports available in the PubMed database were analysed by entering the order of entries ((quality of life) AND (diseases) AND (ranking)). The search period was shortened to the last 10 years (since 2013). QoL is constantly changing due to new technologies and solutions in the field of medicine. The result of the search was 699 items. Having analysed the source materials, the studies most often included predictions of the risk of disease occurrence and an indication of the ranking of diseases due to the risk of their occurrence or other factors such as RNA, laboratory indicators, etc. The studies most often include comparisons of treatment methods, analysis of the impact of the duration of the disease, etc., in individual disease entities. The literature presents comprehensive analyses of several disease entities to an extremely limited extent, which is why the authors attempted to compare and assess the HRQoL in different disease entities.
The study was carried out randomly in a group of 8,967 patients of specialist clinics and primary care clinics. Incomplete data and incorrectly completed questionnaire sheets were rejected from the main study. Ultimately, 7,620 respondents were included in the study.
The study was anonymous and voluntary. The respondents were informed about the possibility of dropping out of the study at any stage. The respondents provided their voluntary, anonymous consent to participate in the study. The study did not bear any risk.
Thirteen groups of patients with the following diseases were included in the analysis: cancers (CD), cardiovascular disease (CVD), diabetes mellitus (DM), disease of digestive system (DS), degenerative changes of the cervical spine (DSD-C), degenerative changes of the lumbosacral spine (DSD-LS), degenerative changes of the thoracic spine (DSD-Th), ophthalmic diseases (ED), ENT diseases (LD), diseases of the nervous system (NS), respiratory diseases (RS), thyroid diseases (TD), diseases of the kidneys and urinary system (UD). Long-term treatment (at least 2 years) due to the diagnosed disease and the absence of other symptoms and/or other diseases requiring permanent medication were the criteria for inclusion in the study.
Study group
The study was carried out in a group of 7,620 patients (F: 4203; 55.2%; M: 3417; 44.8%). The average age of the studied population was 51.7 ±15.1 years. Among the studied people, the highest mean age was recorded in the group of people suffering from CVD (64.9 ±10.8), the lowest among patients with TD (42.3 ±13.8). Detailed data on the distribution of sex, place of residence, level of education and age, considering individual diseases, are presented in Table I.
Table I
General characteristics of the study group of respondents
[i] *X – average, −95Cl/+95Cl – 95% confidence interval of average or standard deviation, SD – standard deviation, CD – cancers, CVD – cardiovascular disease, DM – diabetes mellitus, DS – disease of digestive system, DSD-C – degenerative changes of the cervical spine, DSD-LS – degenerative changes of the lumbosacral spine, DSD-Th – degenerative changes of the thoracic spine, ED – ophthalmological diseases, LD – ENT diseases, NS – diseases of the nervous system, RS – respiratory diseases, TD – thyroid diseases, UD – diseases of the kidneys and urinary system.
SF-36 questionnaire and sociodemographic factors
The study was carried out using the SF-36 questionnaire to assess the quality of life. A license was obtained to use the SF-36 tool for assessing quality of life (License Number: QM039882). The SF-36 questionnaire allows for the analysis of the quality of life in the following dimensions: physical functioning – PF; role physical – RP; bodily pain – BP; general health – GH; vitality – VT; social functioning – SF; emotional roles – RE; mental health – MH. Individual spheres were assigned to two of the main dimensions. The assignment was as follows: PF + RF + BT + GH form the Physical Component Summary (PCS). VT + SF + RE + MH form the Mental Component Summary (MCS). Both of these dimensions – PCS and MCS – constitute the Index of Life Quality (ILQ). The variables were encoded according to the SF-36 tool coding key [15, 16].
The reliability of the SF-36 tool for assessing the QoL of patients with different disease entities was assessed for the purposes of this study. The value of Cronbach’s reliability coefficient in the analysed spheres and dimensions of SF-36 was 0.88. This confirms the homogeneity of the tool used for the following analysis. Among all the examined patients (n = 7,620), the lowest level of perceived quality of life was recorded in the sphere of RP (46.0 ±43.9) and GH (47.3 ±17.3). The highest level of QoL was noted in the PF (69.2 ±28.4) and SF (66.9 ±26.7) spheres. In the overall dimension analysis, a higher mean QoL level was noted in the MCS dimension (58.3 ±22.3) compared to the PCS (53.3 ±19.7) (Table II).
Table II
General characteristics of individual spheres and dimensions of SF-36 in the group of patients (in percentages)
[i] *X – average, -95Cl/+95Cl – 95% confidence interval of average or standard deviation, SD – standard deviation, Me – median, Reference (Min-Max) – range of values between the minimum and maximum value, Q1 – lower quartile, Q3 – upper quartile, PF – physical functioning, RP – role physical, RE – role emotional, VT – vitality, MH – mental health, SF – social functioning, BP – bodily pain, GH – general health, HCh – subjective sense of change in health, MCS – Mental Component Summary, PCS – Physical Component Summary, ILQ SF-36 – Index of Life Quality.
Statistical analysis
Only correctly entered and complete data were included in the analysis.
The research and analysis were carried out in several stages. Random stratified sampling was used, resulting in a sample representative of the adult population of Poland in relation to the analysed disease entities.
Measurable variables were presented using: mean values, 95% of the range for the mean value, standard deviation (SD), 95% of the range for the SD value, median, upper quartile and lower quartile values. For the purposes of data analysis, the MCS, PCS and ILQ values were reorganized from a measurable variable to a dichotomous variable. Better (> 50%) and worse (≤ 50%) quality of life were determined. This allowed the logistic regression and the assessment of the odds ratio with the confidence interval (+Cl; –Cl).
Reliability was assessed using Cronbach’s α, which assesses the internal consistency of the test. The value of the indicator ranges from 0 to 1. The higher the value of the indicator is, the higher is the internal consistency of the test, which is tantamount to a high level of reliability. A satisfactory level of reliability is the index value > 0.70 [17].
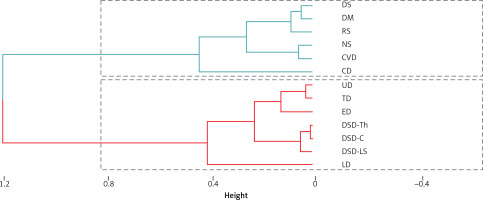
The results of the dendrograms present the created clusters using the Ward method in a hierarchical form, indicating the gradual similarity between the distances in the elements of the data set. In the case of MCS, the scree plot chart indicated the creation of 2 clusters (diseases that have a large impact and a small impact on the QoL). In the case of PCS and ILQ, the scree plot charts in both cases additionally indicated groups between strong and weak influence.
Hierarchical clustering is one of the popular clustering techniques in data analysis and machine learning. It consists in grouping data into a hierarchical tree or dendrogram structure. The main purpose of this technique is to group similar objects into clusters that have similar characteristics or properties.
Basic assumptions of hierarchical clustering:
Starting with single clusters: The algorithm begins by treating each object as a separate cluster.
Similarity measure: During the operation of the algorithm, we must choose a measure of similarity or distance between objects. The measure value determines what objects will be connected to form clusters.
Cluster connection: The algorithm iteratively combines the two most similar clusters into one, and then updates the similarity or distance matrix between the clusters.
Creating a tree: We continue combining clusters in pairs until we have one main cluster containing all the data (dendrogram).
Results
The highest average QoL level was recorded in the group of people suffering from ENT diseases. The highest average measurements above 82% were recorded in the following spheres: BP, PF, RE, RP, SF and an average value of 76.96% in MCS and 69.17% in PCS (Table III).
Table III
Average level of perceived quality of life in individual spheres and dimensions of SF-36, considering disease entities. Heatmap of average SF-36 values (in percentages)
[i] BP – bodily pain, GH – general health, HCh – Subjective sense of change in health, MH – mental health, PF – physical functioning, RE – role emotional, RP – role physical, SF – social functioning, VT – vitality, MCS – Mental Component Summary, PCS – Physical Component Summary, ILQ SF-36 – Index of Life Quality, CD – cancers, CVD – cardiovascular disease, DM – diabetes mellitus, DS – disease of digestive system, DSD-C – degenerative changes of the cervical spine, DSD-LS – degenerative changes of the lumbosacral spine, DSD-Th – degenerative changes of the thoracic spine, ED – ophthalmic diseases, LD – ENT diseases, NS – diseases of the nervous system, RS – respiratory diseases, TD – thyroid diseases, UD – diseases of the kidneys and urinary system, 100% – is the best perceived QoL level.
The lowest average values in individual spheres and dimensions were recorded among oncology patients, suffering from cardiovascular diseases, neurological diseases and respiratory diseases. In the group of patients with CD, the lowest mean level of perceived QoL was recorded in RE (22.75%) and RP (23.73%). In the group of patients with CVD, the sphere with the lowest score was RP (19.17%). A similar situation occurred among patients with HF (24.84%). Among people with RS diseases, the lowest rated spheres were GH (34.77%), RE (37.80%) and RP (34.94%) (Figure 1).
Figure 1
Average level of perceived quality of life in the MCS, PCS and ILQ dimensions, including diseases
MCS – Mental Component Summary, PCS – Physical Component Summary, ILQ SF – 36 – Index of Life Quality, CD – cancers, CVD – cardiovascular disease, DM – diabetes mellitus, DS – disease of digestive system, DSD-C – degenerative changes of the cervical spine, DSD-LS – degenerative changes of the lumbosacral spine, DSD-Th – degenerative changes of the thoracic spine, ED – ophthalmic diseases, LD – ENT diseases, NS – diseases of the nervous system, RS – respiratory diseases, TD – thyroid diseases, UD – diseases of the kidneys and urinary system.
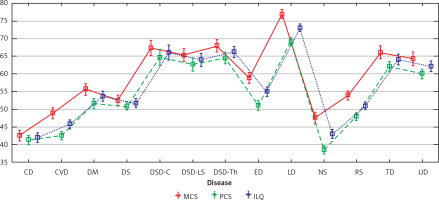
The graphical presentation of the mean values of perceived quality of life confirms that the lowest average quality of life was declared by people with oncological diseases (CD), cardiovascular disease (CVD) and patients with nervous system diseases (NS). The best quality of life in both dimensions was noted among patients suffering from ENT diseases (LD) (Figure 2).
Figure 2
Frequency of occurrence of QoL of 50% and below (value 0) and above 50% (value 1) by disease considering MCS, PCS and ILQ (percentages)
MCS_c – Mental Component Summary, PCS_c – Physical Component Summary, ILQ_c – Index of Life Quality, CD – cancers, CVD – cardiovascular disease, DM – diabetes mellitus, DS – disease of digestive system, DSD-C – degenerative changes of the cervical spine, DSD-LS – degenerative changes of the lumbosacral spine, DSD-Th – degenerative changes of the thoracic spine, ED – ophthalmic diseases, LD – ENT diseases, NS – diseases of the nervous system, RS – respiratory diseases, TD – thyroid diseases, UD – diseases of the kidneys and urinary system, 0 – measurement value 50% and below (poor quality of life), 1 – measurement value above 50% (good quality of life).
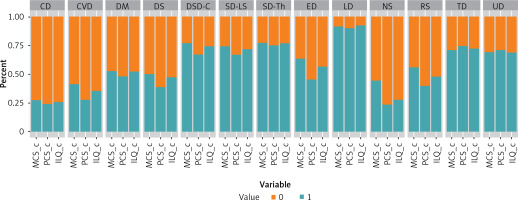
The data were reorganized so that a value of 0 was assigned to people who obtained a measurement value in the SF-36 not higher than 50%, and 1 to people who declared a level of perceived quality of life above 50%. The above data confirm the lower perceived quality of life (≤ 50%) more often among patients with CD, CVD, NS, RS, DS and DM (Figure 3).
Figure 3
Frequency of occurrence of worse quality (value 0) of life in particular diseases, considering MCS, PCS and ILQ dimensions (percentage values)
MCS_c – Mental Component Summary, PCS_c – Physical Component Summary, ILQ_c – Index of Life Quality, CD – cancers, CVD – cardiovascular disease, DM – diabetes mellitus, DS – disease of digestive system, DSD-C – degenerative changes of the cervical spine, DSD-LS – degenerative changes of the lumbosacral spine, DSD-Th – degenerative changes of the thoracic spine, ED – ophthalmic diseases, LD – ENT diseases, NS – diseases of the nervous system, RS – respiratory diseases, TD – thyroid diseases, UD – diseases of the kidneys and urinary system.
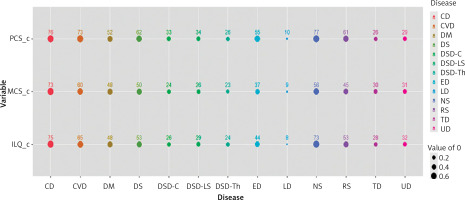
A high percentage of worse QoL (≤ 50%) in the PCS dimension was recorded in the group of patients with CD (76%), NS (77%), CVD (73%), DS (62%) and RS (61%). The lowest percentage of worse QoL was observed in the group of patients with LD (10%), TD (26%), DSD-Th (26%) and UD (29%).
Cancer diseases among all the analysed disease entities contributed to the highest percentage of lowering the quality of life in the mental sphere (MCS). The frequency of occurrence of reported worse quality of life in MCS (≤ 50%) was 73%. Among patients with CVD, it was 60% and among patients with NS it was 56%.
The groups of patients with the lowest percentage of worse QoL in MCS were patients with LD (9%), DSD-C (24%), DSD-Th (23%) and DSD-LS (26%), TD (30%) and UD (31%). The diseases listed above determined the worse QoL to the least extent.
Among all groups of patients, the lowest chance of a better quality of life (in terms of MCS, PSC and ILQ) was noted among oncology patients (reference point in the analysis). The QoL of patients with cancer was the lowest among all analysed diseases. As far as MCS is concerned, better QoL was significantly more frequent compared to CD among patients with DM (OR = 2.97; CL: 2.33–3.80), DSD-C (OR = 8.70; CL: 6.46–11.82), DSD-LS (OR = 7.71; CI: 5.78–10.34), DSD-Th (OR = 8.85; CI: 6.80–11.58), ED (OR = 4.65; CI: 3.65–5.95), LD (OR = 27.36; CI: 19.68–38.70), RS (OR = 3.37; Cl: 2.64–4.32), TD (OR = 6.48; CI: 4.91–8.60), or UD (OR = 6.01; CI: 4.68–7.76). In the PCS dimension, there was a significantly higher chance of better QoL compared to patients with CD among patients with: DM (OR = 2.94; Cl: 2.30–3.79), DSD-C (OR = 6.43; Cl: 4.83–8.62), DSD-LS (OR = 6.29; Cl: 4.75–8.39), DSD-Th (OR = 9.37; Cl: 7.19–12.29), LD (OR = 27.93; Cl: 20.25–39.12), TD (OR = 9.05; Cl: 6.79–12.16), or UD (OR = 7.89; Cl: 6.09–10.27) (Table IV).
Table IV
The chance of a better quality of life in the analysed groups of patients, considering the disease entities
| Diseases | MCS | PCS | ILQ |
|---|---|---|---|
| OR (-95% CI – +95% CI) | OR (-95% CI – +95% CI) | OR (-95% CI – +95% CI) | |
| CD | * | * | * |
| CVD | 1.84 (1.44–2.35) | 1.21 (0.93–1.57) | 1.60 (1.24–2.06) |
| DM | 2.97 (2.33–3.80)*** | 2.94 (2.30–3.79)*** | 3.18 (2.49–4.08)*** |
| DS | 2.67 (2.09–3.41) | 2.00 (1.55–2.58) | 2.62 (2.05–3.36) |
| DSD-C | 8.70 (6.46–11.82)*** | 6.43 (4.83–8.62)*** | 8.44 (6.28–11.42)*** |
| DSD-LS | 7.71 (5.78–10.34)*** | 6.29 (4.75–8.39)*** | 7.39 (5.56–9.90)*** |
| DSD-Th | 8.85 (6.80–11.58)*** | 9.37 (7.19–12.29)*** | 9.55 (7.32–12.53)*** |
| ED | 4.65 (3.65–5.95)*** | 2.64 (2.06–3.39) | 3.77 (2.96–4.83)*** |
| LD | 27.36 (19.68–38.70)*** | 27.93 (20.25–39.12)*** | 33.42 (23.75–47.95)*** |
| NS | 2.11 (1.67–2.67) | 0.96 (0.74–1.25) | 1.12 (0.88–1.45) |
| RS | 3.37 (2.64–4.32)*** | 2.06 (1.60–2.66) | 2.67 (2.08–3.42) |
| TD | 6.48 (4.91–8.60)*** | 9.05 (6.79–12.16)*** | 7.62 (5.74–10.17)*** |
| UD | 6.01 (4.68–7.76)*** | 7.89 (6.09–10.27)*** | 6.37 (4.95–8.24)*** |
OR – odds ratio, -95Cl/+95Cl – 95% confidence interval of OR, MCS – Mental Component Summary, PCS – Physical Component Summary, ILQ SF-36 – Index of Life Quality, CD – cancers, CVD – cardiovascular disease, DM – diabetes mellitus, DS – disease of digestive system, DSD-C – degenerative changes of the cervical spine, DSD-LS – degenerative changes of the lumbosacral spine, DSD-Th – degenerative changes of the thoracic spine, ED – ophthalmic diseases, LD – ENT diseases, NS – diseases of the nervous system, RS – respiratory diseases, TD – thyroid diseases, UD – diseases of the kidneys and urinary system,
The analysis carried out using the Ward method indicated that two groups of diseases correlated with a higher and lower level of perceived quality of life in the MCS dimension. The disease entities CD, CVD, NS, RS, DM and DS reduced QoL in the MCS dimension. The remaining analysed groups of diseases correlated with a higher level of QoL (Figure 4).
Figure 4
Agglomeration of groups of diseases according to their negative impact on the level of quality of life assessed in the MCS using the Ward method
CD – cancers, CVD – cardiovascular disease, DM – diabetes mellitus, DS – disease of digestive system, DSD-C – degenerative changes of the cervical spine, DSD-LS – degenerative changes of the lumbosacral spine, DSD-Th – degenerative changes of the thoracic spine, ED – ophthalmic diseases, LD – ENT diseases, NS – diseases of the nervous system, RS – respiratory diseases, TD – thyroid diseases, UD – diseases of the kidneys and urinary system, green cluster -> diseases lowering QoL more strongly, red cluster -> diseases least affecting QoL.
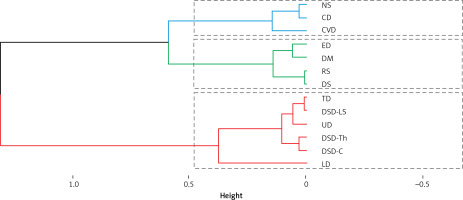
The next two cluster analyses covering the PCS and ILQ dimensions identified 3 homogeneous subsets of disease entities. The groups of diseases that most strongly correlated with the lowest QoL in PCS are CD, CVD and NS. Diseases indirectly determining QoL are ED, DM, RS and DS. Diseases correlated with higher QoL include TD, DSD-C, DSD-Th, DSD-LS, UD and LD. Equivalent results due to correlated homogeneous groups of diseases were shown by the cluster analysis carried out for the overall ILQ index (Figures 5, 6).
Figure 5
Agglomeration of groups of diseases according to their negative impact on the level of quality of life assessed in the PCS using the Ward method
CD – cancers, CVD – cardiovascular disease, DM – diabetes mellitus, DS – disease of digestive system, DSD-C – degenerative changes of the cervical spine, DSD-LS – degenerative changes of the lumbosacral spine, DSD-Th – degenerative changes of the thoracic spine, ED – ophthalmic diseases, LD – ENT diseases, NS – diseases of the nervous system, RS – respiratory diseases, TD – thyroid diseases, UD – diseases of the kidneys and urinary system, green cluster -> diseases lowering QoL more strongly, blue cluster -> intermediate QoL, red cluster -> diseases least affecting QoL.
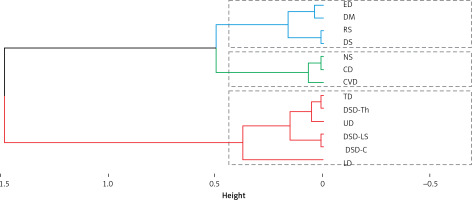
Figure 6
Agglomeration of groups of diseases according to their negative impact on the level of quality of life assessed in the ILQ using the Ward method
CD – cancers, CVD – cardiovascular disease, DM – diabetes mellitus, DS – disease of digestive system, DSD-C – degenerative changes of the cervical spine, DSD-LS – degenerative changes of the lumbosacral spine, DSD-Th – degenerative changes of the thoracic spine, ED – ophthalmic diseases, LD – ENT diseases, NS – diseases of the nervous system, RS – respiratory diseases, TD – thyroid diseases, UD – diseases of the kidneys and urinary system, blue cluster -> diseases lowering QoL more strongly, green cluster -> intermediate QoL, red cluster -> diseases least affecting QoL.
Discussion
The WHO indicates the 10 most important causes of mortality in the world, including cardiovascular diseases (ischaemic heart disease, stroke) and respiratory diseases (chronic obstructive pulmonary disease, lower respiratory infections, trachea, bronchus, lung cancers) listed in the first two places, diarrhoeal diseases, diabetes mellitus and kidney diseases. In the ranking of 10 global causes of loss of disability-adjusted life years (DALYs) in 2019, the WHO lists a number of the same diseases [18]. Non-communicable diseases (NCDs) are the main health problems of the 21st century. In Poland, according to the WHO data, it is estimated that NCDs account for 90% of all deaths, including 46% CVDs, 27% cancers, 10% other NCDs, and 5% chronic respiratory diseases [19]. For this reason, the WHO, as a leader in planning the promotion and prevention of NCDs, established the Global Action Plan for the Prevention and Control of NCDs 2013–2020 (Global NCD Action Plan). This plan was adopted in 2013 by the World Health Assembly [20, 21]. The Global Action Plan assumed global monitoring and achievement of any 9 global goals by 2025, which are correlated with the NCDs included in the 2030 Agenda for Sustainable Development [22–24]. One of the main goals is to reduce mortality due to the most common NCDs by 25% (cardiovascular diseases, cancers, diabetes, and chronic respiratory diseases).
To the best of our knowledge, the present study is the first cross-sectional study covering the most common groups of diseases and verifying HRQoL using the SF-36 questionnaire.
Comparing the frequency of occurrence of diseases and the results of the author’s studies on QoL, it is confirmed that the most common CVDs belong to the group of diseases that lower QoL the most, along with tumours and diseases of the nervous system. The worst QoL among the 13 analysed groups of diseases was noted in patients with cancer (CD), who had the lowest chance of feeling a good quality of life compared to other analysed disease entities in each dimension (PCS and MCS). Scientific reports confirm that the diagnosis of cancer and the treatment applied strongly affect the mental sphere of the patient and QoL [25]. QoL, on the other hand, is important for a patient who is between 2 and 26 years after diagnosis of cancer. Meta-analyses indicate the need for further analyses of QoL and its impact on long-term cancer survival [26]. Taking into consideration the HRQoL assessment in patients with cancer positively affects their well-being, as well as that of their families and caregivers, confirming the importance of a holistic approach to the patient and treatment [27].
According to epidemiological data, neurological diseases are the leading cause of global disability [28]. When analysing the constantly increasing percentage of the ageing, multimorbid population, it is necessary to predict the increasing percentage of patients burdened with chronic neurological diseases [29]. Another significant disease unit lowering QoL and leading to disability is osteoarthritis of the spine. Back pain is one of the most common causes of physical problems of the musculoskeletal system. Back pain syndromes, diagnosed especially in the cervical and lumbar sections, reduce QoL to a large extent and can lead to long-term disability [30]. It is estimated that in the adult population, the incidence of back pain syndromes is between 5.9% and 38.7%, while in the elderly population it is between 8.8% and 11.6% [31–33]. The frequency of occurrence of neck pain during life ranges from 14% to 71% [31, 34]. When analysing the QoL in the case of back pain syndromes, the lowest values were recorded for DSD-LS in the spheres BP, PF, RE, RP, SF and in MCS and PCS dimensions compared to DSD-C and DSD-Th. This is confirmed by the fact that in the case of low back pain (LBP) there is a worse QoL compared to the cervical and thoracic spine. It is estimated that 73.3% of patients with chronic L-S spine pain suffer from depressive disorders, and psychosocial factors have a negative effect on patients [35].
A group of diseases that significantly affects QoL is diseases of the kidneys and urinary system. Chronic kidney disease (CKD) is an important public health problem, especially due to the increase in the frequency of occurrence of risk factors such as an increase in the incidence of diabetes and hypertension, which can become a threat to developing countries with limited resources [36]. Analyses indicate a relationship between inferior QoL and modifiable factors, so this correlation indicates that special attention should be paid to psychosocial and medical interventions to improve QoL in patients with CKD [37]. Comparing the results of the authors’ studies with Kefale et al., who studied patients with chronic kidney disease [38] among the authors’ studies, a higher average value was recorded in almost all QoL spheres assessed in SF-36 outside MH (61.8) and VT (60.0) spheres. In the author’s studies, the average level of QoL was significantly lower (MH: 47.6; VT: 50.8).
Diabetes mellitus is one of the diseases of civilization. In the case of diabetes, an alarming increase in prevalence has been observed in recent decades. The presence of acute and chronic complications and the presence of concomitant diseases or rehabilitation procedures significantly affect the QoL of patients [39]. Another study carried out in a group of patients aged 68.67 ±11.09 indicated a significantly higher average perceived level of QoL in almost all spheres and dimensions of SF-36 compared to the author’s studies [40], which indicated that in the case of the spheres of RP, RE, MH, GH, VT, SF-36 measurement values did not exceed 50%, which meant worse HRQoL. For the MCS dimension, the measurement was 55.77%, for PCS slightly less – 51.63%.
Longitudinal studies indicate that lung dysfunction is strongly correlated and is a significant predictor of morbidity and mortality, and at the same time may in the future promote the development of many disease processes [41]. In the author’s studies, respiratory diseases most strongly reduced the sense of QoL in patients in the GH, RE and RP spheres, not exceeding 40.0%, which indicates a worse quality of life. QoL in the physical dimension was assessed to be worse compared to the mental dimension.
The literature on the subject also emphasizes the importance of gender in the group of people aged 60 and above with mixed mental and physical multimorbidity, indicating that women suffer from worse mental health [42]. People with multimorbidity are particularly vulnerable to the QoL reduction; they are two to three times more likely to experience mental problems, especially in older age [43].
The sense of meaning in life and the process of allostasis related to physiological changes occurring in various systems of the human body are also correlated with mental health [44]. Prolonged or insufficient cycles of allostasis may lead to the occurrence of “fragility” disorders and, consequently, to a higher risk of occurrence of cognitive diseases, deterioration of consciousness and mortality. Epidemiological studies indicate a correlation between the sense of life purpose and a lower incidence of certain diseases, a better ageing process and better mental health [45]. Studies conducted in chronic diseases such as multiple sclerosis confirm the key role of the meaning of life in the assessment of QoL [46].
Planning an effective promotion and prevention plan should be preceded by an analysis of health deficits associated with ongoing chronic disease. One of the diagnostic and predictive factors is the quality of life and the analysis of its level in each of the spheres and dimensions of human life.
Studies on the quality of life of patients in various disease entities most often investigate correlations with the proposed interventional treatment, pharmacological treatment, implemented rehabilitation, etc. [3]. It is impossible to find extensive, cross-sectional studies covering the analysis of the quality of life in several selected disease entities and attempts to compare them as a separate issue.
The present study and data analysis is the basis for comparing the quality of life for individual disease entities and groups of diseases analysed in the studies carried out by other authors. Assessment of the impact of individual diseases on QoL and assessment of the chance of a better quality of life compared to the disease entity that most significantly reduces the quality of life, which is cancer, were performed. In addition, the study results are the basis for further conclusions in the field of epidemiology and public health, considering the priorities of state institutions, including the WHO, in order to increase the quality of life of patients during the ongoing chronic disease process. Improving the quality of life is one of the main purposes of sustainable development (Agenda 2030) [47].
The main goal of health care is to prolong human life. This goal is mainly achieved in acute disease states. After the acute phase of disease its further treatment requires constant outpatient care. In this chronic phase of treatment the second important goal i.e., the quality of life, appears. The quality of life is influenced by many factors, such as the symptoms of the underlying disease, disability, side effects of medications, feeling threatened, emotional burdens, and dietary restrictions. All of these and many other factors affect HRQoL. Achieving high HRQoL requires the participation of many specialists depending on the needs. These needs vary depending on the disease. All care in its various aspects is provided by the general practitioner, with the help of consultants.
A references review in terms of the subject indicates that it is justified to conduct further analyses of HRQoL as an individual scientific issue among patients, considering gender and age groups, distinguishing between individual disease entities. The literature confirms the legitimacy of conducting analyses on the HRQoL due to the holistic model of treatment of the patient along with the assessment of his level of life satisfaction, which continues and often changes with the diagnosis of the disease.
The study has certain limitations. The main purpose of the study was to assess the impact of individual groups of diseases on the perceived quality of life, to create a ranking of diseases, considering mental and physical dimensions. The cross-sectional design used in the analyses did not allow us to consider the method of treatment, duration of the disease, type of administered medicaments, reaction to the applied rehabilitation treatment, etc., due to the fact that these factors were not analysed. There are many studies in the literature that include analyses of these factors in relation to selected disease entities.
On the other hand, it is impossible to find extensive, cross-sectional studies covering the analysis of the quality of life in several selected disease entities and attempts to compare them as a separate issue. For this reason, comparison of the results was difficult.
The analysis, in accordance with the main assumption, was to show in which of the dimensions which disease entities determine better or worse QoL, which of them determine QoL in the mental dimension more strongly, and which group of diseases affects the physical dimension of QoL more strongly. The authors attempted to compare HRQoL using SF-36 in all disease entities, despite different clinical symptoms, treatment methods, etc. The basis for the use of the SF-36 tool in the study was the assessment of the reliability of the tool in the study group using Cronbach’s α, which confirmed the reliability of the tool used in the study group at a satisfactory level (analysis in section 2.3).
In conclusion, cancer diseases (CDs), cardiovascular diseases (CVDs) and diseases of the nervous system (NS) are the groups of diseases that most significantly lower the sense of QoL in the physical dimension (PCS) and in the Index of Life Quality (ILQ). The lowest chance of good QoL in terms of PCS and MCS was noted in patients with cancer, and the highest chance of better QoL was observed in patients with laryngological diseases.


