Introduction
Multiple myeloma (MM) represents the second most common hematological malignancy. It is characterized by the proliferative disturbance of plasma cells within the bone marrow, resulting in excessive accumulation of monoclonal immunoglobulins in the blood or urine [1]. Multiple myeloma is often clinically manifested by “CRAB” symptoms (hypercalcemia, renal dysfunction, anemia and bone lesions) [2]. Despite therapeutic improvements with wide combinative application of proteasome inhibitors, immunomodulatory agents, and monoclonal antibodies [3], MM remains an incurable disease with a high relapse rate and relatively poor prognosis [4].
The TP53 gene, a well-known tumor suppressive gene, is situated on chromosome 17p13.1 and codes for the p53 protein. The P53 protein is described as “the guardian of the genome” for its pivotal role in maintaining genomic integrity and cellular homeostasis [5, 6]. TP53 mutation is an adverse prognostic factor in various cancers, including solid tumors and hematological malignancies such as acute myelogenous leukemia (AML), acute lymphocytic leukemia (ALL), chronic lymphocytic leukemia (CLL), myelodysplastic syndrome (MDS) and MM [7, 8]. Compared with MM patients without a TP53 mutation, TP53-mutated patients have shorter overall survival (OS) and a bleaker prognosis. TP53 mutation is exclusively correlated with del(17p) in MM [9–13].
Autophagy is a highly-conserved multi-step metabolic process in which cellular proteins and organelles are engulfed by autophagosomes and then transported to lysosomes for degradation [14]. Tightly controlled and modulated by a cluster of autophagy-related genes (ARGs), it can be stimulated in adverse circumstances including nutrients deficiency, hypoxia and DNA damage. Autophagy plays a critical role in modulating cellular self-clearance, providing energy and maintaining homeostasis and survival by re-utilizing the components such as amino acids, fatty acids, and nucleotides [15]. Autophagy constitutes a double-edged sword in tumorigenesis and progression. Whether autophagy promotes or represses cancer depends on the type and stage of specific cancer, which renders targeting autophagy in cancer treatment controversial [16, 17]. In MM cells, proteasome inhibition brings about the accumulation of misfolded proteins, thus instigating endoplasmic reticulum (ER) overload and stress through the unfolded protein response. Autophagy functions as a prosurvival mechanism through which MM cells develop resistance to proteasome inhibitors and avoid excessive accumulation of toxic proteins [18]. So, targeting autophagy might be a promising therapeutic strategy to prompt cell apoptosis and restore drug sensitivity, thus augmenting the efficacy of conventional chemotherapy [19, 20].
The above results corroborated the vital role of autophagy in MM, and ARGs might have clinical application as potential prognostic biomarkers. In contrast with a single gene, a prognostic model incorporating multiple ARGs may greatly enhance the predictive performance. To date, there have been few studies integrating an ARG expression signature for predicting the survival outcomes of MM patients with TP53 mutations. The objective of this study was to establish a more accurate predictive model with an ARG signature. TP53-mutated MM patients were identified from the Gene Expression Omnibus (GEO) database and were subdivided into high and low risk groups in accordance with the median predictive value. By applying the CIBERSORT method, we also explored the distribution difference of 22 immune-infiltrating cell subsets within the bone marrow microenvironment between the two groups.
Material and methods
Patient information and dataset processing
GSE136400 datasets were acquired from the GEO database (GEO, https://www.ncbi.nlm.nih.gov/geo/) for the clinical characteristics, gene expression profile and OS information of MM patients.
ARGs were obtained by retrieving the Human Autophagy Database (HADb, http://autophagy.lu/clustering/index.html).
Differentially expressed genes (DEGs) in MM patients with or without TP53 mutations were identified and analyzed by means of linear models for microarray data (LIMMA, the “limma” package of R software) [21]. DEGs, including both significantly up-regulated and down-regulated genes, were determined using the Wilcoxon signed-rank test. The cut-off value was defined as the false discovery rate (FDR) < 0.05. The status of DEGs was demonstrated in a volcano plot and heatmap.
Enrichment analysis of differentially expressed autophagy-related genes (DEARGs)
We speculated that DEGs might be intersected with ARGs. We defined genes which overlapped on both databases as overlapping candidate genes (OCGs) or differentially expressed autophagy-related genes (DEARGs). Subsequently, both Gene Ontology (GO) functional enrichment analysis and Kyoto Encyclopedia of Genes and Genomes (KEGG) pathway analysis were conducted on DEARGs by using the “clusterProfiler” package in R software, with an adjusted p-value < 0.05 regarded as statistically significant [22]. Also, gene sets with an FDR score < 0.05 were regarded as noticeably enriched [23].
Survival analysis and establishment of prognostic model
Overall survival was calculated from the date of initial diagnosis until death from all causes or the last follow-up, whichever came first. Kaplan-Meier survival curves for OS were plotted with the purpose of comparing each potential highly and lowly expressed DEARG. The log-rank test was used to evaluate a DEARG which might be associated with the prognosis, with a p-value < 0.05 deemed statistically significant. Then DEARGs with potential prognostic value were initially selected by means of univariate Cox regression model. Least absolute shrinkage and selection operator (LASSO) regression was then utilized to eliminate false positive DEARGs because of over-fitting. DEARGs with a p-value < 0.05 in the univariate results were integrated into the multivariate analysis to determine the independent prognostic factors associated with OS and then construct a risk signature.
The risk score for each individual patient was quantified by the following formula: risk scores = Σi= 1,2...n β(DEARGi) × Exp(i), where β represents the regression coefficient for each DEARG derived from the multivariate Cox regression and Exp indicates the relative expression levels of each DEARG standardized by the Z-score. Patients (in the training set) were categorized into high- and low-risk groups using the median risk score as the threshold. A high risk score represented a bleaker prognosis than a low risk score. The survival difference between the above two groups was also evaluated by Kaplan-Meier curve and then the log-rank test. Univariate and multivariate Cox regression analyses were further carried out to determine whether the DEARG-based risk score could be an independent prognostic factor in TP53-mutated MM patients. We adopted time-dependent receiver-operating characteristic (tROC) analysis to explore the predictive accuracy of the prognostic model, which could be quantified by the area under the ROC curve (AUC).
Eventually, the “rms” package of R software was employed to construct the nomogram, which incorporated all independent prognostic parameters (perhaps including the DEARG-based risk model and other clinical factors), to give a more precise prediction of 5-year, 8-year and 10-year OS probability. Then, the concordance between actually observed and predicted survival was assessed through calibration curves, in which the 45° line denoted the best predictive performance.
CIBERSORT estimation of immune infiltration cells
The CIBERSORT (Cell type Identification By Estimating Relative Subsets Of RNA Transcripts) algorithm, which is available through a web portal (http://cibersort.stanford.edu/), is based on a machine-learning approach named support vector regression. The CIBERSORT algorithm was employed to calculate the proportions of 22 kinds of immune infiltrating cells including B cells, T cells, natural killer cells, macrophages, dendritic cells and so on [24]. For each TP53-mutated patient, the final CIBERSORT estimated-results were standardized and the proportions of 22 kinds of immune-infiltrating cells summed up to 1. We then evaluated the proportion differences between high- and low-risk groups on the basis of the DEARG-based score [25].
Data availability
The data that support the results of our study are available in Gene Expression Omnibus (GEO) datasets at https://www.ncbi.nlm.nih.gov/gds/. All original data throughout our manuscript are available upon reasonable request by communicating with the corresponding author.
Results
Identification of DEARGs and functional enrichment analysis
Information about 557 multiple myeloma patients with TP53 mutations and 400 cases without TP53 mutations was downloaded from GSE136400 datasets of GEO. Our study was mainly focused on TP53-mutated patients. The patient demographic and clinical characteristics are presented in Table I.
Table I
Characteristics of 557 TP53-mutated patients
Based on the criteria for FDR < 0.05 by using the “limma” package, we identified a set of 3329 DEGs between the TP53-mutated patients and TP53-unmutated patients, containing 2745 up-regulated and 584 down-regulated DEGs. The volcano plot and the heatmap of DEGs are presented in Figures 1 A and B respectively.
Figure 1
Differentially expressed genes between TP53-mutated patients and TP53-unmutated patients. A – Volcano plot of DEGs. Red nodes suggest up-regulated genes. Green nodes suggest down-regulated genes. Black nodes suggest genes without differences. B – Heatmap of top 100 DEGs. C – Venn diagram of 3329 DEGs (blue area) and 222 ARGs (orange area)
ARG – autophagy-related gene, DEG – differentially expressed gene, HAD – human autophagy database.
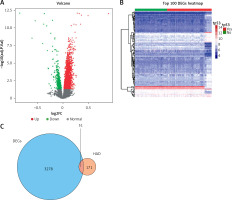
We extracted altogether 222 ARGs from the HADb database. Then 3329 DEGs were intersected with 222 ARGs and thus we obtained 51 OCGs called DEARGs. The Venn diagram of DEGs and ARGs is shown in Figure 1 C.
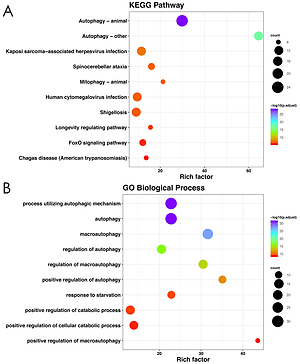
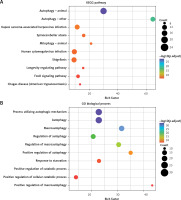
KEGG and GO enrichment analysis was conducted with the aim of providing a panoramic view of the biological function of 51 DEARGs, as presented in Figures 2 A and B. The more genes were enriched in the corresponding terms, the darker the color was. KEGG analysis indicated the signaling pathways which were implicated in autophagy, mitophagy and so on. GO analysis showed that regulation of autophagy was the main biological process and molecular function of DEARGs.
Figure 2
Functional enrichment analysis of 51 DEARGs. A – KEGG analysis reveals the signaling pathway in which DEARGs are involved. B – GO analysis reveals the biological process in which DEARGs are involved
DEARG – differentially expressed autophagy-related gene, GO – Gene Ontology, KEGG – Kyoto Encyclopedia of Genes and Genomes.
Screening and verification of prognosis-associated DEARGs by survival analysis
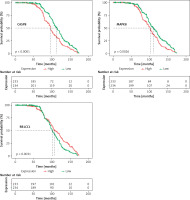
In a total of 557 TP53-mutated MM patients, 90 cases lacked survival information. Finally, 467 cases were included for further analysis. In order to identify the DEARGs associated with the prognosis, Kaplan-Meier curves for OS, the log-rank test and univariate Cox regression were performed by comparing the highly and lowly expressed DEARGs. A total of 9 prognosis-associated DEARGs were selected: ATG2A, ATG2B, BIRC6, CASP8, CCL2, CFLAR, MAPK1, MAPK8, RB1CC1. The above 9 DEARGs with a p-value < 0.05 in the univariate analysis were integrated into the LASSO regression model and multivariate Cox regression model. Finally, we obtained 3 DEARGs (CASP8, MAPK8, RB1CC1), which were independent risk factors. The survival curves for the above-mentioned 3 DEARGs are presented in Figure 3.
Establishment and estimation of risk score model for predicting OS
According to the multivariate Cox coefficients, the 3 DEARG-based risk score was constructed. The formula is: risk score = Exp(CASP8) * 0.73254 + Exp(MAPK1) * (–0.42603) + Exp(RB1CC1) * (–0.36719), in which Exp denotes the expression level of each DEARG.
We conducted the tROC analysis to determine the sensitivity and specificity of the predictive model. The results showed that the AUC values of the corresponding ROC curve for 5-year, 8-year and 10-year OS were 0.735, 0.686 and 0.662, respectively (Figure 4 A).
Figure 4
Prognostic analysis of three-DEARG risk-score model in the training set. A – Time-dependent ROC curve analyses indicate AUC values for 5-year (red), 8-year (yellow) and 10-year (green) OS. B – Kaplan-Meier OS curve of the high-risk (red) and low-risk (green) group. C – The risk-score distribution curve of high-risk (red) and low-risk (green) TP53-mutated patients in the OS model. D – Scattered plot reveals the OS status of TP53-mutated patients. Red dots suggest dead patients while green dots suggest patients who remain alive. E – Heatmap of the expression profiles of three DEARGs in the high- and low-risk group
AUC – area under the curve, DEARG – differentially expressed autophagy-related gene, OS – overall survival, ROC – receiveroperating characteristic curve.
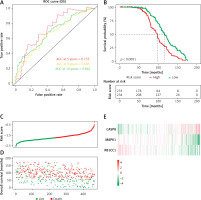
Then we calculated the risk score of individual patients, obtaining the median cut-off point of –1.724549. We categorized the patients into the high-risk group (n = 233) and low-risk group (n = 234) according to the median threshold value. As demonstrated in the Kaplan-Meier survival curve (Figure 4 B), the high-risk group had a bleaker prognosis compared with the low-risk group (p < 0.0001). Figure 4 indicates that the DEARG-based risk score performed well in OS prediction of TP53-mutated MM patients.
Construction of the nomogram prognostic model
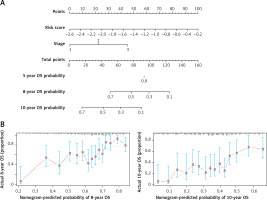
We further performed univariate and multivariate Cox regression to analyze the correlation between the risk-score model and age, gender and International Staging System (ISS). As is shown in Table II, DEARG-based risk score model (HR = 3.29, 95% CI: 2.35–4.60) and ISS stage (HR = 1.90, 95% CI: 1.57–2.30) are independent prognostic factors correlated with OS (p < 0.001). With the purpose of establishing a more accurate prognostic model, we constructed a nomogram which incorporated ISS stage and risk score to forecast the 5-year, 8-year and 10-year OS of TP53-mutated patients (Figure 5 A). However, the predictive outcome of 5-year OS was not achieved. The calibration plot verified that the predictive performance of the nomogram for 8-year and 10-year OS agreed roughly with the actual outcome (Figure 5 B).
Table II
Univariate and multivariate Cox regression analyses of OS
Subpopulations of immune-infiltrating cells by CIBERSORT estimation
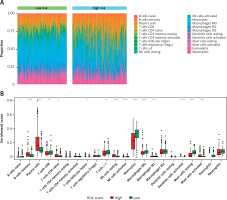
The proportions of immune-infiltrating cells were estimated by applying the CIBERSORT algorithm and the LM22 gene signature with 1000 permutations, which could discriminate the phenotypes of 22 immune-infiltrating cells both sensitively and specifically [26]. The immune cell infiltration landscape is presented in Figure 6. Then we analyzed the distribution differences between the high-risk group and low-risk group among the TP53-mutated MM patients. In altogether 22 immune-infiltrating cell subtypes, significant differences between the high- and low-risk groups were found in 13 immune cells, including plasma cells, monocytes, resting mast cells, activated NK cells, activated dendritic cells, resting NK cells, memory B cells, activated mast cells, naïve CD4+T cells, follicular helper T cells, γ δ T cells, macrophages (M0), and CD8+T cells (Table III). The levels of CD8+T cells, γ δ T cells, activated NK cells, activated dendritic cells, monocytes, resting mast cells, and macrophages (M0, M1) were lower in the high-risk group than the low-risk group (all p-value < 0.05), whereas the fractions of memory B cells, plasma cells, naïve CD4+T cells, resting NK cells, and activated mast cells were higher in the high-risk group (all p-value < 0.05). The results indicated that the proportion of different immune-infiltrating cells was closely associated with the aggressiveness and risk stratification and the DEARG-based risk signature might be correlated with the immune microenvironments of TP53-mutated MM.
Table III
Distribution differences of 22 immune-infiltrating cells
| Cell type | P-value |
|---|---|
| Plasma cells | 4.98E-17* |
| Monocytes | 1.41E-16* |
| Resting mast cells | 1.03E-15* |
| Activated NK cells | 9.36E-10* |
| Activated dendritic cells | 3.72E-09* |
| Resting NK cells | 6.51E-09* |
| Memory B cells | 1.00E-08* |
| Activated mast cells | 9.34E-06* |
| Naïve CD4+T cells | 1.57E-03* |
| Follicular helper T cells | 3.86E-03* |
| Gamma delta T cells | 8.32E-03* |
| M0 macrophages | 1.99E-02* |
| CD8+ T cells | 2.41E-02* |
| Resting dendritic cells | 1.63E-01 |
| Naïve B cells | 1.70E-01 |
| Eosinophils | 2.35E-01 |
| Neutrophils | 3.49E-01 |
| Regulatory T cells (Tregs) | 3.96E-01 |
| M1 macrophages | 4.96E-01 |
| M2 macrophages | 5.46E-01 |
| Activated memory CD4+T cells | 5.62E-01 |
| Resting memory CD4+ T cells | 7.12E-01 |
Figure 6
Immune cell infiltration landscapes in high- and low-risk MM patients with TP-53 mutations according to DEARGs. A – Unsupervised clustering of 22 immune-infiltrating cells in 467 patients in the high- and low-risk group. B – Differences of immune cell infiltration abundances between high- and low-risk patients
ns – not significant (p > 0.05), *p < 0.05, **p < 0.01, ***p < 0.001, **** p < 0.0001. DEARG – differentially expressed autophagy-related gene, MM – multiple myeloma.
Discussion
Autophagy, a complicated multi-step self-digestion process, is regulated by multiple ARGs to guarantee homeostasis, energy supply and re-utilization [27]. A higher level of basal autophagy is often observed in MM cells and autophagy is vital for MM cell survival. Multiple myeloma cell apoptosis can be induced by autophagy disturbance via BECLIN-1 knockdown or pharmacologic repression with chloroquine or 3-methyladenine [28]. Our team revealed that autophagy inhibition by pharmacological methods augmented apoptosis in DNA-damaged MM cells and knockdown of beclin1 or ATG5 resensitizes MM cells to apoptosis induced by DNA-damaging agents [19]. Also, induction of autophagy forcefully strengthened chemoresistance to gemcitabine in bladder carcinoma [29].
Recently, many risk models based on ARG signatures were established to forecast the survival outcomes of patients with non-small cell lung cancer [30], breast cancer [31], clear-cell renal cell carcinoma [32, 33], colorectal cancer [34], serous ovarian cancer [35], glioblastoma multiforme [36], prostate cancer [37] and bladder cancer [38]. So far, the prognostic effects of ARGs in TP53-mutated MM have not been comprehensively investigated. Therefore, our study screened and finally identified three ARGs (CASP8, MAPK8, RB1CC1) to establish a risk model and predict the patient’s survival.
The CASP8 gene is located on chromosome 2q33-34 and encodes caspase-8, which is a canonical cysteine protease for the initiation and execution of cell apoptosis. Caspase-8 serves as a key component of death receptor-induced programmed cell death and is regarded as a tumor suppressor [39]. Previous studies demonstrated that activated caspases are also implicated in autophagy inhibition via cleaving autophagy-related proteins (Beclin-1, Atg5, and p62) [40, 41]. MAPK8 (mitogen-activated protein kinase 8) encodes Jun N-terminal kinase-1 (JNK1) and is the hallmark of the famous MAPK signaling pathway, which is involved in the DNA damage response, autophagy, tumorigenesis and progression. RB1CC1 (retinoblastoma coiled coil protein 1), also named FIP200 (FAK family-interacting protein of 200 kDa), serves as a constituent of the ULK1-ATG13-RB1CC1 or RB1CC1-ATG101 complex and plays an essential role in autophagosome formation. RB1CC1 is situated both in the nucleus and in the cytoplasm. RB1CC1 modulates intracellular signaling pathways through interacting with TSC1, p53, and PIASy, thus affecting the cell cycle, cell proliferation and differentiation [42, 43].
Traditional ISS only incorporated laboratory parameters such as serum albumin, lactate dehydrogenase, and β2-microglobulin. Cytogenetic abnormalities were introduced into the Mayo clinic risk stratification for multiple myeloma (mSMART), which integrated del(17p), gain(1q), t(4;14), t(14:16), t(14;20) [2]. Both ISS and mSMART exhibited limited performance in MM risk stratification. We performed multivariate analysis to verify whether this three-DEARG-based risk model for survival prediction is independent of other prognostic covariates. Furthermore, we constructed a nomogram to forecast the 5-year, 8-year and 10-year OS of an individual patient. Nomograms have been widely used to quantitatively determine the clinical outcome at an individual level by combining each independent factor.
Immune-infiltrating cells constitute an integral part of the tumor microenvironment. By applying a machine-learning approach termed support vector regression, CIBERSORT is considered the most accurate algorithm, which allows for highly sensitive and specific discrimination and quantification of the proportions of 22 human immune infiltrating cells. CIBERSORT has also been used in construction of an immune-related risk model for several cancer types. Recently, accumulating research has investigated the effects of the immune microenvironment on various cancers, including lung squamous cell carcinoma [44], hepatocellular carcinoma [45, 46], cholangiocarcinoma [47], colon cancer [48, 49], breast cancer [50] and cutaneous melanoma [51], which indicated that the infiltration of different types of immune cells might be an encouraging potential source of prognostic markers. Our study revealed that immune cells with a tumor-killing effect in the high-risk group constituted smaller proportion than their counterparts in the low-risk group, which is consistent with previous research on gastric cancer [52]. Our results revealed the distribution differences of tumor-infiltrating immune cells in TP53-mutated MM patients according to the risk. The association between the immune microenvironment and risk stratification in MM patients should be investigated in future research.
There existed several unavoidable limitations in our study. Firstly, all enrolled patients were derived only from the GEO database with a limited sample size. We could not retrieve suitable cohorts from another database, such as The Cancer Genome Atlas (TCGA) database. Secondly, like most of the public databases, the GEO database lacks the important laboratory results about individual MM patients, such as hemoglobin, creatinine, free light chain, monoclonal immunoglobulin and many other prognostic parameters. Thirdly, information with regard to disease progression, relapse or recurrence, infection, comorbidities and complications was neither recorded nor collected in the GEO database. Moreover, the specific therapeutic regimens, including drug doses and administration frequency, were also not recorded. Fourthly, the DEARG risk model was established on a retrospective cohort and we were unable to find external validation datasets to further verify the accuracy and robustness of our model, which needs further validation in other independent prospective cohorts. Lastly, functional experiments both in vivo and in vitro are warranted in future to explore the mechanisms of DEARGs in our model.
In conclusion, our study identified multiple ARGs which were correlated with the survival outcomes of TP53-mutated patients. By incorporating CASP8, MAPK8 and RB1CC1, we established a three-ARG risk signature which turned out to be an independent prognostic factor. Furthermore, by integrating the risk model with ISS stage, we constructed a nomogram which performed well in predicting long-term survival of MM patients with TP53 mutations.


