Introduction
Ischemic stroke presents an extremely high incidence across the world and is considered a major factor inducing disability and mortality, causing a heavy burden on patients, their families, and society as a whole [1–5]. Intravenous thrombolysis is the most effective drug therapy for the early management of patients with acute ischemic stroke (AIS) [6, 7]. Endovascular intervention can be performed early in the onset of ischemic stroke, and it has also been found that [8] the benefits and adverse events of intravenous thrombolysis and vascular intervention for ischemic stroke of unknown onset are similar. However, even after receiving intravenous thrombolysis, certain patients continue to have neurological deficits, which seriously affect their daily lives and could even lead to death in severe cases. Therefore, accurate and early prediction of the clinical survival of individual stroke patients receiving alteplase treatment is crucial as it would guide the clinical management and treatment decision-making for these patients [9].
In the past few decades, numerous studies have been reported on the construction of prognosis nomograms using various statistical tools for the prediction of long-term prognosis in AIS patients receiving intravenous thrombolysis [10–13]. A nomogram is a graphical and visual statistical tool that enables calculation of scores based on the clinical characteristics of individual patients for predicting the likelihood of poor survival [14, 15]. In particular, the START [16] (National Institute of Health Stroke Scale score, age, pre-stroke Modified Rankin Scale (MRS) score, onset-to-treatment Time) nomogram for prediction of poor functional prognosis and the STARTING-SICH [17] nomogram for prediction of the incidence of sICH after intravenous thrombolysis are useful tools.
The present study focused on developing and then validating a convenient and credible nomogram model for AIS patients receiving intravenous thrombolysis at our central hospital. In order to achieve a stronger predictive effect using the model, laboratory test results and clinical features were used as variables for prediction of the 3-month prognostic outcome of individual AIS patients receiving intravenous thrombolysis.
Material and methods
Research subjects
The present study followed the Declaration of Helsinki. In addition, approval for the study was obtained from the Ethics Committee of Advanced Stroke Center Hospital (ethical batch number: 2022–063). The study was designed as a retrospective one, conducted with ASI patients receiving intravenous thrombolysis with alteplase at the stroke center of our institute between January 2016 and August 2022. The patients finally included in the study were randomized to training and testing groups on a 7 : 3 basis. Whether intravenous thrombolysis should be implemented was decided by the responsible doctor based on the current guidelines [18, 19]. Each patient received intravenous thrombolysis within 4.5 h after disease onset at the standard clinical dosage of 0.9 mg/kg. Written informed consent for participation in the study was obtained from all patients (or their families). Patients with a stroke history prior to disease onset and an mRS score of ≥ 2, those who received intravascular therapy, those who died within 24 h of receiving the thrombolysis, those diagnosed with other stroke-like diseases after admission, those with incomplete validation data, and patients who did not attend follow-up were excluded from the study.
Data collection
The demographic data on patient characteristics, vascular risk factors, laboratory test indicators, individual information, clinical examination results, and follow-up information were collected.
The vascular risk factors included diabetes, hypertension, hyperlipidemia, coronary heart disease, smoking status (current or history), hyperhomocysteinemia (HCY), and atrial fibrillation. The hypertension factor referred to previously diagnosed hypertension, consuming oral antihypertensive drugs, or a post-hospitalization blood pressure of ≥ 140/90 mm Hg. Diabetes mellitus means having been treated with glucose-lowering medication, including insulin, during hospitalization or having been diagnosed with diabetes. The coronary heart disease factor referred to a clear diagnosis of coronary heart disease in the past or upon admission. Hyperlipidemia referred to the prior administration of lipid-lowering drugs, or the levels of triglyceride (TG) ≥ 1.70 mmol/l, total cholesterol (TC) ≥ 5.18 mmol/l, high-density lipoprotein cholesterol (HDL) ≤ 1.04 mmol/l, or low-density lipoprotein cholesterol (LDL) ≥ 3.37 mmol/l, during hospitalization. A history of stroke included prior ischemic stroke, transient ischemic attack, and hemorrhagic stroke. Atrial fibrillation referred to a previous diagnosis of atrial fibrillation or atrial fibrillation revealed in the electrocardiogram after admission. Smoking included current or past smoking and indicated cumulative or permanent smoking for 6 months or beyond during the life of the patient, with ≥ 1 cigarette daily. Hyperhomocysteinemia referred to a total blood homocysteine level of ≥ 10 μmol/l.
The laboratory examination results collected upon admission included the baseline blood glucose levels (Glu), hemoglobin (Hb) count, white blood cell (WBC) count, platelet (PLT) count, neutrophil (N) count, lymphocyte (L) count, monocyte (M) count, eosinophil (E) count, the ratio of neutrophils to lymphocytes (NLR), platelet to neutrophil ratio (PNR), monocyte to neutrophil ratio (MNR), neutrophil to eosinophil ratio (NER), eosinophil to monocyte ratio (EMR), prothrombin time (PT), international normalized ratio (INR), partially activated prothrombin time (APTT), and prothrombin time activity (PTA). Other laboratory test results included the levels of blood homocysteine (HCY), lactate dehydrogenase (LDH), brain natriuretic peptide (BNP), uric acid (UA), creatinine (CR), TG, TC, HDL, and LDL, the HDL/LDL ratio, the ratio of monocytes to HDL (MHR), and the ratio of neutrophils to HDL (NHR). The samples for all of the above tests were collected after fasting in the morning following admission.
The clinical examination data that were collected included the baseline National Institute of Health Stroke Scale (NIHSS) score (i.e., the NIHSS score prior to thrombolysis), the post-thrombolysis NIHSS score (i.e., the NIHSS score immediately after thrombolysis, A-NIHSS), the baseline systolic blood pressure (SBP), the baseline diastolic blood pressure (DBP), the onset-to-treatment time (OTT), and the door-to-needle time (DNT).
Outcome measures
Patient condition was evaluated based on the 3-month modified Rankin Scale (mRS) [20] score. The mRS score of 3–6 indicated a poor prognosis while the mRS score of 0–2 indicated a favorable prognosis.
Statistical analysis
The R statistical software (Version 4.0.2; R Foundation for Statistical Computing, Vienna, Austria) was employed for the statistical analysis of the results data. The Kolmogorov–Smirnov goodness of fit test was conducted to analyze the continuous variables. The normally distributed continuous variables were presented as mean ± standard deviation, while the abnormally distributed continuous variables were presented as median and quartile range (IQR). The categorical variables were presented in terms of frequency and percentage (%). Variables screened by the LASSO regression analysis were included in the subsequent multifactor logistic regression analysis. Variables with p < 0.05 from the multifactorial logistic regression analysis were considered statistically significant. A nomogram was drawn based on the results obtained using this multifactor logistic regression model. All data were entered into the R system and randomly divided into the training and validation cohort on a 7 : 3 basis [21]. A validation cohort was then used for the internal validation of the constructed nomograms. The predictive ability of each model was determined based on the area under the receiver operating characteristic curve (AUROC) using the bootstrap method with a resampling frequency of 1000 to verify that the model was adequately calibrated. The calibration curve was drawn to illustrate the fit goodness between the model-predicted and measured results.
In addition, a decision curve analysis (DCA) [22, 23] was performed to evaluate the clinical feasibility of the model.
Results
The data of 709 patients (median age, 65 years; 67% male) were collected for the final statistical analysis. 496 patients were included in the training cohort, while 213 patients were included in the validation cohort. The results revealed a poor prognosis for 41.61% (n = 295) of patients after 3 months.
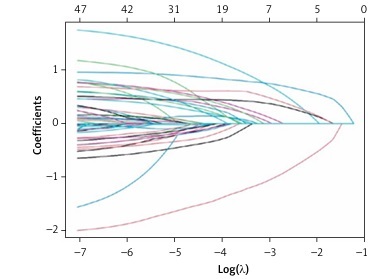
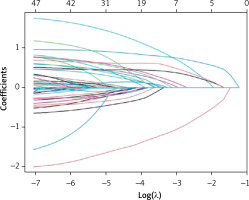
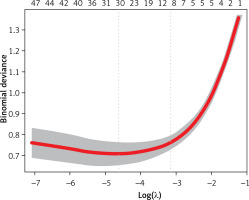
Tables I–IV show a comparison of the basic features of patients with unfavorable and unfavorable prognosis. Variables with p < 0.05 were factors that potentially predicted poor patient prognosis at 3 months. These variables were age, drinking, DNT, atrial fibrillation, diabetes, SBP, baseline NIHSS score, NIHSS after thrombolysis, HB, N, NLR, PNR, M, NER, GLU, BNP, LDH, TG, HDL, HCY, HDL/LDL, MHR, and NHR. Therefore, these variables were used in the subsequent multivariable logistic regression. Due to the large number of variables and to avoid interfering with each other, LASSO regression was used to screen the statistically significant predictive factors among all variables in the training set (Figures 1 and 2).
Table I
Comparison of baseline characteristics between patients with 3-month favorable outcome and unfavorable outcome in the cohort
Table II
Comparison of patients with 3-month favorable outcome and unfavorable outcome in the cohort in baseline characteristics of vascular risk factors
Table III
Comparison of patients with 3-month favorable outcome and unfavorable outcome in the cohort in baseline characteristics of general laboratory tests
Table IV
Comparison of patients with 3-month favorable outcome and unfavorable outcome in the cohort in baseline characteristics of ratio of laboratory tests
Then, variables screened by LASSO regression analysis were subjected to multifactorial logistic regression analysis (p < 0.05). We conclude that BNP (odds ratio (OR) = 1.78; 95% confidence interval (CI): 0.99–3.17; p = 0.025), DNT (OR = 2.49; 95% CI: 1.62–3.81; p < 0.001), HCY(OR = 5.27; 95% CI: 2.99–9.29; p < 0.001), HDL (OR = 0.30; 95% CI: 0.12–0.79; p = 0.015), MHR (OR = 2.58; 95% CI: 1.57–4.26; p < 0.001), NHR (OR = 2.61; 95% CI: 1.04–6.51; p = 0.040) and post-thrombolysis NIHSS (OR = 3.46; 95% CI: 2.37–5.07; p < 0.001) (BDH2–MN2) were independent predictors of unfavorable outcome. The results of multivariable analyses for the 3-month outcome are shown in Table V.
Table V
Independent risk factors associated with 3-month poor outcomes after intravenous thrombolysis in the training cohort
Figure 3 depicts the BDH2–MN2 nomogram based on variables. The column chart was utilized to obtain the corresponding score of each predictive factor, and the total score was obtained by summing the scores of every prediction factor. The total score corresponded to the prediction probability of an individual patient.
Figure 3
The BDH2-MN2 Nomogram for predicting the 3-month outcome. Points were assigned for BNP, DNT, HCY, HDL, MHR, NHR and Post-thrombolysis NIHSS by drawing a line upward from the corresponding values to the “points line”. The “total points” are calculated as the sum of the individual score of each of the seven variables included in the nomogram
BNP – brain natriuretic peptide, DNT – door-to-needle time, HCY – homocystine, HDL – high-density lipoprotein cholesterol, MHR – the ratio of monocytes to high-density lipoprotein cholesterol, NHR – the ratio of neutrophil to high-density lipoprotein cholesterol, NIHSS – National Institutes of Health Stroke Scale. Using these seven predictive factors, the BDH2-MN2 nomogram was developed to assess the probability of 3-month unfavorable outcome in these patients.
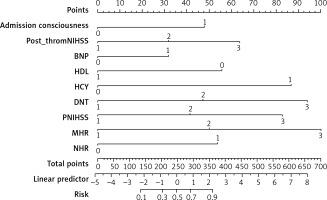
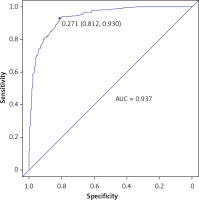
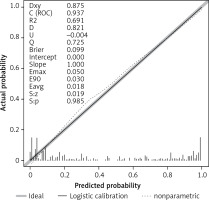
Figure 4 depicts the ROC curve of the training cohort, based on which the AUC-ROC value for the training cohort was determined to be 0.937 (95% CI: 0.822–0.954).
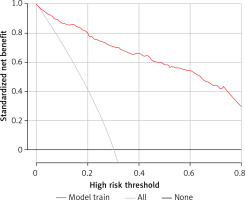
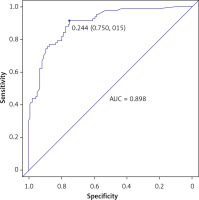
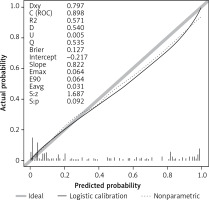
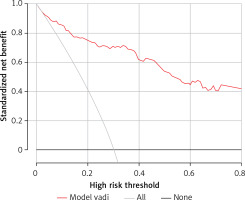
According to the calibration curve depicted in Figure 5 and the DCA presented in Figure 6, for the nomogram developed in the present study for the training cohort, the AUC-ROC value for the validation set was determined to be 0.898 (95% CI: 0.748–0.921). The C-statistic of the developed prediction model was greater than 0.7 for both modeling and validation sets, which indicated a good ability to distinguish patients with poor prognosis from those with good prognosis (Figure 7). Figures 8 and 9 present the calibration plot and DCA of the nomogram for the validation cohort, respectively.
Discussion
The results of the present study revealed BNP, DNT, HCY, HDL, MHR, NHR and post-thrombolysis NIHSS as independent predictors of dismal prognostic outcomes in AIS patients receiving intravenous thrombolysis with alteplase for 3 months. These seven predictive factors were then used for plotting a BDH2–MN2 nomogram to evaluate the likelihood of adverse outcomes in AIS patients at 3 months after receiving intravenous thrombolysis.
All of the predictive variables included in the model were derived from routine clinical examinations and were easily obtainable. Most of these variables are reportedly related to dismal prognostic outcomes in AIS patients. The use of the NIHSS score upon admission enables assessing the initial stroke severity [24, 25], while the post-treatment NIHSS serves as a marker for stroke severity for better prediction of the clinical and functional prognosis of patients [26]. The changes in the NIHSS score after thrombolysis could reflect the ischemia-reperfusion situation in stroke patients and make it possible to distinguish, to a certain extent, between clinically effective and ineffective or no reperfusion patients. Heart Failure Measurement Human Cerebral Sodium Lipids BNP also predict stroke prognosis [27]: the higher the patient’s BNP level, the higher the risk of stroke. Door-to-needle time [28, 29] is another important factor that determines the prognosis of stroke patients. The survey study conducted by investigators such as Shumel [30] in the United States revealed that among patients aged 65 years or over who received intravenous thrombolysis, a shorter DNT time was associated with a lower mortality rate after 1 year. The shorter the thrombolytic time, the earlier it could save the ischemic penumbra and restore blood flow reperfusion. In particular, for patients with mild [31] ischemic stroke, the longer the DNT time, the worse was the patient’s prognosis after discharge. The baseline blood glucose [32, 33] level is also an important factor in determining prognosis. The baseline blood glucose level and the fluctuation variability of blood glucose are related to the early neurological improvement of AIS patients after receiving intravenous thrombolysis with alteplase. With the increase in the blood glucose level and fluctuation range, the inflammatory response also increases, which affects patient prognosis [34]. A high serum level of homocysteine [35, 36] could indicate poor clinical outcomes of thrombolytic therapy in AIS patients. Monocytes are important immune modulators driving the inflammatory response after ischemia [37, 38]. Monocytes are capable of infiltrating the infarcted region and worsening brain damage. The occurrence of AIS induces cerebral hypoxia and ischemia, which promote the generation of inflammatory factors in monocytes, including the tumor necrosis factor, intercellular adhesion molecule 1, chemokines, interleukin-1, interleukin-6, and interleukin-8. The consequent excessive inflammation leads to neuronal hypoxia and ischemia in the penumbra of cerebral infarction, thereby exacerbating the damage to the brain tissue. Monocytes contribute to activating platelets and bind to the activated platelets, forming platelet-monocyte aggregates, resulting in the accumulation of white blood cells in the ischemic brain region, thereby exacerbating the damage caused to the ischemic brain cells. T-lymphocytes and monocytes/macrophages exert important effects on the pathogenic mechanism of stroke, thereby increasing the generation and infiltration of inflammatory factors and lipid core formation, which leads to brain damage and the formation of atherosclerotic plaques [39], enabling better prediction of the prognosis of patients receiving intravenous thrombolysis. In contrast, HDL [40] exhibits different activities, such as anti-inflammation, antioxidation, and anti-thrombosis, by preventing endothelial dysfunction and cholesterol transport. The HDL molecule regulates macrophage activation, migration, and adhesion, in addition to modulating the growth of monocyte-differentiating progenitor cells. HDL exerts anti-inflammatory effects on adipocytes and macrophages, which is modulated by cholesterol transporters such as scavenger receptor B-1 (SR-B1), ATP-binding cassette A-1, ATP-binding cassette G-1, and transcriptional regulatory factor ATF3 and counteract toll-like receptor (TLR)-mediated inflammatory responses. HDL [41] also exhibits antioxidation via HDL-related anti-oxidases, including platelet-activating factor acetylhydrolase (PAF-AH) and paraoxonase 1 (PONl), thereby inhibiting LDL oxidation and oxidative stress within endothelial cells and removing the potentially cytotoxic circulating lipid hydroperoxides. HDL enhances antithrombotic formation and endothelial repair by increasing the bioavailability of NO within the blood vessels. Therefore, MHR [42] could be used as a systemic inflammatory marker of atherosclerosis. MHR [43] was recently confirmed as a novel prognostic factor for acute cerebral hemorrhage, cardiovascular disease, and ischemic stroke. Consequently, monocytes exhibit pro-inflammatory activities, while HDL plays the opposite role. Monocytes and increased MHR are composite biomarkers for the HDL level and monocyte count, respectively, which could be used jointly for predicting the prognostic outcome of stroke patients receiving intravenous thrombolysis. In the present study, although hypertension and HCY were revealed as independent predictors of poor prognosis after adjusting for the confounding factors through multivariate logistic analysis, their contribution to the predictive ability of the final model was relatively small.
The AUROC of the developed nomogram was 0.937 (95% CI: 0.822–0.954),which is higher than the value of the START nomogram (AUC = 0.766; 95% CI: 0.707–0.826). Compared with START, the nomogram includes not only the patient’s general information and profile, but also laboratory test data, and hence is more convincing and accurate. In the proposed nomogram, although certain variables were derived from examinations conducted 24 h after receiving thrombolysis or in the morning after admission, these variables could nonetheless be used for screening the patients at high risk of adverse outcomes and, therefore, requiring further intensive treatment, such as neuroprotective drugs and intensive rehabilitation therapy. In addition, from the perspective of clinical doctors, the use of certain predictive indicators, such as nomograms, intuitively and conveniently explains the prognostic outcomes of patients.
DCA is an indicator used for evaluating the predictive value and clinical feasibility of models (such as nomograms). The nomogram constructed in the present study mainly focused on distinguishing high-risk patients from low-risk patients who had dismal prognostic outcomes. According to the different probability thresholds used, the maximum net efficiency of the prediction model was optimal. The DCA obtained in the present study revealed that the proposed final nomogram offered a greater net benefit in predicting the outcomes compared to using the initial NIHSS score alone. The model is, therefore, suitable for use in clinical practice for prediction of the prognosis of AIS patients receiving intravenous thrombolysis and thereby identifying patients requiring further intensive treatment at the earliest.
As with all research, the present study also had certain limitations. First, the training cohort was formed using data from a unicentric database, which was small in size. In addition, certain variables related to the AIS outcomes reported in previous studies (such as age [44], gender [45], onset-to-treatment time [46], hypertension [47], etc.) were not reported in the present study. Further, the validation cohort and the training cohort were from the same stroke center. Future studies could further validate the predictive ability of the proposed nomogram using cohorts from other centers.
In conclusion, a reliable BDH2–MN2 nomogram model was constructed and validated in the present study. The model comprised seven indicators, namely, BNP, DNT, HCY, HDL, MHR, NHR and post-thrombolysis NIHSS. The developed nomogram could individually predict adverse outcomes in AIS patients receiving intravenous thrombolysis with alteplase at 3 months. Therefore, the model could be used for identifying patients requiring further intensive treatment at the earliest.


