Introduction
Acute ischaemic stroke (AIS) represents the most prevalent subtype of strokes, characterised by high rates of relapse, disability, and mortality [1, 2]. Global therapeutic expenses for AIS have consistently escalated over the years. While intravenous thrombolysis stands as an internationally recognised early treatment [3, 4], its efficacy is limited because many patients experience unfavourable outcomes or further exacerbation of symptoms, including thrombolytic haemorrhage [5], ultimately leading to fatality.
Hence, investigating the risk factors associated with poor prognosis following intravenous thrombolytic therapy is crucial for AIS patients. There is growing recognition of the pivotal role of inflammatory response in AIS development, progression, and prognostic outcomes [6]. Dyslipidaemia and inflammatory responses are known to foster the occurrence of atherosclerosis [7].
Monocyte-to-high-density lipoprotein-cholesterol ratio (MHR) is a combination of inflammatory response and lipid metabolism. Approximately 5% of strokes are caused by carotid atherosclerosis, and the inflammatory response plays an important role in the development, progression, and clinical prognosis of AIS due to carotid atherosclerosis. Monocytes [8] can produce reactive oxygen species and differentiate into foamy macrophages, releasing pro-inflammatory cytokines; high-density lipoprotein cholesterol (HDL-C) [9] can inhibit monocyte activation and macrophage migration via apoA-I-mediated CD11b, inhibit p38 activation and inositol phosphokinase activity, and promote reverse cholesterol transport, which possesses anti-inflammatory, antioxidant, anti-atherosclerotic, and antithrombotic effects. The MHR [10], a convergence point of dyslipidaemia and inflammatory pathways, has recently garnered attention as an indicator of inflammatory response and is closely associated with various chronic inflammatory disorders.
MHR strongly correlates with the occurrence and progression of atherosclerosis, making it a potential serum prognostic marker for ischaemic cerebrovascular disease [11]. Some studies have underscored the significance of MHR in predicting early clinical prognostic outcomes in AIS patients [12, 13]. However, there remains a gap in research concerning the relationship between MHR and prognostic outcomes following intravenous thrombolysis. This study aimed to investigate the significance of MHR in predicting the prognostic outcomes of AIS patients who have undergone intravenous thrombolysis. There is an independent correlation between MHR and poor prognosis at 3 and 6 months in AIS patients receiving intravenous thrombolysis treatment.
Material and methods
Study population
The present retrospective observational study spanned from January 2017 to July 2022. AIS patients who received intravenous thrombolysis using recombinant tissue plasminogen activator (rt-PA) at our national advanced stroke centre were included. Approval for this study was obtained from the Research Ethics Committee of our hospital (ethics approval number: 2022–063). Written informed consent was acquired from each patient or their respective guardian before participation.
The inclusion criteria were as follows: (1) age ≥ 18 years; (2) meeting indications for intravenous thrombolysis; and (3) obtaining informed consent from patients or guardians (including re-stroke patients and patients under antiplatelet therapy). The exclusion criteria were as follows: (1) individuals with a stroke history having a modified Rankin scale (mRS) score > 2 before the current episode; (2) recipients of endovascular therapy; (3) diagnosed with stroke-like illness post-admission; (4) currently not taking any medication that affects blood lipids; (5) lacking essential test data required for analysis; and (6) patients who were lost to follow-up.
Patients diagnosed with stroke were divided into anterior or posterior circulation groups based on the varied sites of lesion infarction. The aetiological diagnosis was categorised according to the classic 1993 TOAST typology proposed by Adams et al. from the United States [14]. This typology includes the atherosclerotic type of large arteries, small artery occlusion, cardiogenic embolic race, stroke of unclear cause, or stroke of additional known aetiology.
Intravenous thrombolysis using rt-PA
AIS patients were primarily admitted to our institution to undergo cranial CT scans to rule out cerebral haemorrhage. Subsequently, patients were treated with intravenous thrombolysis using rt-PA at the standard dose of 0.9 mg/kg (Boehringer Ingelheim, Germany, in 20- and 50-mg sizes) within 4.5 h post onset [15]; 10% of the total dose was administered intravenously over 1 min, while the remaining dose was administered through intravenous pumping using a continuous micropump over a 60-minute period. The maximum administered rt-PA dose was less than 90 mg.
Clinical and laboratory test results
We gathered various patient data, including basic characteristics, vascular risk factors, medication history, severity of the current stroke, baseline clinical examination and laboratory findings, details about the ongoing treatment, and follow-up information for each patient.
The general baseline data included age, sex, body mass index (BMI), diastolic blood pressure (DBP), systolic blood pressure (SBP) at admission, and vascular risk factors (diabetes mellitus, hypertension, atrial fibrillation, coronary artery disease, history of previous stroke, hyperlipidaemia, smoking, or alcohol consumption). Smoking history was defined as consuming more than one cigarette per day for over 6 consecutive months, while alcohol consumption was defined as more than 50 g/d for over one year. Laboratory tests included baseline blood glucose, haemoglobin (Hb) count, white blood cell count, platelet count, neutrophil (N) count, neutrophil percentage, lymphocyte (L) count, monocyte (M) count, eosinophil (E) count, and various ratios, including neutrophil-to-lymphocyte ratio (NLR), platelet-to-neutrophil ratio (PNR), neutrophil-to-eosinophil ratio (NER), and eosinophil-to-monocyte ratio (EMR). Other laboratory data encompassed international normalised ratio, prothrombin time (PT), prothrombin time activity (PTA), partially activated prothrombin time (APT), and activated partial thromboplastin time (APTT). Other laboratory information included blood homocysteine (HCY) levels, heart failure measurement, brain natriuretic peptide, lactate dehydrogenase, creatinine, uric acid, total cholesterol, triglycerides, HDL-C, LDL-C, blood glucose levels, HDL-C/LDL-C ratio, monocyte-to-HDL-C ratio (MHR), and neutrophil-to-HDL-C ratio (NHR). These measurements were collected in the morning on the second day following patient admission on an empty stomach.
Clinical information collected included baseline National Institute of Health stroke scale (NIHSS) score (before thrombolytic therapy), post-thrombolytic NIHSS score, basic SBP and DBP, onset-to-treatment time (OTT), neutrophil-to-HDL-C ratio (NHR), granulocyte-to-HDL-C ratio, OTT, and door-to-needle time, indicating the time from hospitalisation to drug administration.
Prognostic assessment
All AIS patients were clinically assessed at 3 and 6 months after intravenous thrombolysis treatment using a mRS [16]. These patients were categorised into groups with either a favourable (mRS score ≤ 2) or unfavourable (mRS score > 2) prognosis. Clinical prognostic data were obtained through telephone follow-ups and face-to-face visits at 3 and 6 months [17] and were evaluated by 2 qualified senior neurologists unaware of the patient’s details. A third senior physician was consulted in the case of disagreement.
Statistical analysis
For data analysis, R software (version 4.0.2; R Foundation for Statistical Computing, Vienna, Austria) was used. The Kolmogorov-Smirnov test assessed the normal distribution of continuous variables. Continuous data were presented as the median and interquartile range (IQR), while categorical data were represented by frequency and percentage (%). The χ2 test compared categorical data among different groups, and the Mann-Whitney U test compared continuous data. Binary logistic regression was performed to evaluate odds ratios (ORs) with 95% confidence intervals (CIs) for stroke outcomes, using different temporal outcome metrics (3-month poor prognosis and 6-month poor prognosis) as dependent variables. Variables with p < 0.1 in univariable regression were included in subsequent multivariable logistic regression, screened by the stepwise method. Variables with p < 0.05 after multivariable logistic regression were considered statistically significant. Receiver operating characteristic (ROC) curves were used to determine the critical significance of variables, and their maximum Youden exponent values were used for dichotomising the target variables. Propensity score matching (PSM) at a 0.05 calliper using the nearest neighbour method was performed for 1: 1 matched adjustment to account for confounders based on baseline factors with a standardised mean difference of > 0.10.
Results
A total of 826 AIS patients were admitted for this study. Among them, 28 received endovascular bridging, 18 lacked sufficient clinical information, 11 had pre-morbid mRS scores > 2, 3 were lost to follow-up, and 3 had stroke-like disease.
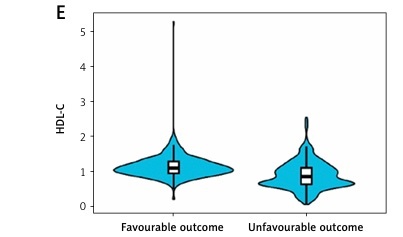
Finally, 763 patients were available for statistical analyses (Table I). Their median age was 65 years (IQR: 55–72 years), with a body mass index (BMI) of 24.80 kg/m2 (IQR: 22.22–27.04), of whom 508 (66.58%) were male patients. Concerning stroke aetiology, 76.5% of patients had large-artery atherosclerotic strokes, 14.2% had small-artery occlusive strokes, 7.9% had a cardiac cerebral embolism, and the remaining 1.5% had strokes of other well-defined and unknown aetiologies. The median baseline NIHSS score was 5 (IQR: 2–11), median OTT was 128 min (IQR: 92–176 min), and median outpatient-to-drug-administration time was 50 min (IQR: 35–73 min) for enrolled patients. At the 3-month mark, 329 (43.1%) patients exhibited a dismal prognostic outcome, while 355 patients (46.5%) did so at 6 months. The distribution of MHR, M, and HDL-C in the study population is illustrated in Figure 1.
Table I
Baseline characteristics (n = 763)
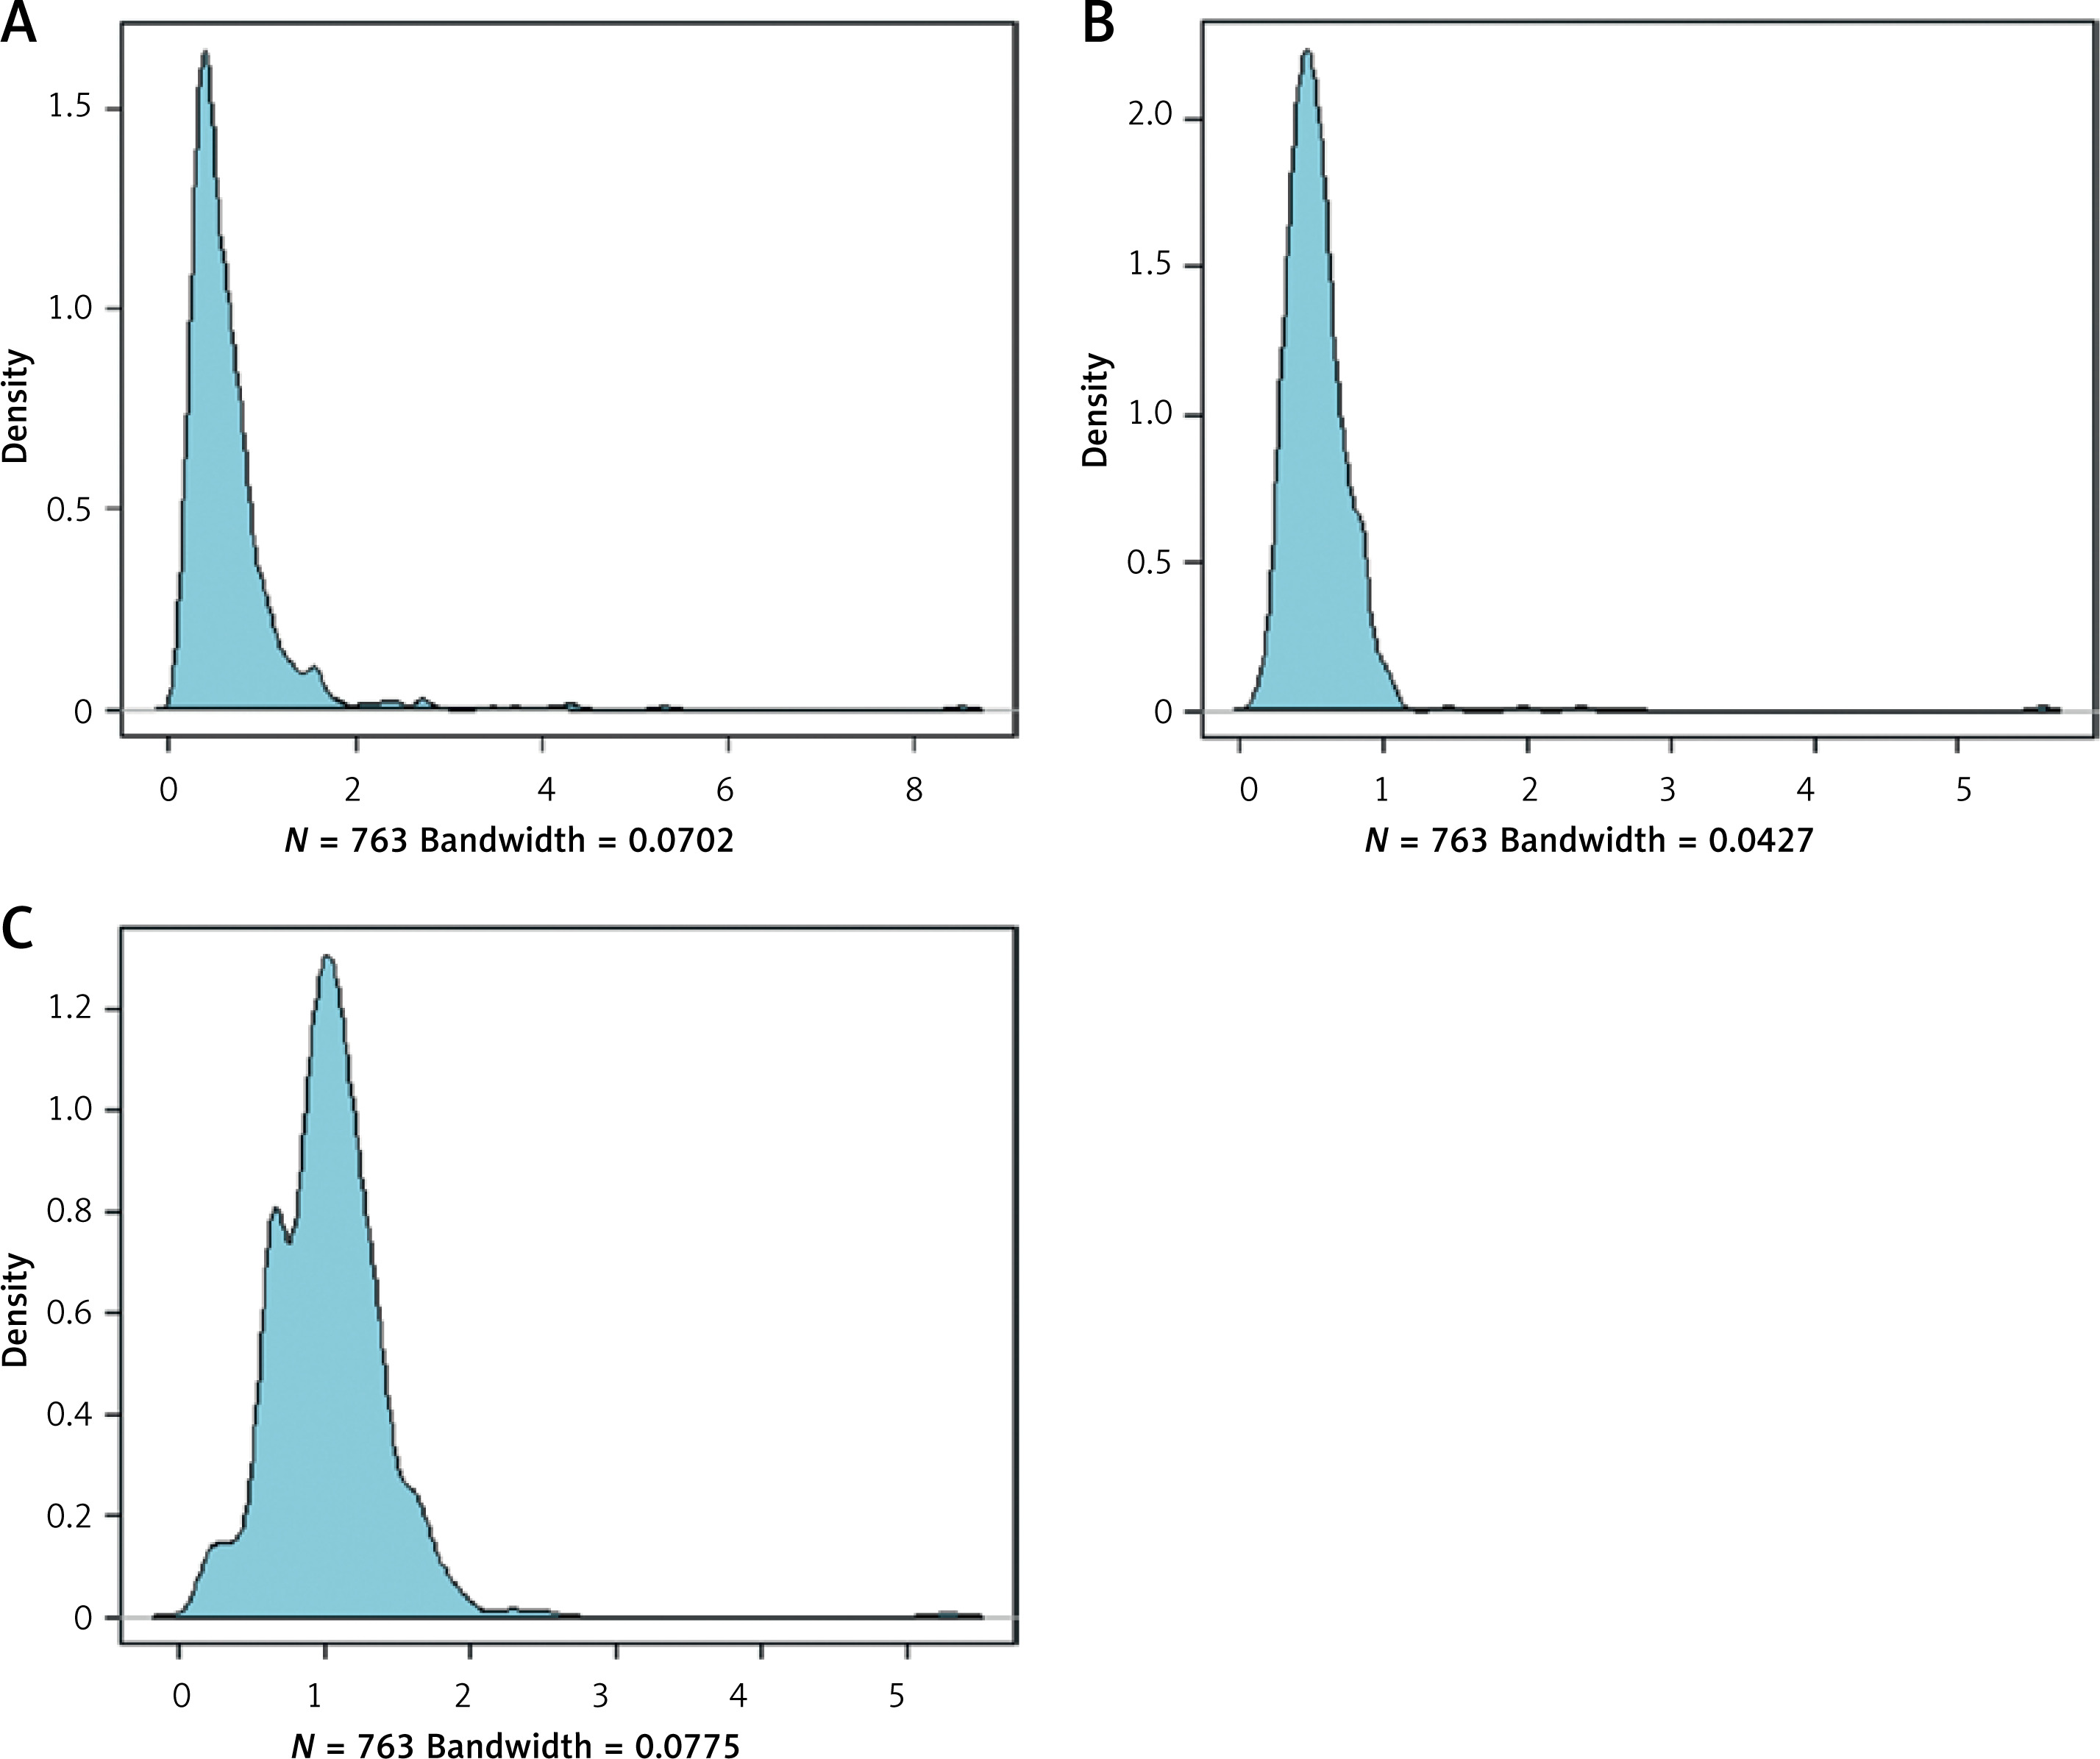
Table II presents a comparison of MHR, M, and HDL-C metrics between patients with good and poor prognoses at 3 and 6 months.
Table II
Bivariate comparison of MHR, M, and HDL-C profiles between patients with favourable outcome and unfavourable outcome at 3 and 6 months
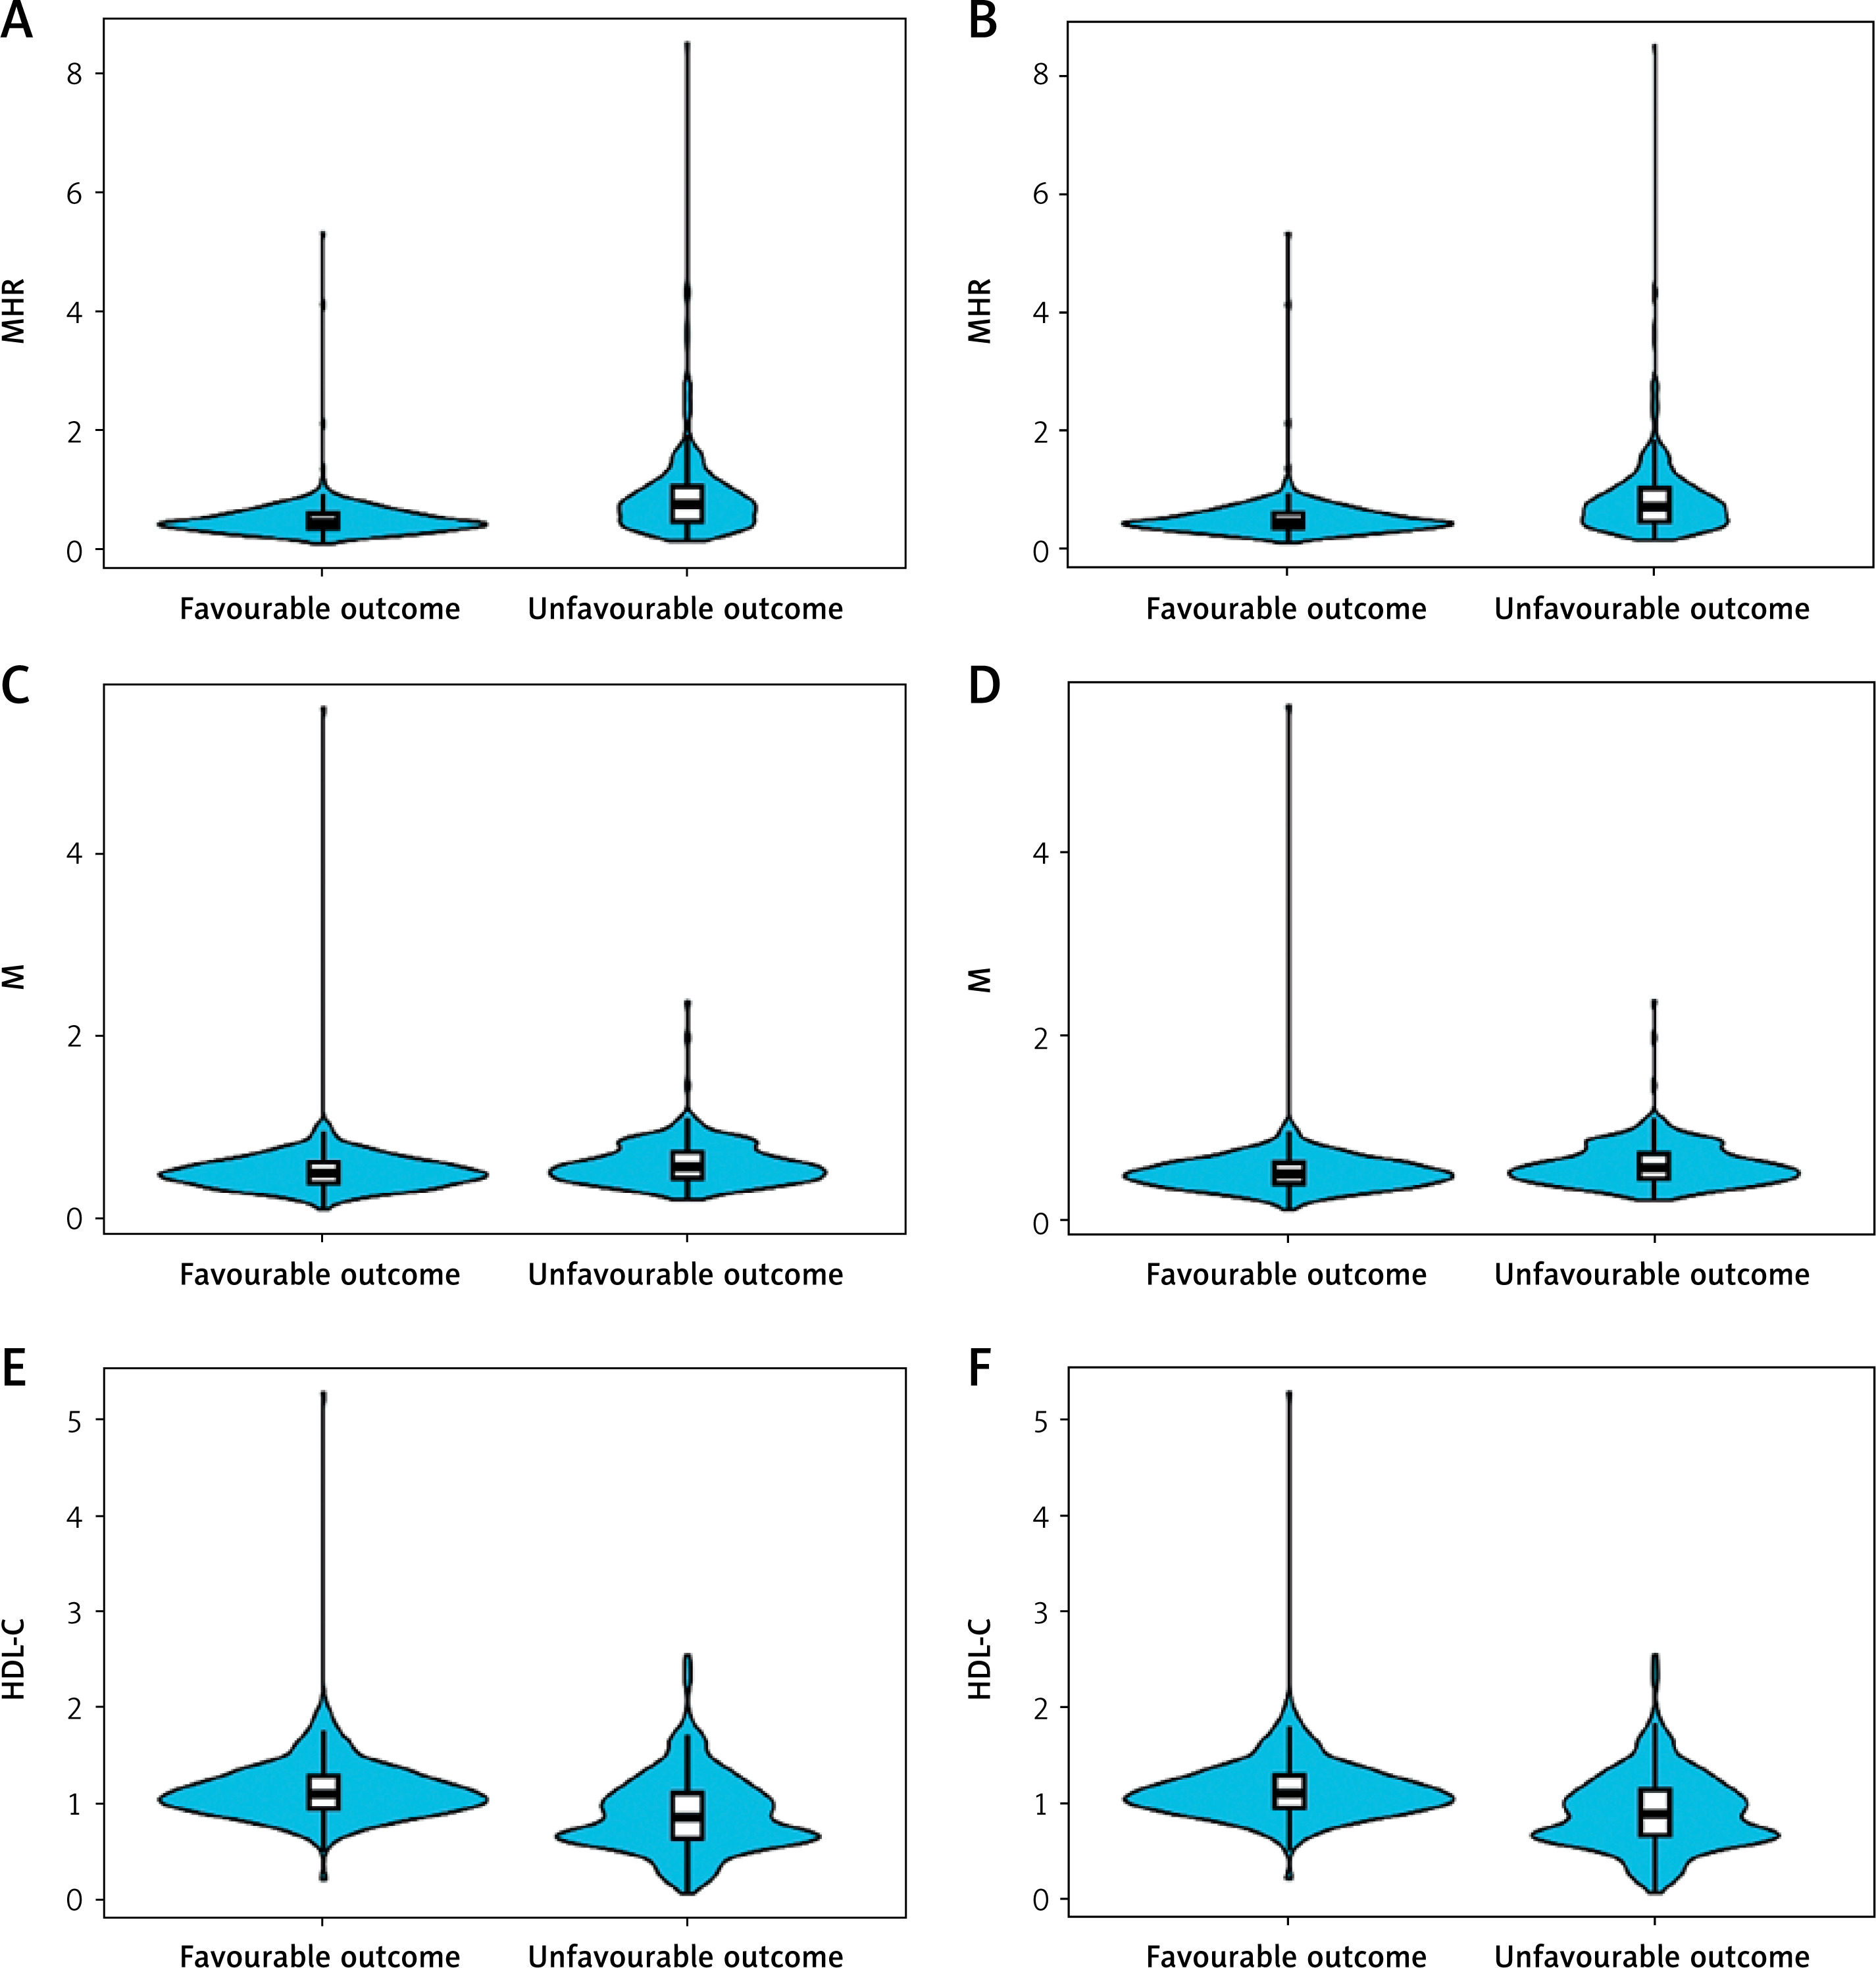
Analysis from Table II reveals that patients exhibiting poor prognostic outcomes at 3 months had higher MHR and M levels (0.74, p < 0.001; 0.56, p < 0.001, respectively) and lower HDL-C levels (0.85, p < 0.001) than those with good prognoses. Similarly, those with dismal prognostic outcomes at 6 months displayed increased MHR and M levels (0.68, p < 0.001; 0.55, p < 0.001, respectively) relative to the group with good prognoses, along with lower HDL-C levels (0.87, p < 0.001). MHR, M, and HDL-C significantly differed between the 2 groups. Figure 2 depicts the distribution of MHR, M, and HDL-C indexes in the 3-month and 6-month good and poor prognosis groups.
Association of MHR, M, and HDL-C levels with poor prognosis
Table III displays univariable and multivariable regression outcomes concerning a 3-month poor prognosis. Upon univariable regression, M, HDL-C, and MHR levels exhibited associations with a poor 3-month prognostic outcome (M: OR = 5.308; 95% CI: 2.449–11.504; p < 0.001; HDL-C: OR = 0.0943; 95% CI: 0.056–0.158; p < 0.001; MHR: OR = 14.013; 95% CI: 7.944–24.721; p < 0.001). Variables underwent screening via the stepwise method. Following multifactorial logistic regression analysis, it was determined that M and HDL-C levels did not correlate with a dismal 3-month prognosis. However, MHR levels remained associated with a dismal 3-month prognosis (OR = 6.484; 95% CI: 2.919–14.406; p < 0.001).
Table III
Univariable and multivariable logistic regression analyses depicting the association of lipid profile and other baseline characteristics with 3-month unfavourable outcome after intravenous thrombolysis
Table IV displays univariable and multivariable regression outcomes concerning the 6-month adverse prognosis. As per the one-way logistic regression, the levels of M, HDL-C, and MHR showed associations with a poor 6-month prognosis (M: OR = 4.888; 95% CI: 2.263–10.558; p < 0.001; HDL-C: OR = 0.124; 95% CI: 0.076–0.203; p < 0.001; MHR: OR = 10.922; 95% CI: 6.294–18.954; p < 0.001). The stepwise method was utilised for variable screening. Following multifactorial logistic regression analysis, M and HDL-C levels did not exhibit a relationship with a dismal 6-month prognosis. However, the MHR level showed a significant association with a dismal 6-month prognosis (OR = 4.948; 95% CI: 2.325–10.532; p < 0.001).
Table IV
Univariable and multivariable logistic regression analyses depicting the association of lipid profile and other baseline characteristics with 6-month unfavourable outcome after intravenous thrombolysis
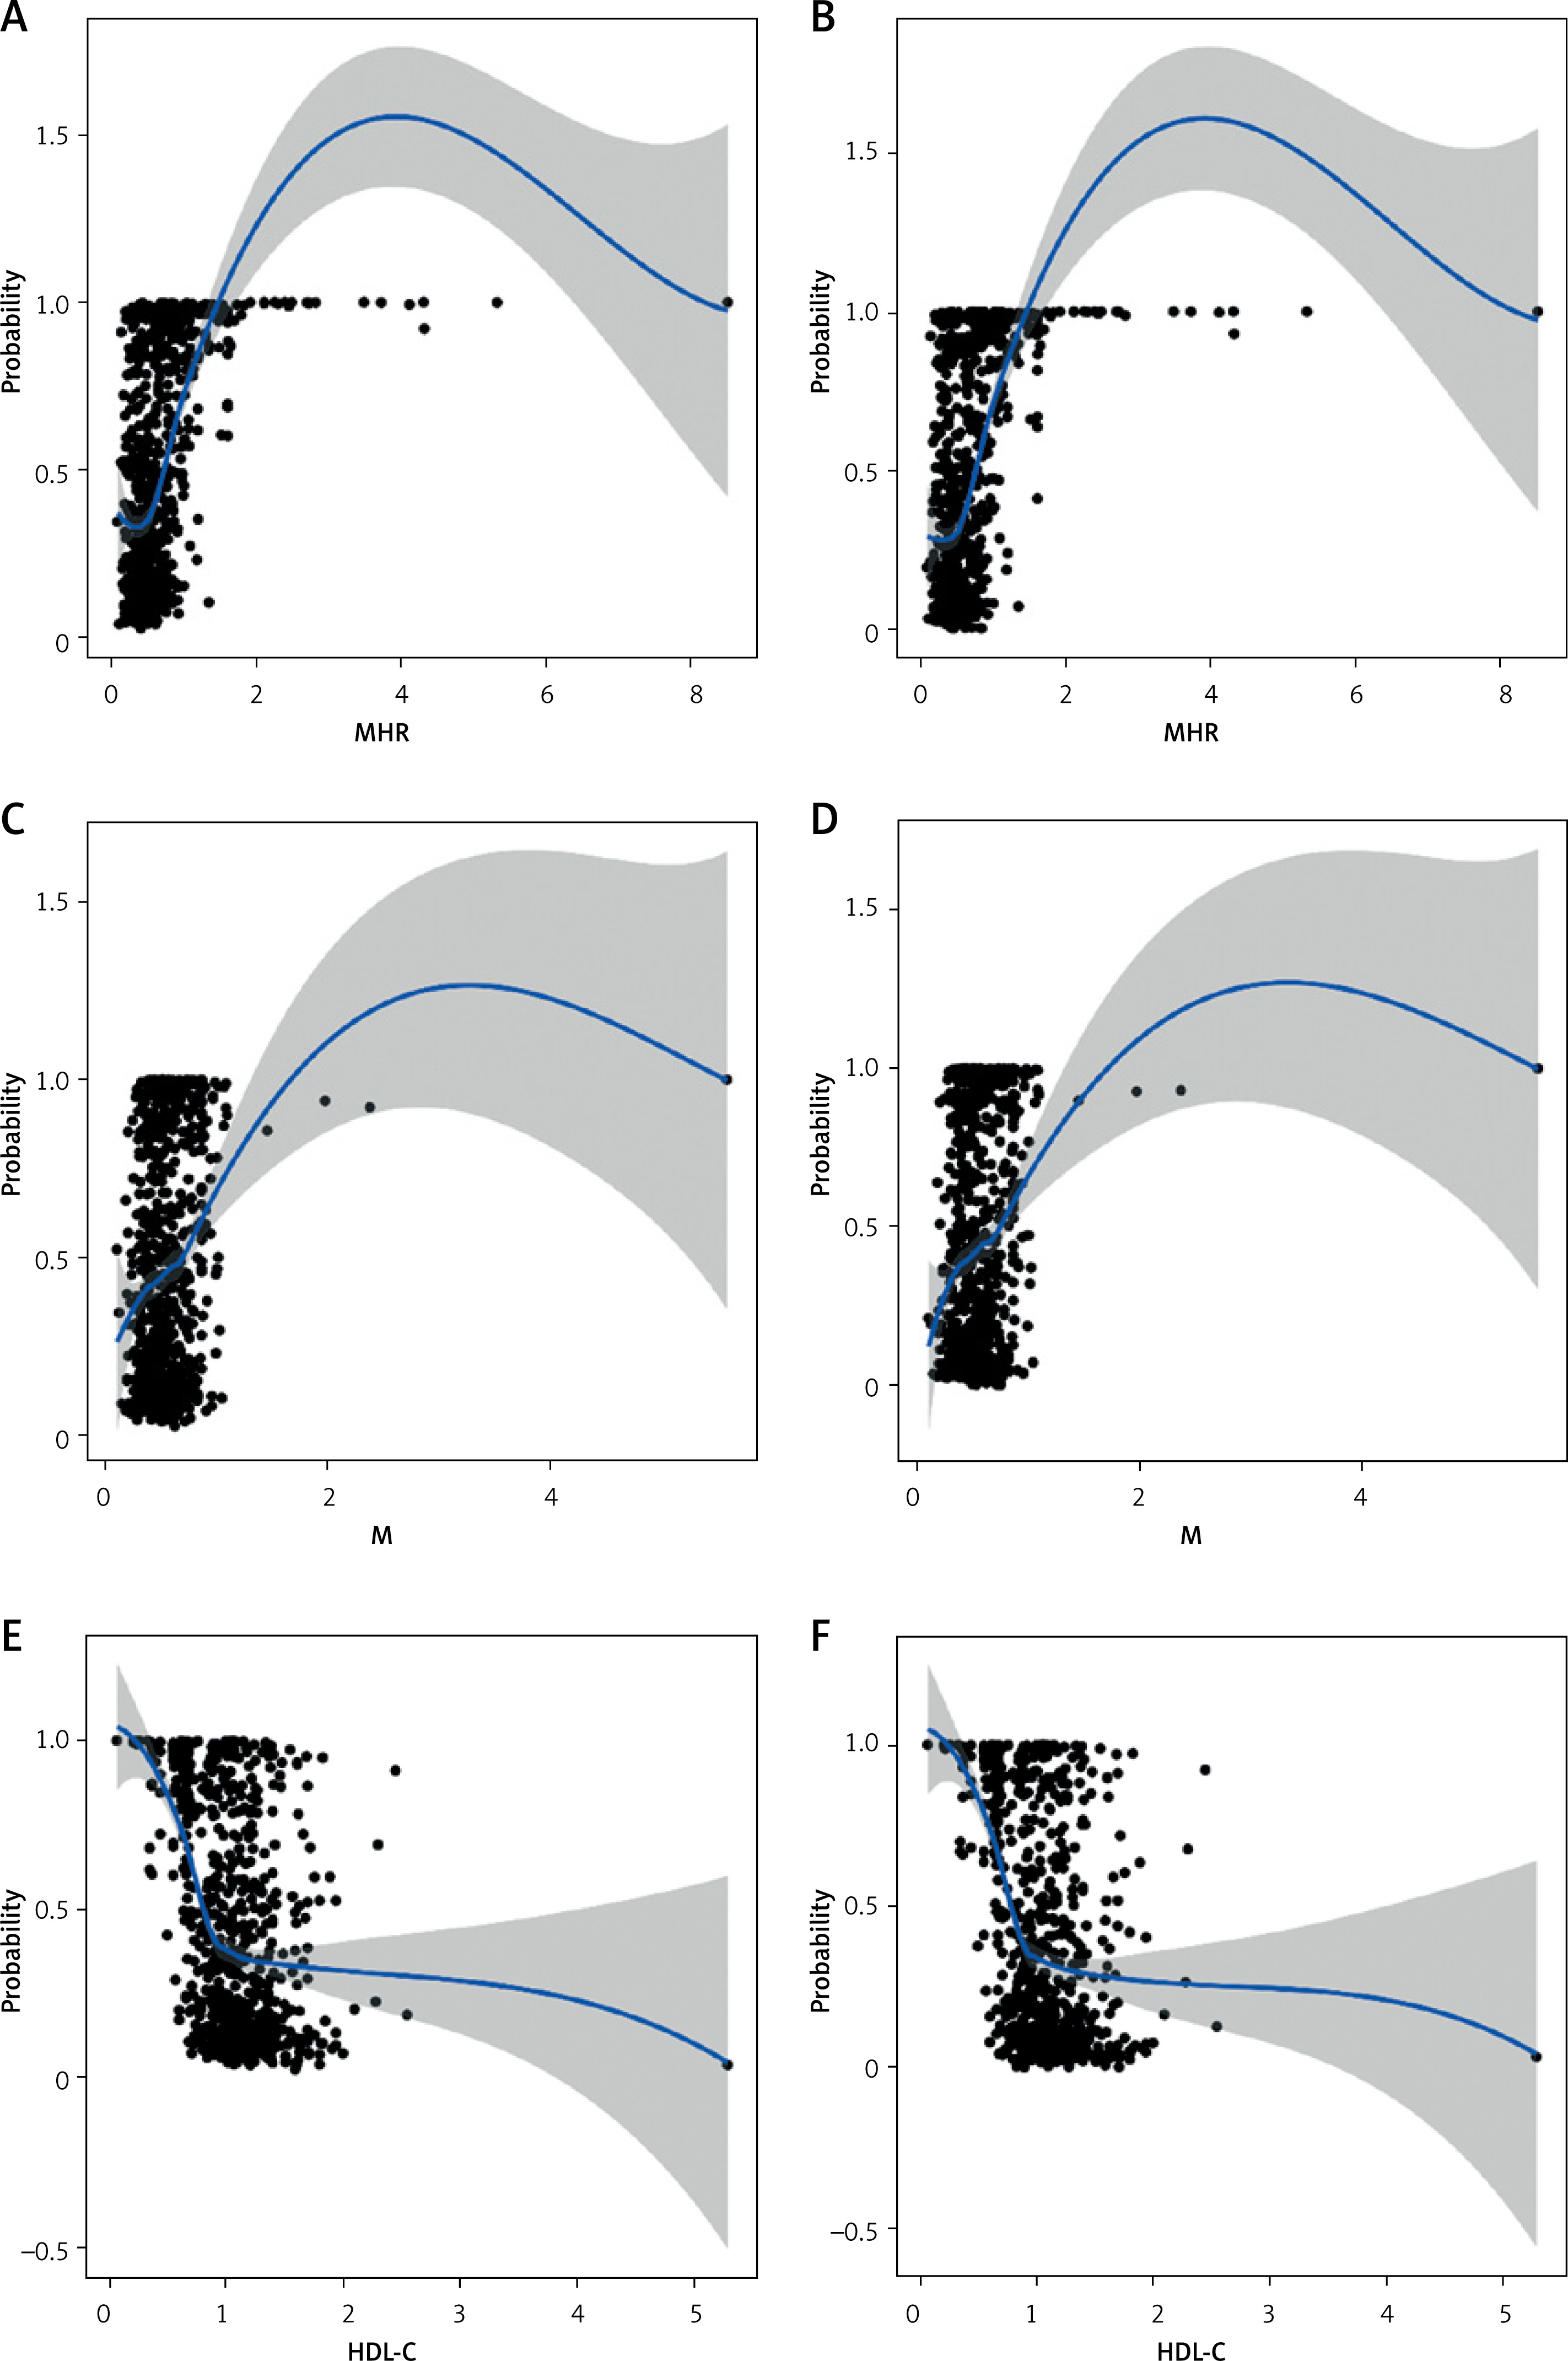
Figure 3 displays the relationship between MHR, M, and HDL-C levels and patients’ 3-month adverse prognosis and 6-month adverse prognosis.
Predictive value of MHR levels (dichotomised) for 3-month adverse prognosis and 6-month adverse prognosis
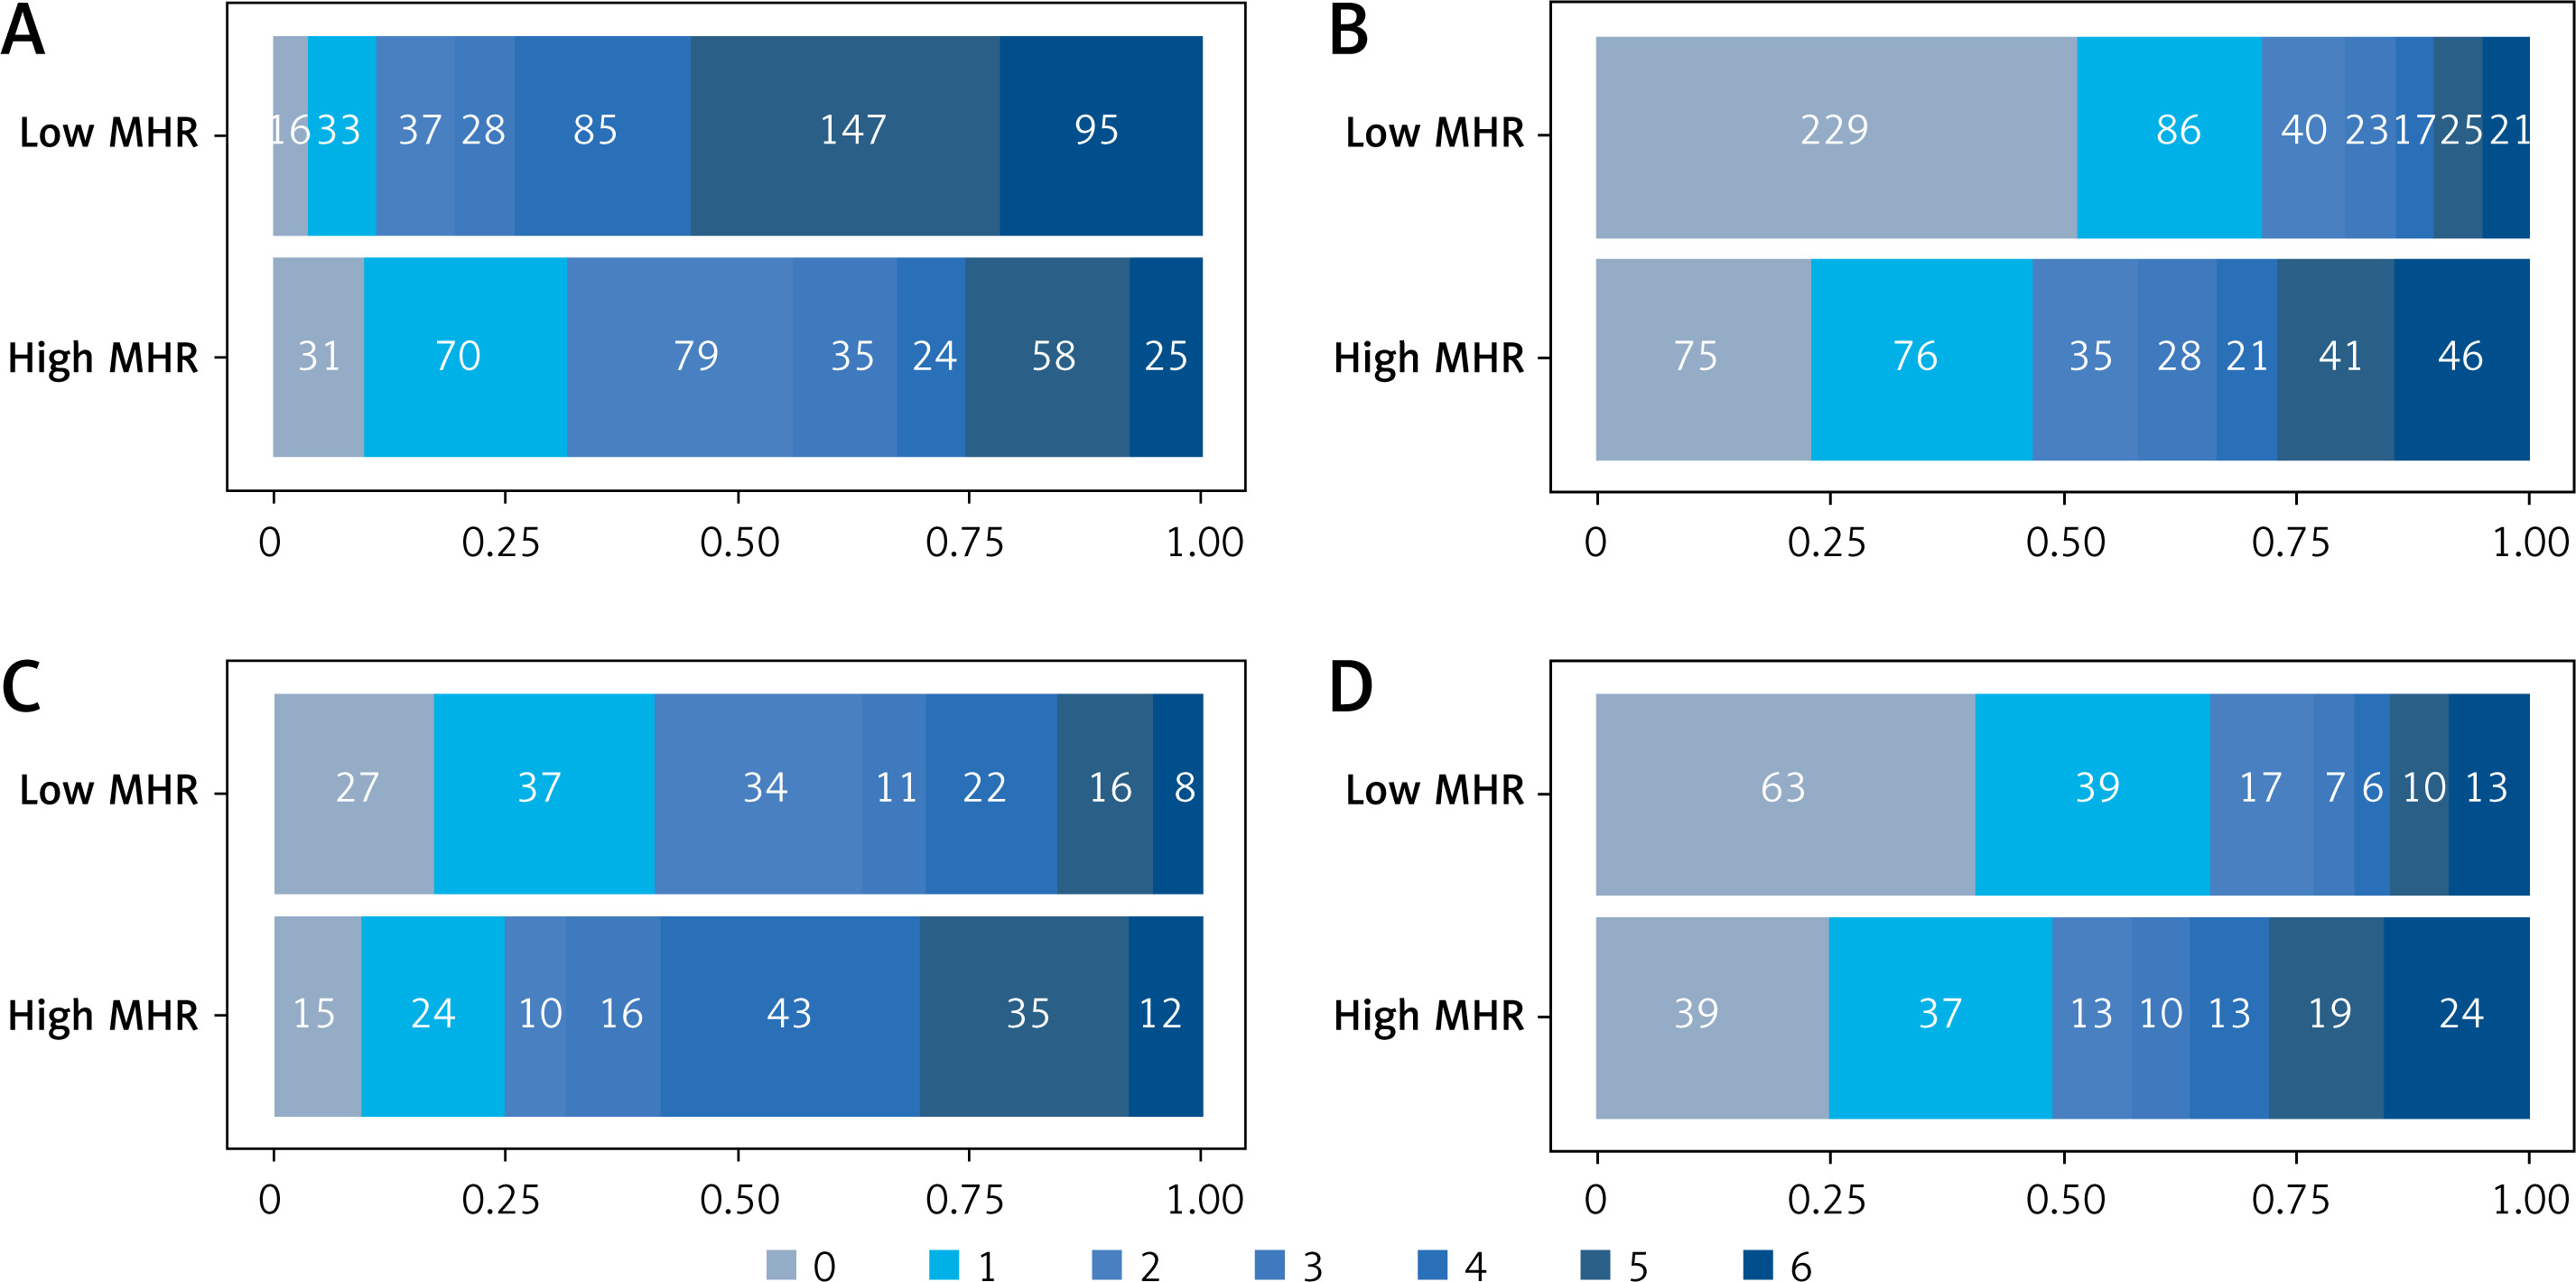
ROC curves were plotted to establish the critical value of MHR levels, which was determined to be 0.584 based on the maximum Youden’s index. Patients were categorised as having high or low MHR groups (MHR ≥ 0.584 or < 0.584) using this threshold. According to binary logistic regression, high MHR levels significantly correlated with a dismal 3-month prognosis following intravenous thrombolysis among AIS patients (OR = 5.657, 95% CI: 4.124–7.762; p < 0.001). PSM was employed to assess the relationship between MHR levels and patient prognosis, matching baseline factors between patients in the high and low MHR groups (Table V). Following PSM, a higher proportion of patients with high MHR had a 3-month adverse prognosis than that of those with low MHR (68.4% vs. 36.8%, p < 0.001), which showed a statistically significant difference (Figures 4 A, C). Additionally, a greater percentage exhibited a 6-month adverse prognosis (69.7% vs. 43.2%, p < 0.001), also showing a statistically significant difference (Figures 4 B, D).
Table V
Baseline characteristics of patients in the high and low MHR groups before and after PSM
Discussion
MHR independently predicted clinical prognostic outcomes in AIS patients treated with intravenous thrombolysis. Elevated MHR levels were a valid factor strongly correlating with dismal prognostic outcomes at both 3 and 6 months after intravenous thrombolysis. An MHR threshold of 0.584 was identified, where higher MHR levels were significantly associated with poorer 3-month (OR = 5.657; 95% CI: 4.124–7.762; p < 0.001) and 6-month (OR = 4.923; 95% CI: 3.603–6.726; p < 0.001) prognostic outcomes among AIS patients. These findings underscore the correlation between high MHR and adverse prognostic outcomes.
Atherosclerosis, as highlighted in studies [18], stands as the primary cause of AIS. It represents a chronic inflammatory vascular disorder triggered by various risk factors [19, 20]. Notably, atherosclerosis independently predicts the risk of ischaemic cerebrovascular disease, laying the critical pathological groundwork for the occurrence and progression of cardio-cerebral and cerebrovascular events. At its core, atherosclerosis manifests as an inflammatory lesion. The progressive worsening of atherosclerosis can lead to elastic fibre degradation, reduced vascular elasticity, and subsequent hardening of the blood vessel wall. This diminished compliance increases susceptibility to thrombus formation and plaque rupture, ultimately culminating in cerebrovascular disease. Monocytes [21, 22], recognised as common markers of systemic inflammatory response, play a pivotal role in all stages of atherosclerosis and are closely associated with the progression of atherosclerotic plaques. These cells generate reactive oxygen species and subsequently transform into foamy macrophages, producing pro-inflammatory factors. This process drives circulating monocytes toward the lesion site, contributing to the vulnerability of atherosclerotic plaques and leading to thrombosis or adverse outcomes. HDL-C [23] plays a crucial role in inhibiting monocyte activation and macrophage migration, while also safeguarding vascular endothelial cells from inflammation and oxidative stress. HDL-C actively mitigates and reverses monocyte activation through apoA-I-induced suppression of CD11b, facilitating intracellular efflux of excess cholesterol during disease onset and retarding the formation of atherosclerotic plaques. Moreover, HDL-C [24] regulates endothelial function by exerting anti-oxidative and anti-inflammatory activities. It also influences monocyte activation, adhesion, and invasion. Some studies [25] have indicated that impairment of HDL-C-induced cholesterol efflux and monocytosis resulting from low HDL-C levels contribute to the progression of atherosclerosis. Overall, HDL exhibits anti-inflammatory, antithrombotic, and antioxidant effects in patients.
Considering the pro-inflammatory and oxidative effects of monocytes on promoting inflammation and oxidation of monocytes alongside the inhibitory effect of HDL-C on monocyte recruitment, LDL oxidation, and cholesterol efflux enhancement, MHR is considered a new marker for predicting acute cerebral infarction development. First, at the onset of AIS, monocytes bind to adhesion molecules on the injured vascular endothelium, migrate to the subendothelial space, mature into macrophages [26], and are converted to foam cells after internalising accumulated lipids. Foam cells release a variety of proinflammatory and prooxidant cytokines that attract T lymphocytes and more monocytes to accumulate [27]. Foam cells are further transformed into key components of the atherosclerotic core through necrosis. Increased production of cytokines and chemokines, as well as activation of matrix metalloproteinases, in turn leads to connexin cleavage and disruption of blood-brain barrier integrity [28]. Second, HDL-C promotes reverse cholesterol transport from the peripheral vasculature to the liver and reduces lipid accumulation in the peripheral vasculature [29], which undergoes peroxidation and forms oxidised phospholipids, which are then further hydrolysed and derivatised to form [30] lysophosphatidylcholine (LPC), which mediates the major atherosclerotic activity of oxidised lipids. Its elevated LPC levels promote the expression of adhesion molecules and chemoattractants by endothelial cells. In addition, decreased HDL-C leads to reduced inhibition of pro-inflammatory and pro-oxidant functions of monocytes. Finally, it can lead to increased intracranial atherosclerosis and ischaemic stroke. Accordingly, it is clear that MHR is an atherosclerosis by assessing inflammation and dyslipidaemia, which are the basic mechanisms of ischaemic stroke.
Severe neurological injury in acute cerebral infarction patients reflects heightened inflammatory responses in brain tissue, indicating poor recovery in the ischaemic semidomedullary zone as well as the compressed brain tissue and poorer prognostic outcomes [31]. MHR proves more valuable in predicting prognosis compared to monocyte counts or HDL-C concentrations. Previous research by Kanbay et al. [32] suggested MHR as a predictor of cardiovascular events in chronic kidney disease patients. Moreover, in a US cohort study [33], MHR showed significant associations with cardiovascular and all-cause mortality across the general population, irrespective of identified risk factors. Insightful studies conducted on a population-based Chinese cohort [34] revealed an intriguing correlation: the level of MHR was observed to exhibit a linear relationship with the risk of ischaemic stroke within a large community-based population. Notably, MHR served as a significant indicator of atherosclerosis burden, demonstrating superior predictive capabilities compared with traditional clinical risk factors. This suggests its potential application in stratifying the risk among ischaemic stroke patients. These findings hold substantial importance in devising strategies aimed at reducing MHR levels to prevent adverse cardiovascular outcomes. Furthermore, additional studies [35] have confirmed that elevated MHR levels independently forecasted an unfavourable prognosis and increased all-cause mortality among patients with ischaemic stroke or transient ischaemic attack (TIA). However, to date, to the best of my knowledge, no relationship has been found between MHR and outcomes in patients who did not receive treatment or who received endovascular therapy, pending the need for further research findings to be explored.
The present study has certain strengths. First, all MHR specimens were collected within the initial 24 h post stroke; thus, heterogeneity among the blood samples was relatively small. Second, PSM analyses were performed to balance baseline factors between patients with high and low MHR groups, confirming the effects of higher MHR levels on poor stroke thrombolysis outcomes, independent of other risk factors such as monocytes and HDL-C. Finally, this study demonstrated the significance of MHR in predicting poor 3-month and 6-month prognostic outcomes in AIS patients receiving intravenous thrombolytic therapy, and higher MHR levels were associated with poorer short-term versus long-term prognostic outcomes among AIS patients.
However, limitations exist in this work. The study had a small sample size, being a single-centre retrospective study, potentially introducing bias. For example, the slightly higher fasting venous blood glucose in the patients included in the study and analysed in this study may have slightly affected the present results. Therefore, large-scale multicentre studies are warranted. Moreover, we only recorded baseline MHR and did not monitor MHR values at discharge and follow-up, which lacks dynamic monitoring of MHR changes and requires further research and analysis in future research. Finally, our inclusion criteria, although we excluded patients currently taking statins, did not take into account the application of other factors affecting lipids, such as cholesterol transfer protein inhibitors, legumes, and fruits. Eliminating these confounding factors is a major project.
In conclusion, the study affirms the independent association between MHR and dismal 3- and 6-month prognoses in AIS patients undergoing intravenous thrombolysis. MHR, with a threshold of 0.584, serves as a strong predictor of adverse prognostic outcomes in these patients, surpassing the predictive value of monocytes and HDL-C. Therefore, MHR has the potential to be used as a tool for prognostic prediction in AIS patients undergoing intravenous thrombolysis.