Introduction
Twenty years ago, Rivers et al. proposed that early goal-directed therapy (EGDT) treatment could reduce hospital mortality [1], and the various versions of the Surviving Sepsis Campaign (SCC) guidelines released in 2004/2012/2016/2018/2021 confirmed the importance of early fluid resuscitation therapy [2–6]. Guo et al. found that in patients with severe community-acquired pneumonia, implementation of severe sepsis bundles may lead to more fluid resuscitation (63.2% vs. 26.4%) and more volumes infused (1319.8 ±1107.4 ml vs. 461.9 ±799.3 ml). Hospital mortality was reduced from 44.3% to 29.2% (p = 0.023) in the bundles group [7].
An important core concept of EGDT is achieving hemodynamic stability, oxygen delivery goals, and satisfactory tissue perfusion through early fluid resuscitation. However, according to the pathophysiology of shock [8], is there actually an effective circulatory volume when shock occurs? The theory may not be fully understood. Hypovolemic shock should be managed with a positive fluid challenge, but the distributive shock represented by sepsis is characterized by a decrease in stress capacity and an imbalance in the proportion of nonstress capacity, which leads to a relative lack of volume capacity. Obstructive shock and cardiogenic shock are more likely to require treatments correcting the underlying causes. Therefore, even if the Starling curve is adjusted by an infusion to adjust the cardiac preload, increasing the stress capacity, increasing the gradient, and increasing cardiac output (CO) may be the first considerations and most beneficial; however, three studies of EGDT did not find significant effects on mortality from sepsis treatment [9–11]. It has been realized that the appropriate treatment of septic shock may not be standardized fluid therapy and that such treatment should be more individualized and precise. That is, it is unclear whether improper fluid treatment caused the difference in mortality observed in the studies. Whether less fluid should be used to achieve the hemodynamic resuscitation goal and benefit patients has become an important clinical issue.
The infusion target of 30 ml/kg comes from the ARISE study, PROCESS study, and PROMISE study. However, in 3,400 children from Africa, there was a significant increase in 48-hour mortality from fluid infusion, and the relative risk for any bolus was higher than that of the control (95% CI: 1.13–1.86; p = 0.003) [12]. Another option for early resuscitation is intravenous infusions with vasopressors, which increases the in-hospital mortality rate in adults with sepsis and hypotension in limited resource areas compared with conventional treatment [13]. Sirvent et al. suggested that 48–96 h of accumulated positive fluid balance is associated with high mortality in patients with sepsis [14]. Kelm et al. suggested that 405 patients with severe sepsis and septic shock who underwent EGDT had a fluid overload on the first day, 48% had a fluid overload on the third day, and the fluid overload increased the risk for hospitalization with an OR of 1.92 (1.16–3.22) [15]. Acheampong et al. [16] continuously observed the fluid balance in 173 cases of sepsis treatment and found that the daily fluid balance of the 59 patients who died was significantly higher than that in the surviving patients measured the next day. A continuous positive fluid balance was an independent risk factor for sepsis patients, with an OR of 1.014 (1.007–1.022) per ml/kg increase. In a meta-analysis of three large-scale multicenter studies, EGDT suggested no improvement in 90-day survival and significantly increased the duration of ICU stay, cardiovascular support time, and medical costs [17]. Therefore, the topic of fluid resuscitation therapy in intensive care has been an ongoing focus of debate. When a patient is transferred to the ICU, this is not always the first treatment. Some treatment measures should be started before he or she enters the ICU.
Therefore, the aim of this study was to determine whether after entering the ICU, these patients should still follow the EGDT method for fluid infusion. Should we look for the time when sepsis first occurred to reverse the process of infusion and thereby reduce the amount of infusion? In this study, the method and idea of a large database were utilized to develop an early-warning model of the factors affecting the mortality of ICU patients within 6 h of initial resuscitation after ICU admission to reflect the volume and significance of infusions.
Material and methods
Patient sample
We performed a retrospective study of patients with sepsis by using the Peking Union Medical College Hospital Intensive Care Medical Information System and Database (PICMISD) from January 2014 to June 2020. The inclusion criteria were as follows: (1) sepsis defined as sepsis 3.0, which was life-threatening organ dysfunction caused by a dysregulated host response to infection; (2) available blood cultures or other etiological evidence prior to antibiotic treatment; and (3) broad-spectrum antibiotic treatment. Patients who were younger than 18 years or had been admitted to the ICU for less than 24 h were excluded. The Institutional Research and Ethics Committee of the Peking Union Medical College Hospital approved this study for human subjects (SK-1241). Informed consent was obtained from all subjects involved in the study. Only objective data collection was conducted in this study, and no intervention was performed on the patients.
Data collection
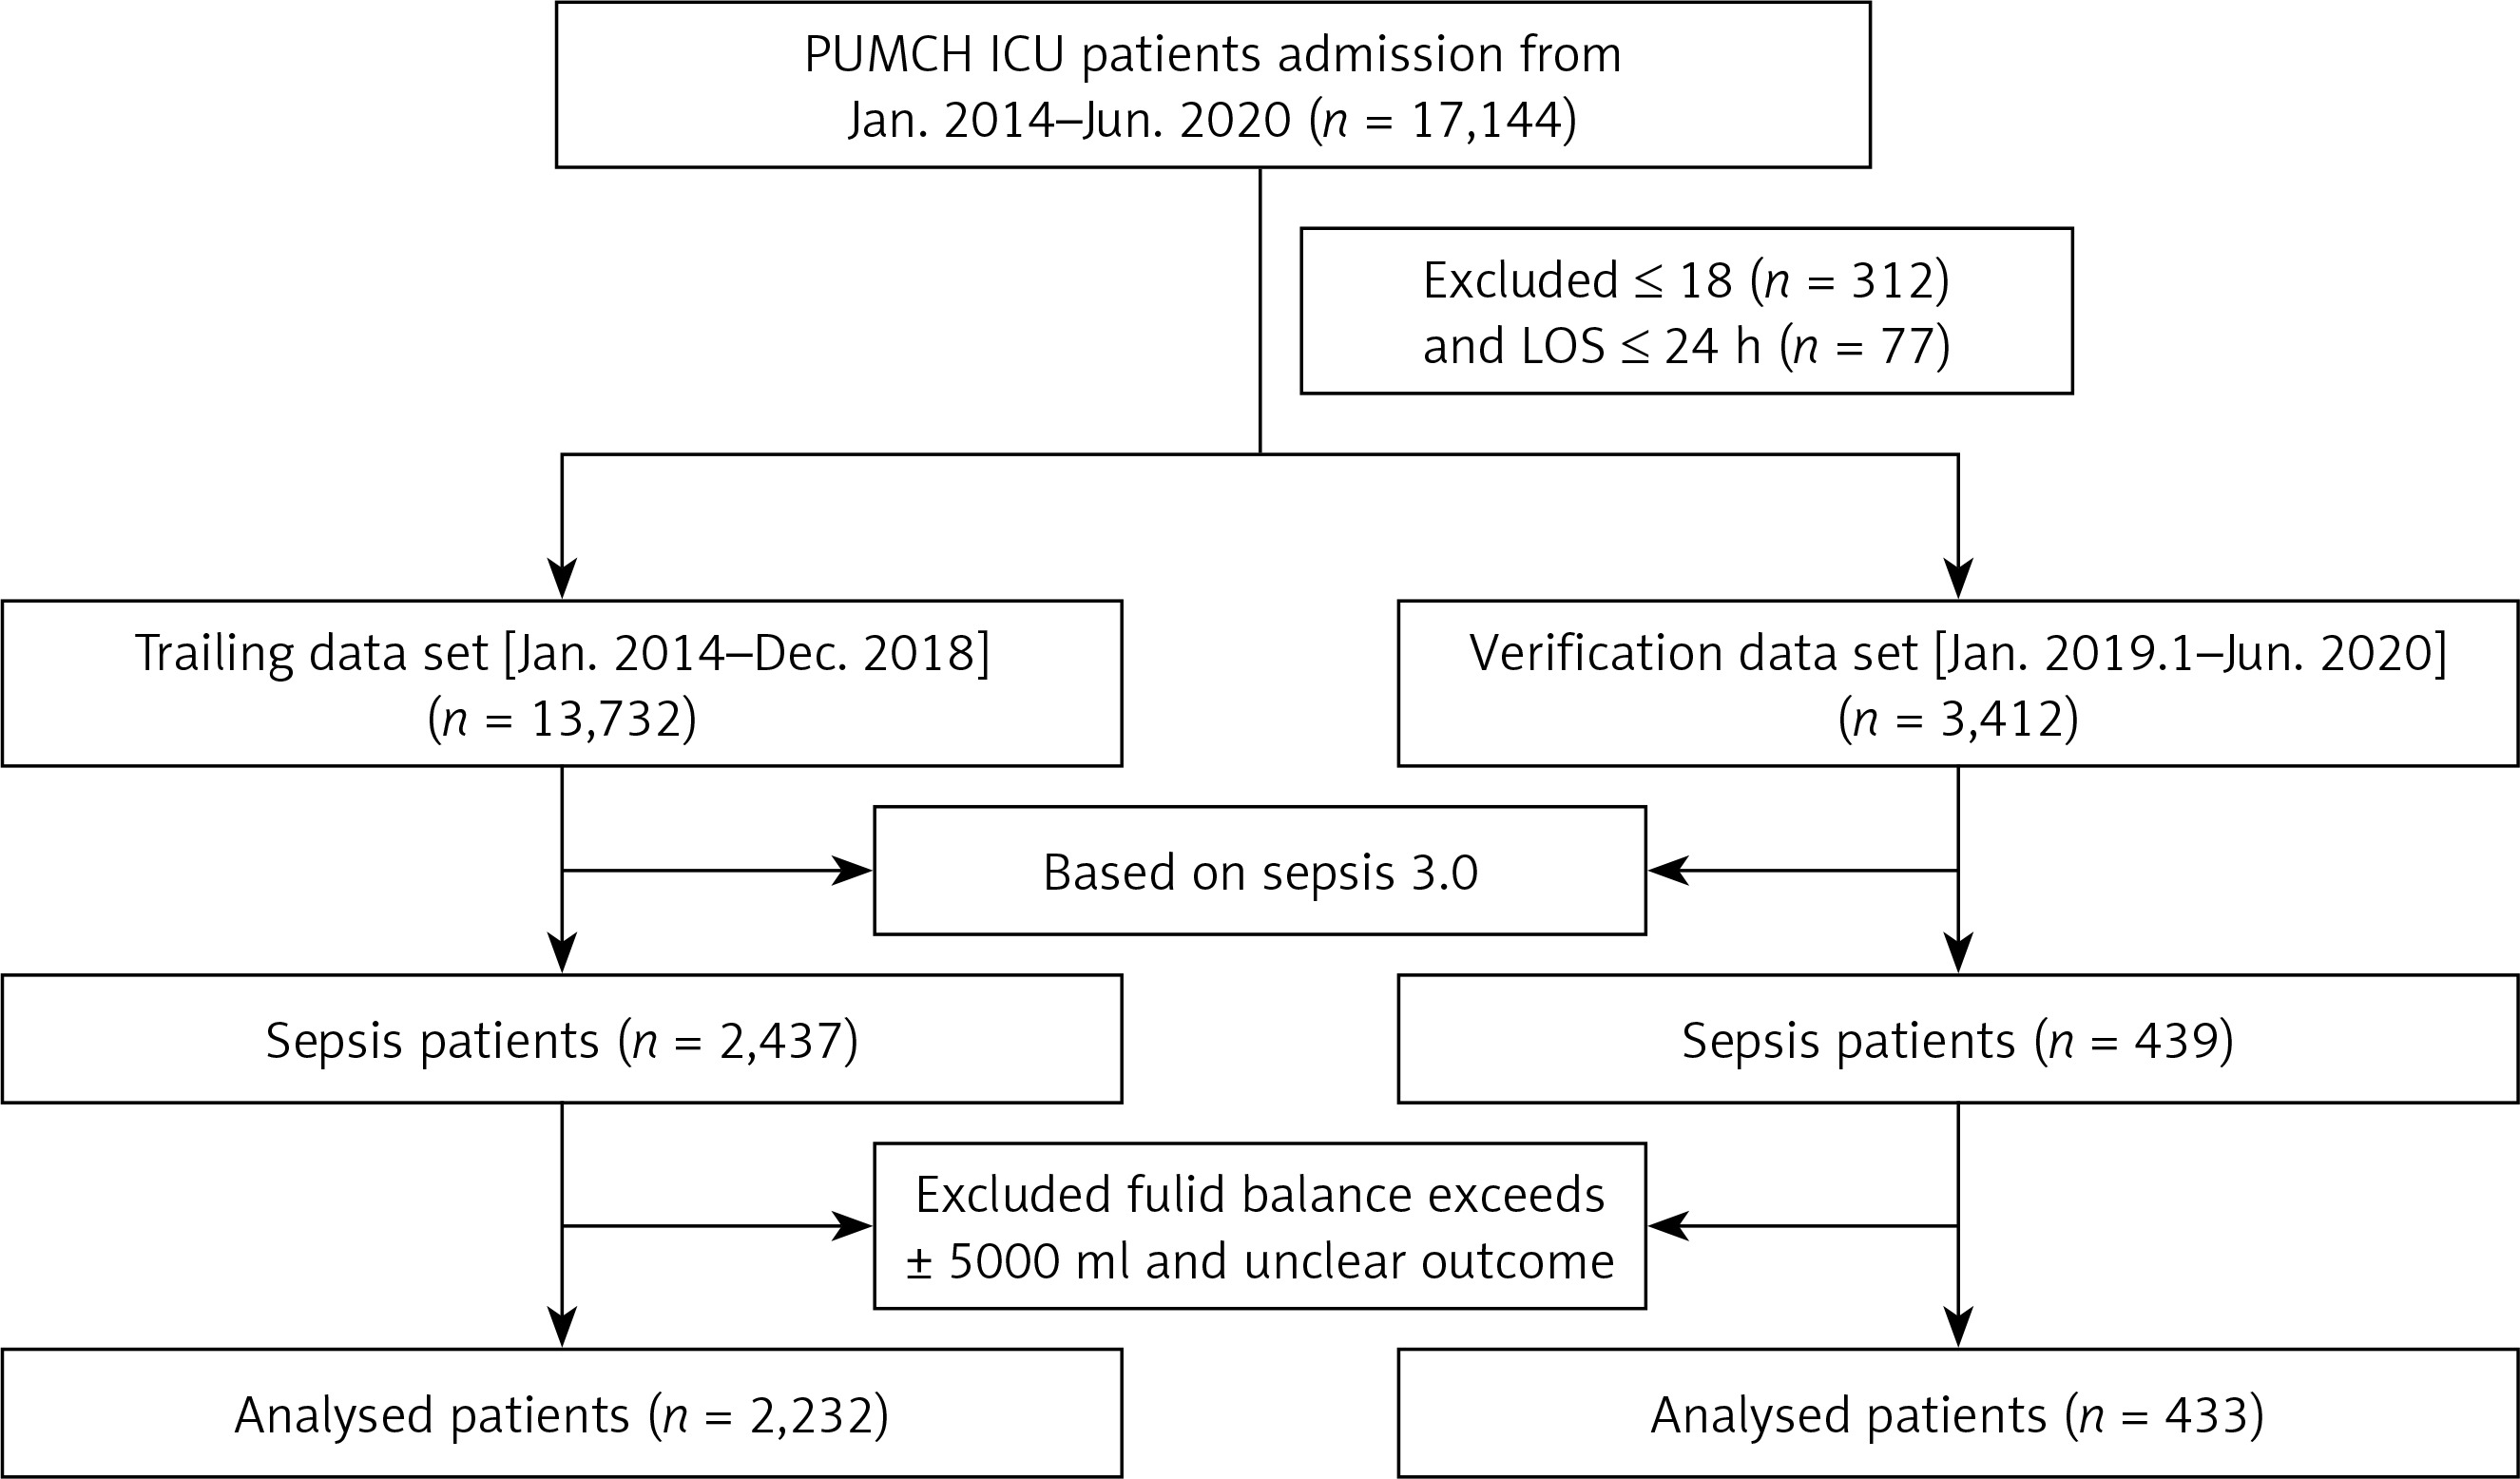
All of the clinical data came from the PICMISD, which extracted real-time clinical data from bedside equipment. The clinical data of the patients were extracted during the first 6 h after ICU admission and included vital signs, monitoring data and laboratory test results. In addition, the fluid balance per hour and the total dose of vasoactive drugs were also extracted after ICU admission. The amount of input and output was defined as the sum of the amount of input and output per hour. This included changes in the volume of interventions using hemofiltration. The dataset was divided into a training set (Jan. 2014–Dec. 2018) and a verification set (Jan. 2019–Jun. 2020). The flowchart is shown in Figure 1.
Handling missing data and outliers
Missing values that exceeded 30% of a clinical variable were eliminated, and the other missing values were replaced according to the k-nearest neighbor (KNN) algorithm [18]. Eighteen patients with an absolute value of total fluid balance greater than 5000 ml within 6 h of initial resuscitation following ICU admission were defined as outliers and excluded because they deviated from the normal value. The missing data and outliers are shown in Supplementary Table SI.
Regression analysis
To make the results more interpretable, we transferred certain continuous variables to categorical variables based on recommended thresholds. Univariate logistic regression was first conducted. Then, all variables were included in the multivariate logistic regression, excluding SOFA and APACHE II. The new model was used to identify the potential predictors of death 28 days after admission. In addition, the SOFA and APACHE II scores were used for other multivariate logistic regression models (defined as the SOFA model and APACHE II model, respectively) and compared with the new model.
Establishment and validation of the models
According to our sample size and the number of variables, 5-fold cross-validation was used to establish the three models with the training cohort. Receiver operating characteristic (ROC) curve analyses, as well as the associated classification measures (including the area under the curve [AUC], sensitivity [Sen], specificity [Spe], accuracy [Accu], positive predictive value [PPV], negative predictive value [NPV], positive likelihood ratio [PLR], and negative likelihood ratio [NLR]), were used to evaluate the predictive performance.
Causal forest analysis
The causal forest model is used to quantify the heterogeneity of adverse outcomes (positive fluid balance) among different individuals and further help doctors screen potential high-risk patients.
Statistical analysis
All statistical analyses were performed in R version 3.6.1 and Python V 3.9.13. Categorical variables are presented as numbers (percentages). Continuous variables following a normal distribution are presented as the mean ± standard deviation; otherwise, the median and interquartile range (IQR) are used. The χ2 or Fisher’s exact test was used, as appropriate, to compare the differences in categorical variables. The independent sample t test was used to compare the differences among normally distributed continuous variables, while the Wilcoxon test was used for nonnormally distributed continuous variables. Differences with a two-sided p-value < 0.05 were considered significant for all statistical hypotheses.
Results
Baseline characteristics and comparisons of the alive and deceased groups
The baseline characteristics of the patients and comparisons of the alive and deceased groups in the training cohort are summarized in Table I. In the training cohort, a total of 2,232 patients were included. The cohort consisted primarily of the deceased group (n = 429) and alive group (n = 1,803). The SOFA score and APACHE II score were significantly lower in the alive group than in the deceased group. However, the GCS score and the time from ICU admission to death showed an inverted relationship. Furthermore, the total fluid balance each hour over the first 4 h following ICU admission was significantly higher in the deceased group than in the alive group, and the sum of the total fluid balance in the first 6 h was similar to the trend above. The total fluid balance at 4–5 and 5–6 h in the deceased group was higher than that in the alive group, but the difference was not significant. In addition, no significant differences were observed in age or sex between the two groups.
Table I
Baseline characteristics of the training data
A total of 433 patients were identified for inclusion as the verification cohort. The cohort consisted primarily of the deceased group (n = 51) and alive group (n = 382). The detailed characteristics of the verification data are shown in Table II. The training set and the verification set comparison are shown in Supplementary Table SII.
Table II
Multivariate analysis for factors associated with death
Univariate analysis and total fluid balance
Table III presents the results of the univariate analyses with factors associated with outcome. There were no significant associations in the univariate analysis between outcome (defined as death) and age, sex, hemoglobin, total fluid balance at 4–5 h, or total fluid balance at 5–6 h.
Table III
Univariate analysis for factors associated with death
A histogram of each hour’s total fluid balance was drawn. The total fluid balance of the individuals was concentrated in the range of –2000 ml to 2000 ml and was relatively sparse outside this range (Figure 2 A). Thus, we divided the total fluid balance into 500 ml intervals between –2000 ml and 2000 ml. The fatality rate of patients with a positive total fluid balance below 1000 ml and all patients with a negative total fluid balance was stable (p > 0.05). However, the fatality rate increased with each level when the positive total fluid balance was greater than 1000 ml, as shown in Figure 2 B (p < 0.05).
Figure 2
Relationship between the total fluid balance and outcomes for all included sepsis patients. A – Distribution of the total fluid balance; B – Fatality rate of patients with each total fluid balance level; C – Survival curves for the time-to-event in each group, including those with a total fluid balance over 0–6 h that was greater than 1000 ml and less than 1000 ml
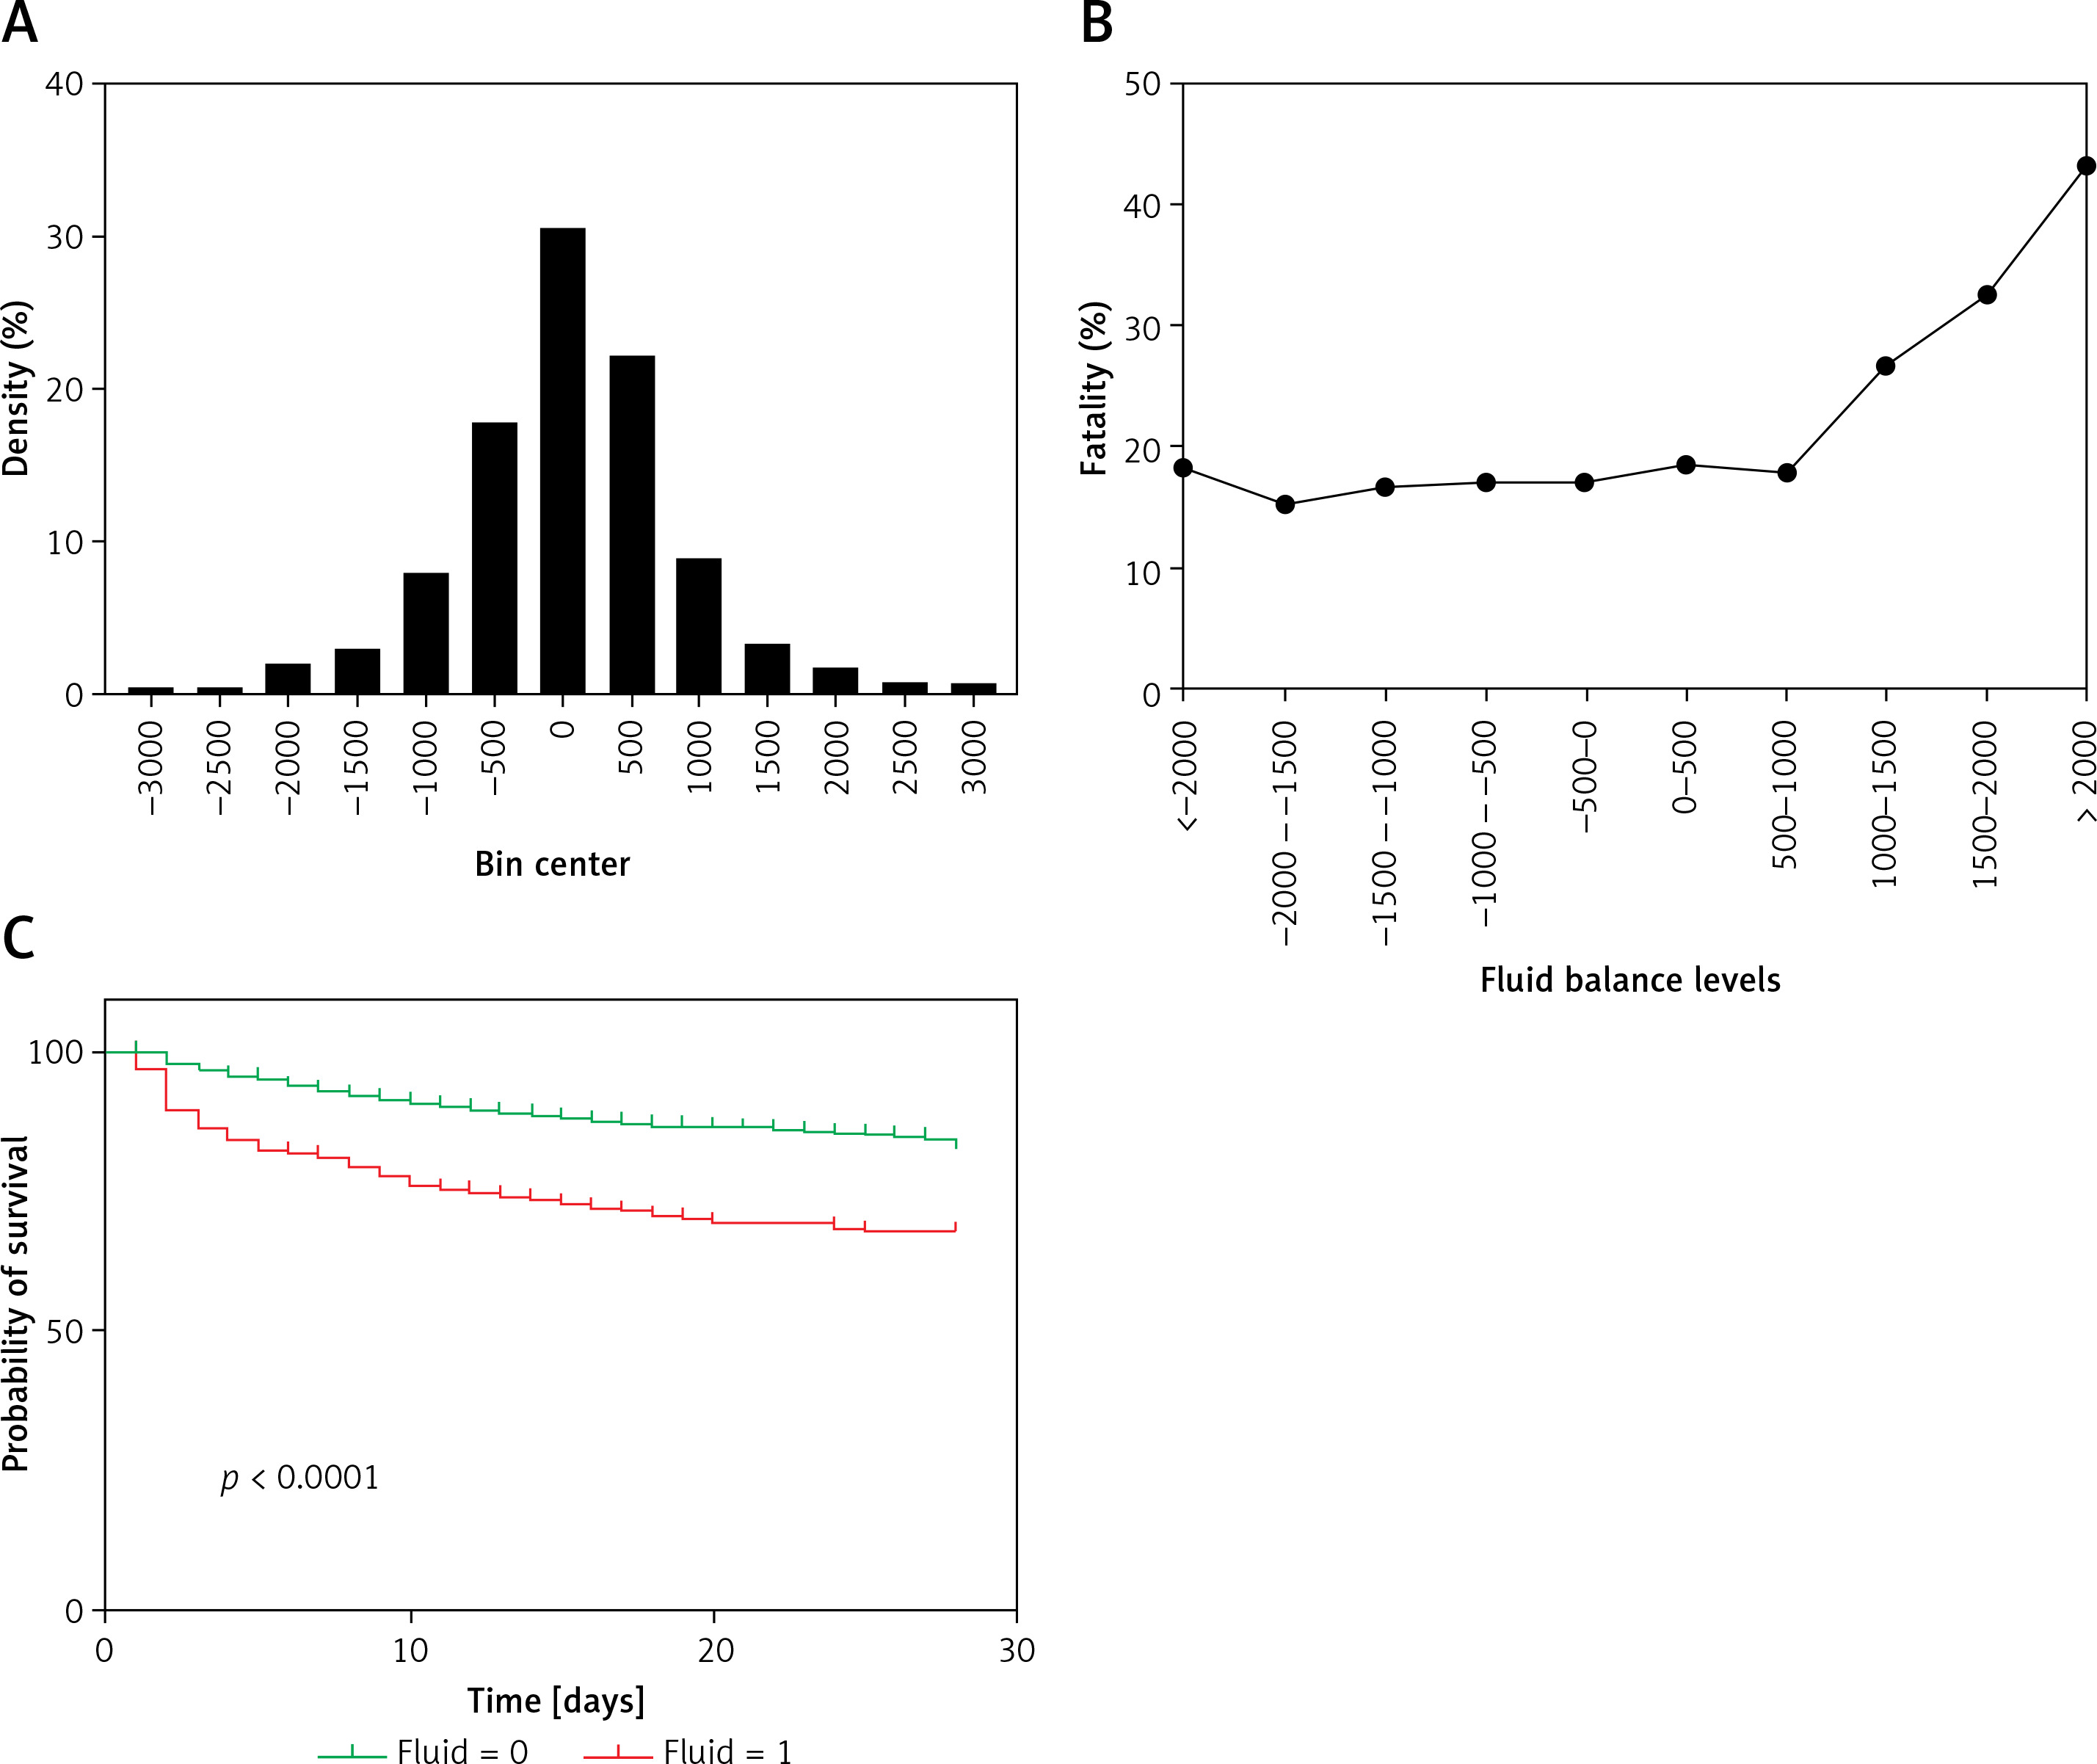
Survival curves for the time-to-event of all groups, including for a total fluid balance over 0–6 h that was greater than 1000 ml and less than 1000 ml, were drawn for the training cohort. The survival rate shown in Figure 2 C was significantly lower for the higher total fluid group than for the lower fluid group.
Multivariate analysis and relevant factors
In the multivariate analysis, there were significant associations (p < 0.1) between the outcome and nine factors (Table IV): sex (p = 0.03), PO2/FiO2 (p < 0.001), serum creatinine (p < 0.001), FiO2 (p < 0.001), platelets (p = 0.002), respiratory rate (p < 0.001), SPO2 (p = 0.05), temperature (p = 0.08), and total fluid volume (p < 0.001). Among the nine variables, a total fluid balance over 0–6 h that was greater than 1000 ml or less than 1000 ml was the most important, and the odds ratio was 1.98 (95% CI: 1.41–2.77).
Table IV
Baseline characteristics of the testing data
Model performance and validation
In the training cohort, the ROC analysis and the multiple logistic regression of the new model, SOFA model and APACHE II model showed that the corresponding areas under the curve (AUCs) were 0.749 (95% CI: 0.7235–0.77740), 0.687 (95% CI: 0.6585–0.7157), and 0.732 (95% CI: 0.7062–0.7586), respectively (Figure 3 A). Among the AUCs of the three models, the AUC of the new model was higher than that of the SOFA model (p < 0.001) and the APACHE II model (p = 0.292), and the relative optimal cutoff point was 0.190, corresponding to a sensitivity of 0.676 and a specificity of 0.689. Compared with the new model, the SOFA model’s sensitivity and specificity were both lower. Although the APACHE II model’s specificity was higher than that of the new model, its sensitivity was much lower than that of the new model and was just 0.569.
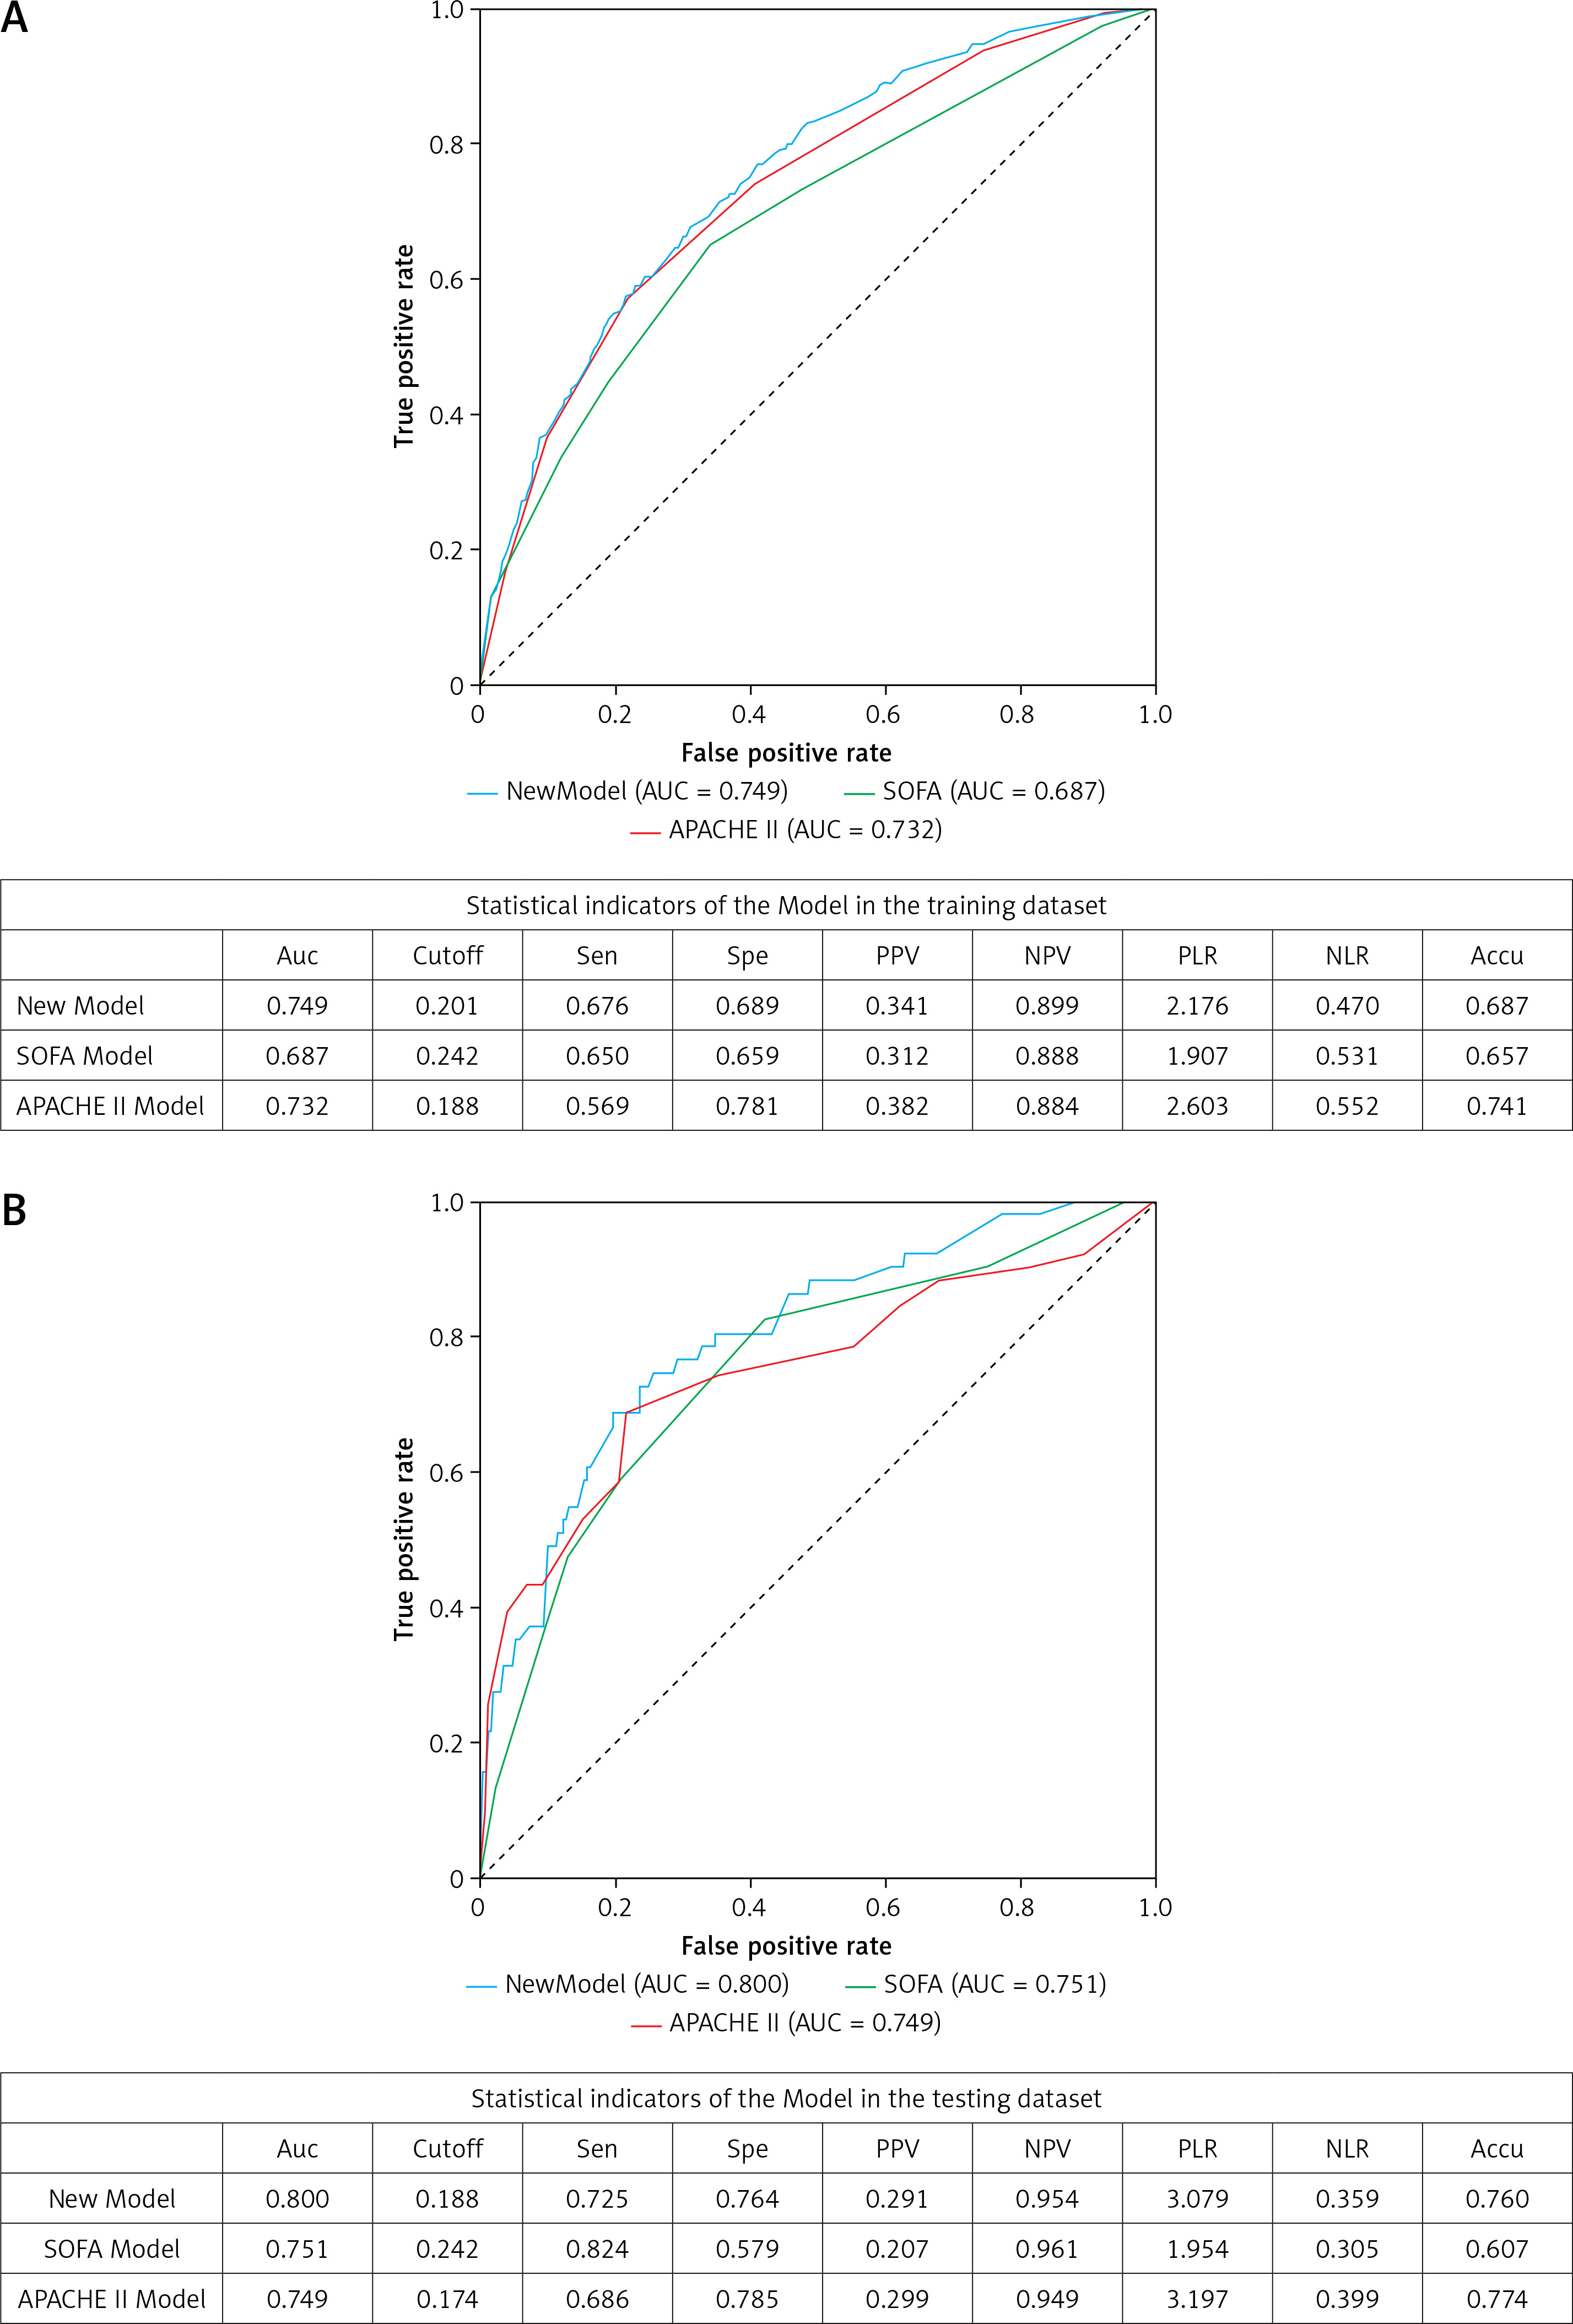
In the verification cohort, the AUCs of the new model, SOFA model and APACHE II model were 0.8 (95% CI: 0.7335–0.8659), 0.751 (95% CI: 0.6767–0.8243), and 0.749 (95% CI: 0.6639–0.8343), respectively (Figure 3 B). The AUC of the new model was higher than that of the SOFA model (p = 0.125) and the APACHE II model (p = 0.275), consistent with the results in the training cohort. The specificity of the new model was higher than that of SOFA, and the sensitivity of the new model was higher than that of APACHE II.
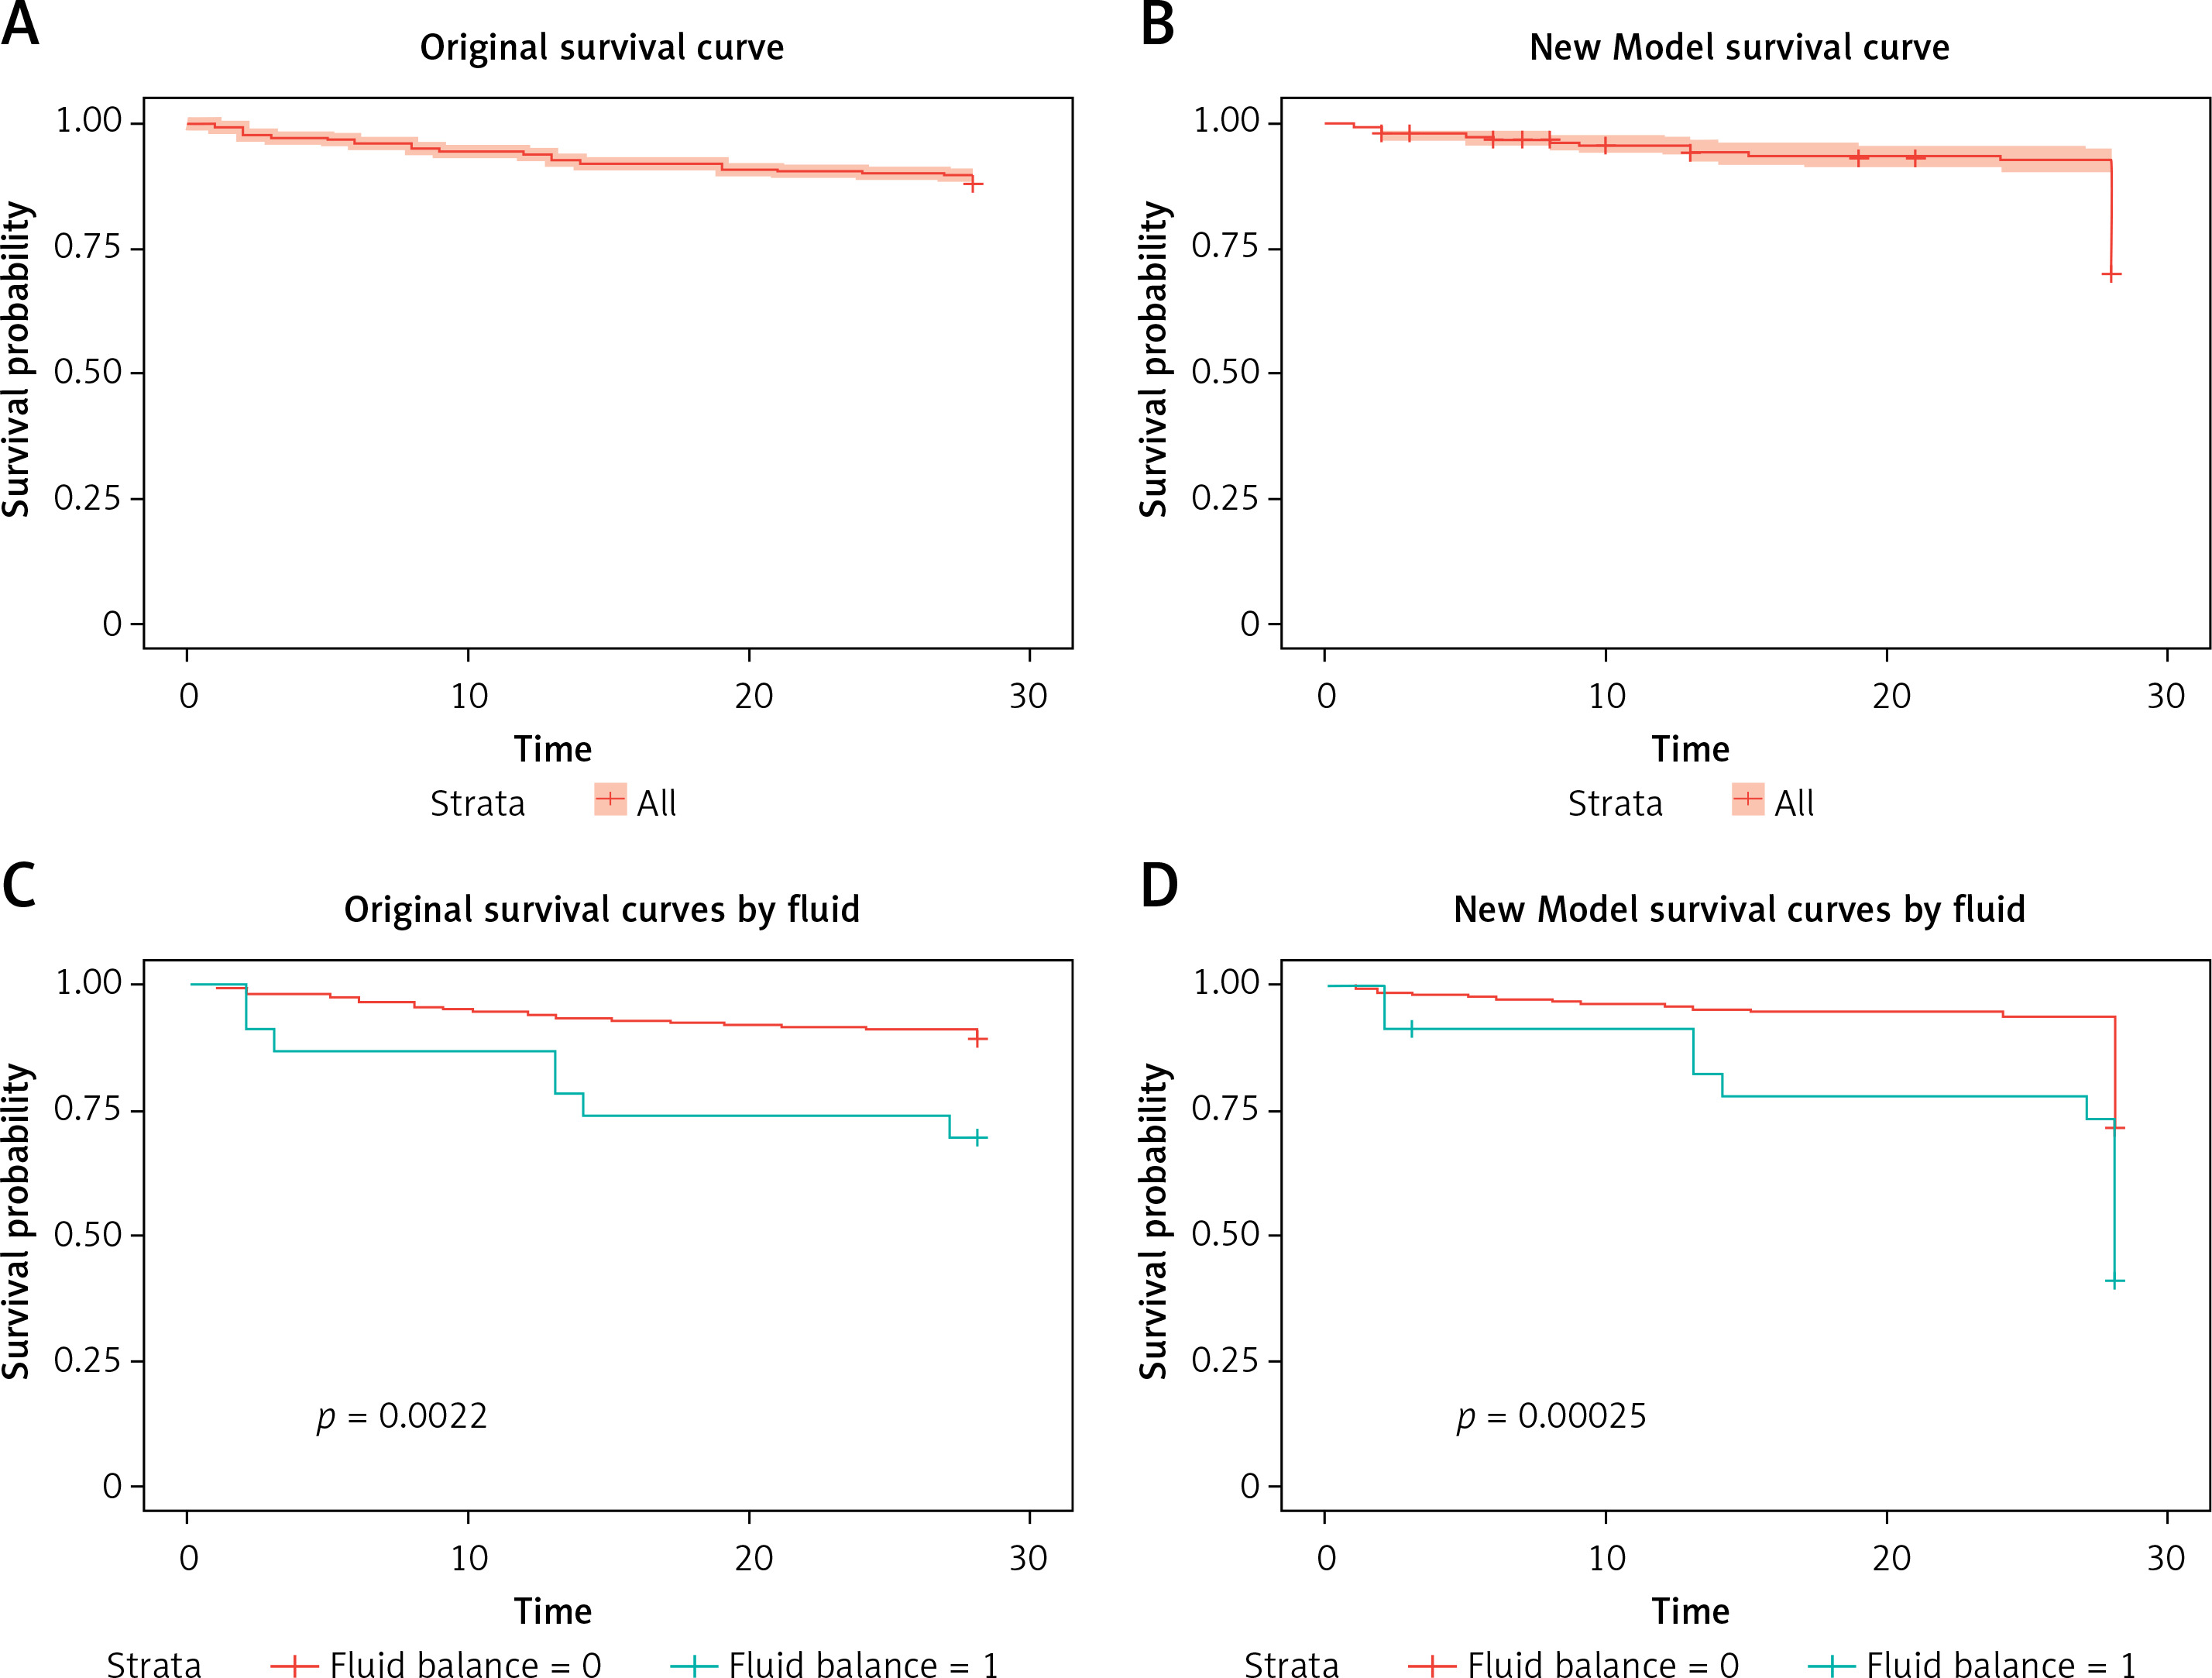
At the 28-day follow-up, the survival curve of the original outcome in the verification cohort was consistent with the predicted outcome, which was calculated by the cutoff of the new model measured above (Figures 4 A, B). The original mortality and the predicted mortality from any cause (the primary endpoint) in the verification cohort, as calculated using a Kaplan-Meier analysis, were both significantly higher in the group with a fluid balance exceeding 1000 than in the group with lower fluid balance (p < 0.01) (Figures 4 C, D).
Positive fluid balance and hypoxemia cause poor outcome
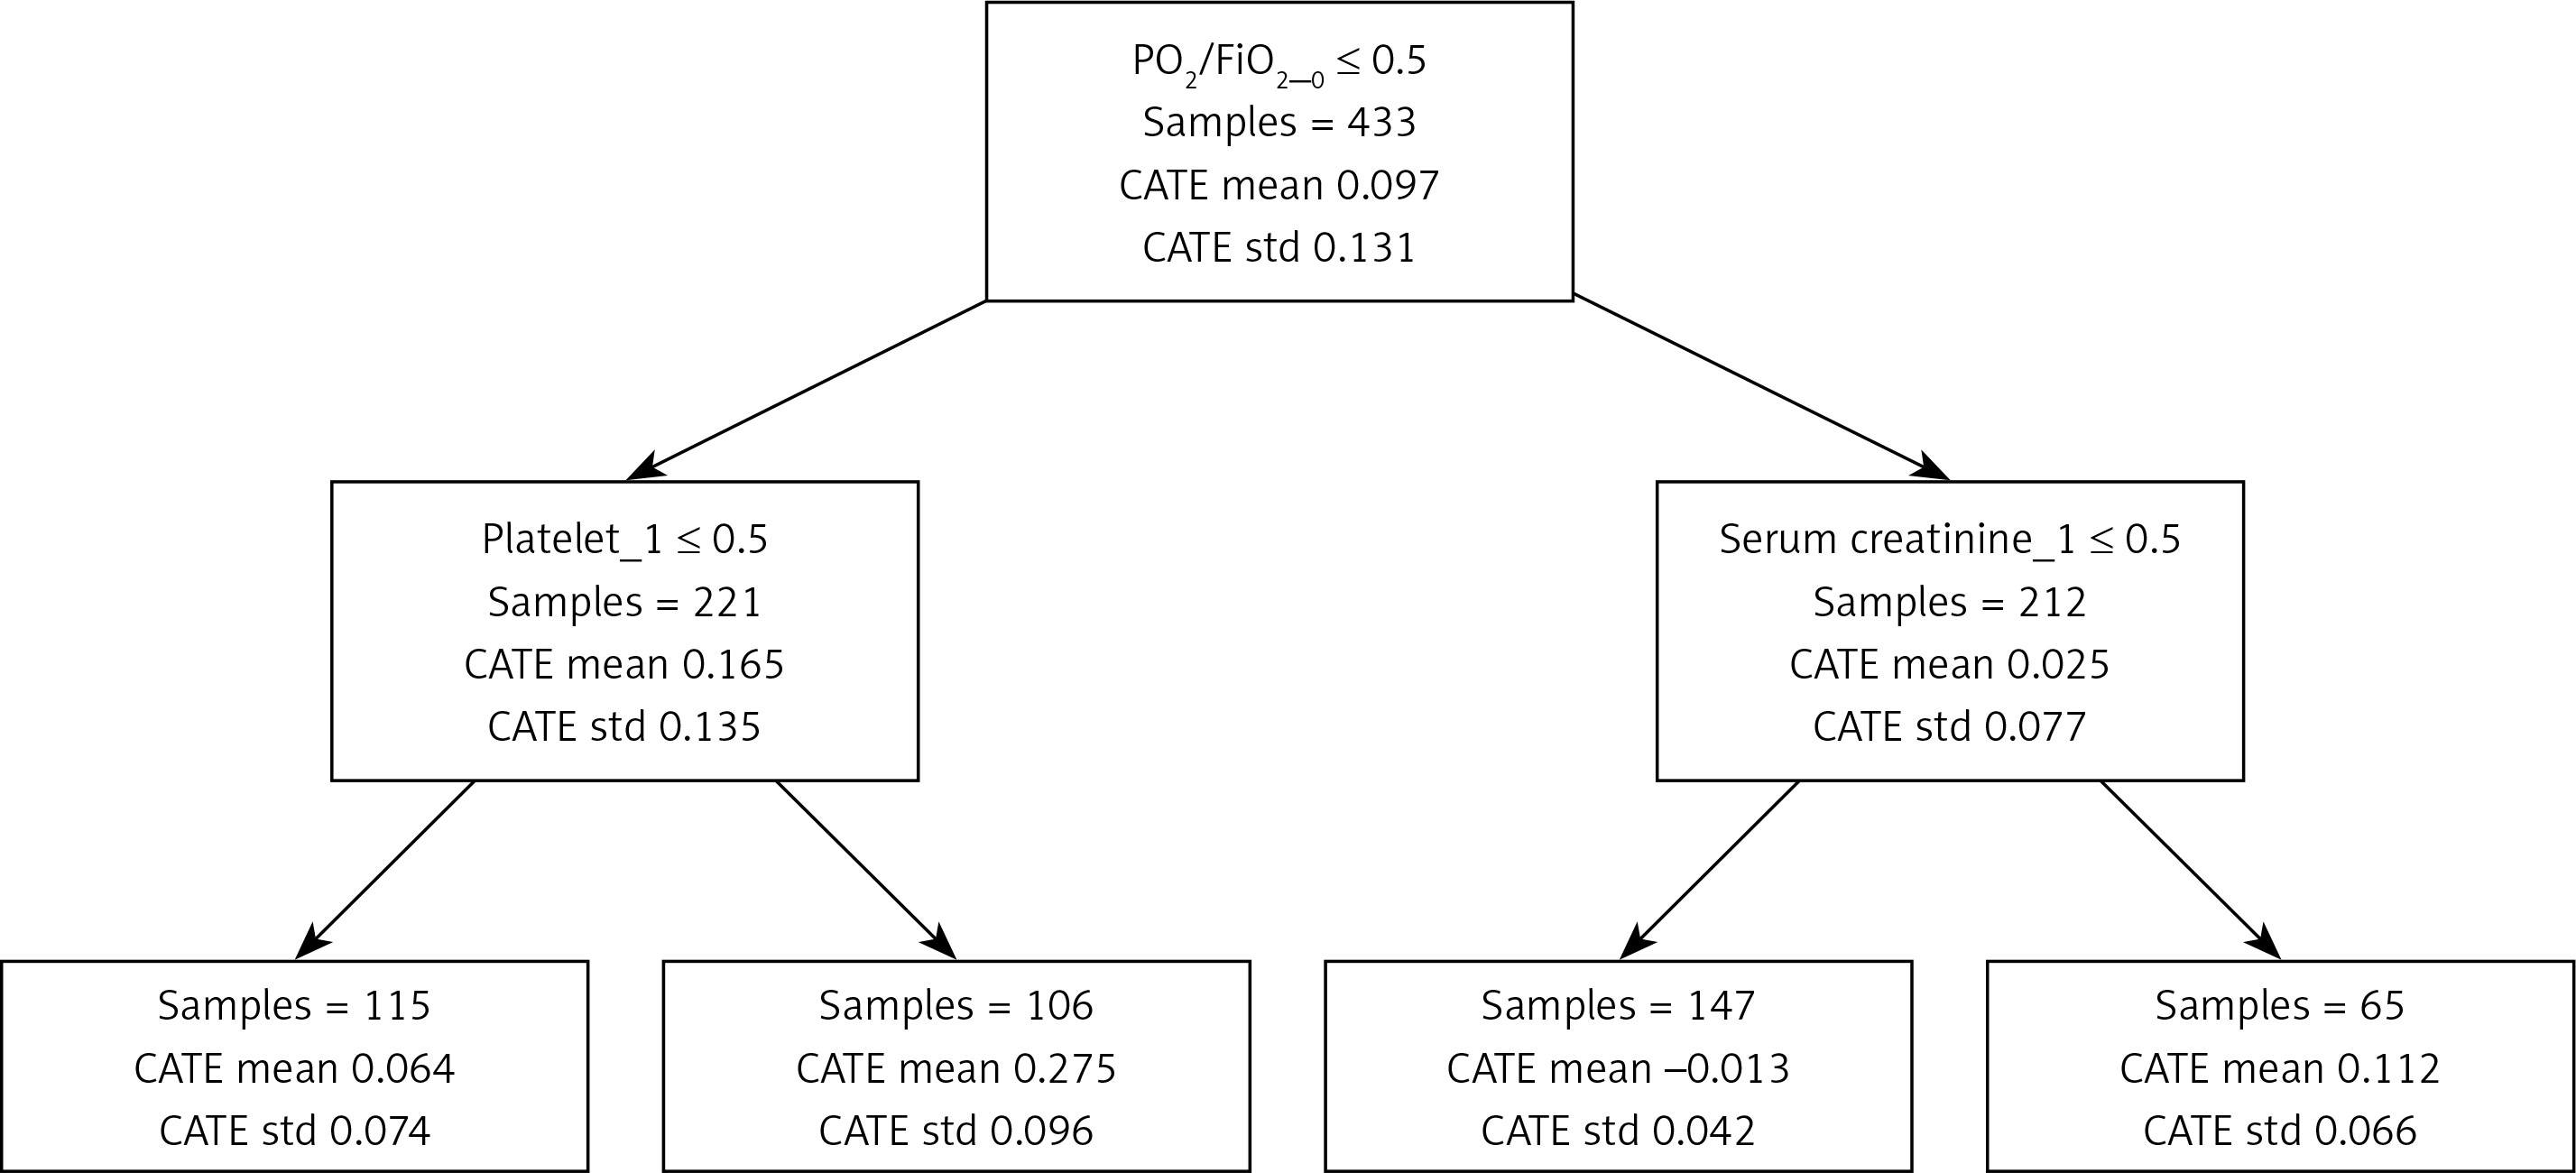
From Figure 5, the population with PO2/FiO2 ≤ 300 and platelets < 150 had a stronger tendency to adverse outcomes based on the causal forest model. The reason for the poor outcome in patients with positive fluid balance is hypoxia.
Discussion
We found that in the training cohort, in terms of both the total fluid balance per hour and the total fluid balance over 6 h after ICU admission, the deceased group had significantly higher fluid levels than the alive group. Univariate analysis showed that fluid balance was an independent risk factor for death, and we found that with a total balance of 1000 ml as a cutoff, there was a significant difference in patient mortality and survival curves between groups. Therefore, we used the fluid balance factor to create two categories for multifactor regression and found that fluid balance was the highest risk factor for patient mortality. We established a death prediction model and found that the death prediction model established with fluid balance and the other 8 factors had higher diagnostic efficiency. Moreover, we verified the efficiency of the death prediction model in the verification cohort. Compared with the traditional APACHE II and SOFA scores, our model had a better prediction performance, and the stability of the prediction model was confirmed. Eventually we found that patients who were hypoxemic deteriorated due to a large positive fluid balance.
A recent evaluation of 12 randomized trials and 31 observational studies found that EGDT may be harmful to patients with severe disease in the ICU [19]. After large-dose fluid resuscitation for patients with septic shock, the outcome was poor. Open fluid resuscitation is detrimental to critically ill patients and can lead to increased tissue edema, including damage to vital organs such as the lungs, heart, intestines, and brain [20]. It has been shown that the 12-hour fluid balance in patients with septic shock is positively correlated with central venous pressure (CVP), which increases as the 28-day mortality increases; that is, the higher the positive fluid balance is, both early in resuscitation and cumulatively over 4 days, the higher is the mortality [21]. Another study reported that in the conservative fluid treatment group of patients with acute respiratory distress syndrome (ARDS), although the primary outcome of 60-day mortality is not significantly different from that of the open-treatment group, the conservative infusion management strategy improves lung function and shortens the duration of mechanical ventilation and intensive care stay without increasing the rate of nonlung organ failure [22]. Early and late infusion management of septic shock complicated with acute lung injury (ALI) may affect patient prognosis [23]. Positive fluid balance affects the withdrawal outcomes of patients on mechanical ventilation [24]. Positive fluid balance is an important factor associated with increased 60-day mortality. Patients who receive renal replacement therapy (RRT) treatment have better outcomes when RRT is started early after ICU hospitalization [25]. In critically ill patients with renal replacement therapy, fluid overload is associated with an increased risk of death at 90 days [26]. In addition, fluid overload increases abdominal compartment syndrome [27]. These are all evidence of why excessive fluid is detrimental. Our study found that fluid overload is an important risk factor for unfavorable outcomes in critically ill patients. The results revealed that in the first 6 h after ICU admission, additional fluid was not required to achieve a satisfactory resuscitation process. A positive balance of 1000 ml within 6 h became a cutoff point to divide patients into two groups with different prognoses, with significant differences in mortality and survival time between the two groups. The resuscitation strategy for shock with fluids is now gradually recognized and divided into four phases, known as ROSE: resuscitation, optimization, stabilization, and evacuation [8, 20, 28, 29]. However, how to transition between the boundaries of these four stages is not clear. Our study proposes a median total balance of 1000 ml, which may provide a reference value for future clinical resuscitation. To some extent, sepsis patients do not require large infusions upon initial admission to the ICU.
Since the SOFA score was introduced [30], its popularity to evaluate septic organ function damage has been rising, and this score has become one of the criteria to diagnose sepsis. When a SOFA score is used for patients with severe sepsis and if hypoperfusion occurs during hospitalization in the ED, the SOFA score can provide potentially valuable prognostic information about in-hospital survival [31]. The SOFA scoring system is fairly accurate in predicting 1-month mortality in critically ill patients [32]. A multicenter study from Southeast Asia confirmed that the SOFA score can effectively predict the mortality of patients with sepsis [33]. However, some researchers do not support these views at present and believe that the SOFA and qSOFA scores have no better predictive ability for mortality and even suggest that deltaSOFA may be effective in evaluating prognosis [34]. The development of a method for further early assessments of patient prognosis is still a hot topic in current clinical work. In this study, based on the discovery that positive fluid balance is a risk factor, this variable was combined with other risk factors to predict patient mortality, and a model was established, thereby including some indicators that are not in the SOFA score. The ability of this model to predict the mortality rate was compared with that of the traditional SOFA scores. In the training cohort, it was found that the model was more efficient than the SOFA score in predicting the mortality rate. It is possible that considering both fluid balance and the amount of vasoactive drugs administered was beneficial. As discussed in one study, the treatments selected by artificial intelligence (AI) are on average more reliable than those selected by human clinicians, as AI prefers vasoactive drugs rather than fluid treatment [35]. Combined with the current research results, it is worthwhile to consider whether the total fluid amount can be added to the determination needed to further improve the SOFA levels. In addition, the prediction of mortality in the context of big data may be different from that in the traditional sense, and more parameters may be needed to correct the baseline regimen. Furthermore, machine learning is increasingly used, and further research is needed.
The following limitations exist in this study: (1) changes in indicators without changes in organ function and organ function evaluations were not included, and death during the ICU stay was the only outcome; and (2) apart from fluid balance and vasopressors, the total amount of fluid during the first 6 h of sepsis onset, type of infection, source control, antibiotic type and delay in administration, inotropes, and blood transfusion when indicated will also impact mortality. Therefore, we may have overlooked the importance of these risk factors for death. However, we cannot deny the important risk of fluid treatment. (3) A time-varying regimen is very important for big data studies, and learning techniques can be used to further clarify the timing and amount of infusion. An intelligent decision system for fluid therapy based on big data and treatment processes needs to be formed. (4) There was no significant difference between the two groups of patients in terms of basic characteristics such as age and sex. However, there were significant differences in some other indicators. One such factor is the outbreak of COVID-19 from the end of 2019 to 2020. Significant changes have taken place in the structure of hospital admissions. This change would have had a certain impact on our results. We also acknowledge that the very few deaths of patients in the validation set may had led to statistical errors. Therefore, prospective clinical studies are needed to further confirm the stability of the model. (5) This is a Chinese sepsis cohort study based on one center. These data have well documented the relationship between the dose and timing of fluid therapy and patient outcomes. However, more studies on resuscitation should be done for patients with different severity levels, countries and medical conditions.
In conclusion, the 6-hour positive fluid balance after ICU admission is a risk factor for unfavorable outcomes in sepsis patients in the ICU, and the clinical balance should be carefully monitored for 6 h during the resuscitation process. Decision models based on risk factors, including those over the entire 6 h, contribute to the prognostic prediction for sepsis patients. What we must emphasize is that the first 6 h of ICU admission are different from the first 6 h since sepsis onset. Liberal or arbitrary fluid resuscitation without a target is an incorrect approach, especially in patients with hypoxemia. There is a need for more big data studies on resuscitation, and further decision-making based on similar unsupervised learning is necessary to benefit these patients.