Introduction
Gastric cancer (GC) is the fourth most prevalent cancer worldwide and is the second most common cause of cancer deaths [1]. Despite the significant progress in therapeutic options, including surgery, chemotherapy, and radiotherapy, treatment results are still very poor. Advanced disease with lymph node involvement and remote metastases, which is most commonly diagnosed in Central/Eastern Europe [2, 3], is still a challenge for surgeons and oncologists. Resistance to chemotherapy/radiotherapy mostly contributes to treatment failure in advanced GC.
Recent research studies indicate that in gastrointestinal malignancies, immune responses may attenuate tumor growth and influence the clinical course of the disease. Several types of tumor infiltrating lymphocytes (TILs) are associated with a better prognosis in various human cancers [4, 5]. The TILs consist of several effector and regulatory subsets. CD8(+) and CD4(+) T lymphocytes are effector cells thought to be associated with a favorable prognosis [6, 7]. While CD8(+) T cells are the main effectors of antitumor immunity, CD4(+) T cells induce and maintain the CD8(+) response [8]. In order to block the immune cancer-dependent reaction, tumors develop special mechanisms including dysregulation of “immune checkpoints” [9, 10].
The axis of programmed death receptor-1 (PD-1) and programmed death ligand-1 (PD-L1) is one of the immune checkpoint pathways that can be exploited by tumor cells to evade immuno-surveillance by the host. PD-L1 is expressed on several tumor cells and binding to PD-1 may downregulate tumor-specific T-cell activity in the tumor microenvironment [11]. Anti-PD-1/PD-L1 immunotherapy has recently been shown to be effective against GC in clinical trials. However, the value of PD-L1 in predicting anti-PD-1/PD-L1 treatment outcomes in patients with gastric cancer is controversial. The precise role of PD-1-PD-L1 inhibition of the immune response in gastric cancer is unknown.
The aim of the study was to assess the expression of PD-1 and PD-L1 on T lymphocyte subsets in peripheral blood in patients with advanced gastric cancer. The results of our study could help to clarify immunosuppression in GC patients and reveal potential correlations between peripheral T cytotoxic and T helper cells in this group and associations with clinicopathological features.
Material and methods
Patients and healthy controls
Forty consecutive Caucasian patients (33 male and 7 female) treated for primarily diagnosed advanced gastric adenocarcinoma, without any previous neoadjuvant treatment, were included in the study. GC was diagnosed by performing histopathology tests of tumor endoscopic biopsies. The staging was conducted postoperatively using Union International for Cancer Control (UICC) TNM staging (7th Edition) [12]. The mean age of patients was 61.85 ±10.07 years (ranging from 40 to 77 years; median: 63). Peripheral blood (PB) from 20 healthy donors, with a mean age of 56.83 ±10.24 (ranging from 43 to 70 years; median: 57), was used as a control. Both in patients and healthy donors, peripheral blood white blood cell count was within the normal range: between 4 and 10 G/l. None of the patients or controls showed signs of infection at the time of investigation, and for a month before surgery, none had been taking drugs of known influence on the immune system. None of the patients or healthy donors had undergone a blood transfusion. Individuals with allergic diseases in anamnesis and other current or past oncological/oncohematological disease in anamnesis were excluded from the study. The research protocol was approved by the local Ethics Committee (decision no. KE-0252/176/2013), and all patients gave written informed consent.
Isolation of peripheral blood cells and the detection of PD-1-positive and PD-L1-positive CD4(+) and CD8(+) T cells
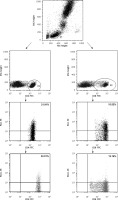
Isolation of peripheral blood cells and detection of PD-1-positive and PD-L1-positive T lymphocytes were performed as described previously [13]. Briefly, venous blood samples in the amount of 5 ml were collected from the study patients and controls by venipuncture using sterile, S-Monovette plasma lithium heparin-treated tubes (Sarstedt, Nümbrecht, Germany). Peripheral blood mononuclear cells were aseptically separated via standard density gradient centrifugation for 1 h after being obtained from the patients and controls (Gradisol L, Aqua Med, Lodz, Poland). The percentages of cells expressing surface markers were analyzed. The cells were phenotypically characterized via incubation (20 min in the dark at room temperature) with a combination of relevant fluorescein isothiocyanate (FITC) – phycoerythrin (PE) – and CyChrome-labeled monoclonal antibodies (mAbs). Immunofluorescence studies were performed using a combination of the following mAbs purchased from BD Biosciences (San Jose, CA, USA): CD45 FITC/CD14 PE, CyChrome Mouse Anti-Human CD3, FITC Mouse Anti-Human CD4, FITC Mouse Anti-Human CD8, PE Mouse Anti-Human CD279 (PD-1) and PE Mouse Anti-Human CD274 (PD-L1). Three-color immunofluorescence analyses were performed using a FACSCalibur flow cytometer (Becton Dickinson, San Diego, CA, USA) equipped with a 488 nm argon laser. A minimum of 10,000 events were acquired and analyzed using CellQuest software. The results were presented as a percentage of the cells stained with antibody. The percentage of positive cells was calculated via a comparison with the control. Background fluorescence was determined using isotype-matched directly conjugated FITC Mouse IgG1 j Isotype Control and PE Mouse IgG1 j Isotype Control mAbs. In order to exclude debris and cell aggregates, the samples were gated on forward scatter vs. side scatter. An example cytometric analysis is presented in Figure 1.
Figure 1
An example of a three-color flow cytometry analysis of PD-1 and PD-L1 antigen expression on T lymphocytes from a patient with gastric cancer. The upper dot plot shows the forward scatter/side scatter (FSC/SSC) distribution and the gate used to select lymphocytes for analysis. The left column dot-plots represent an example of PD 1-positive and PD-L1-positive CD4(+) cells. The right column dot-plots represent an example of PD-1-positive and PD-L1-positive CD8(+) cells. The numbers in the upper right quadrant in the dot-plots show the percentage of PD-1 positive and PD-L1 positive cells
Statistical analysis
The normal distribution of continuous variables was verified with the Shapiro-Wilk test. Frequencies of the cells are presented as percentages, while continuous variables are presented as means and standard deviations. The Mann-Whitney U test and Student’s t-test were applied to intergroup comparisons of the variables, according to the distribution. Pearson’s linear correlation coefficient (r) was calculated to reveal relationships between variables. All calculations were conducted using Statistica 10 software (StatSoft, USA). A p-value (derived from two-tailed tests) less than 0.05 was considered statistically significant.
Results
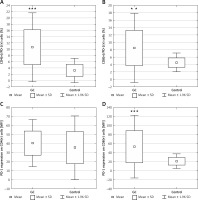
Patients’ characteristics are shown in Table I. The results are presented in the form of percentage values of the cells presenting the expression of a given antigen and the mean fluorescence intensity (MFI), which is the mean score of the density of expression of a given molecule on a cell. Our study revealed that in the GC group, the percentage of T lymphocyte subsets with PD-1 expression including CD4(+) (mean: 10.6 ±5.62%), and CD8(+) (mean: 8.46 ±4.77%) was significantly higher than in the respective control group; that is, CD4(+) (mean: 3.14 ± 1.97%; p < 0.0001; Figure 2 A), CD8(+) (mean: 4.5 ±1.29%; p < 0.01; Figure 2 B). There was no difference in MFI values for PD-1 antigen expression on CD4(+) cells between the GC and respective control group (Figure 2 C). MFI values for PD-1 antigens on CD8(+) cells in the GC group (mean: 53.49 ±35.49) were significantly higher than those for the control group (mean: 21.07 ±8.25; p < 0.0001; Figure 2 D).
Table I
Clinical and pathological characteristic of the studied gastric cancer patient group (n = 40)
| Parameter | Value | |||
|---|---|---|---|---|
| Age (mean ± SD) [years] | 61.85 ±10.07 | |||
| Parameter | N | Percentage | ||
| Sex* | Male | 33 | 82.5 | |
| Female | 7 | 17.5 | ||
| Staging (UICC 7th Edition) | I | B | 1 | 2.5 |
| II | A | 7 | 17.5 | |
| B | 6 | 15 | ||
| III | A | 11 | 27.5 | |
| B | 3 | 7.5 | ||
| C | 5 | 12.5 | ||
| IV | 7 | 17.5 | ||
| Grading (histological differentiation of tumor) | G1 | 6 | 15 | |
| G2 | 10 | 25 | ||
| G3 | 24 | 60 | ||
| Lauren classification | Intestinal | 22 | 55 | |
| Diffuse | 18 | 45 | ||
Figure 2
A – Diagram presenting the difference between the percentage of CD4(+)/PD-1(+) lymphocytes in gastric cancer patients and healthy controls (***p < 0.0001 vs. control); B – diagram presenting the difference between the percentage of CD8(+)/PD-1(+) lymphocytes in gastric cancer patients and healthy controls (**p < 0.01 vs. control); C – diagram presenting MFI values of PD-1 molecule on CD4(+) lymphocytes in gastric cancer patients and healthy controls – the difference was not statistically significant; D – diagram presenting the difference between MFI values for PD-1 molecules on CD8(+) lymphocytes in gastric cancer patients and healthy controls (***p < 0.0001 vs. control)
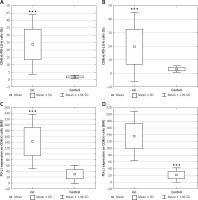
In the GC group, the percentage of T lymphocyte subsets with PD-L1 expression including CD4(+) (mean: 23.76 ±10.29%), and CD8(+) (mean: 19.67 ±13.05%) was significantly higher than in the respective control group; that is, CD4(+) (mean: 1.76 ±0.56%; p < 0.0001; Figure 3 A), and CD8(+) (mean: 3.10 ±1.23%; p < 0.0001; Figure 3 B). MFI values for PD-L1 antigens on CD4(+) cells (mean: 142.79 ±47.85) and CD8(+) cells (mean: 136.07 ±37.52) in the GC group were significantly higher than in the respective control group: CD4(+) cells (mean: 29.85 ±15.84; p < 0.0001; Figure 3 C) and CD8(+) (20.49 ±10.72; p < 0.0001; Figure 3 D).
Figure 3
A – Diagram presenting the difference between the percentage of CD4(+)/PD-L1(+) lymphocytes in gastric cancer patients and healthy controls (***p < 0.0001 vs. control); B – diagram presenting the difference between the percentage of CD8(+)/PD-L1(+) lymphocytes in gastric cancer patients and healthy controls (***p < 0.0001 vs. control); C – diagram presenting the difference between MFI values for PD-L1 molecules on CD4(+) lymphocytes in gastric cancer patients and healthy controls (***p < 0.0001 vs. control); D – diagram presenting the difference between MFI values for PD-L1 molecules on CD8(+) lymphocytes in gastric cancer patients and healthy controls (***p < 0.0001 vs. control)
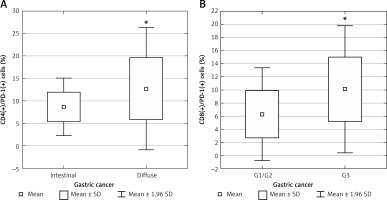
Subset analysis revealed a higher percentage of CD4(+)/PD-1(+) cells in diffuse-type tumors (according to the Lauren classification) (mean: 12.71 ±6.92%) compared to intestinal-type tumors (mean: 8.7 ±3.27%; p < 0.029; Figure 4 A). A higher percentage of CD8(+)/PD-1(+) cells was found in patients with poorly differentiated tumors (G3) (mean: 10.10 ±4.93%) compared to G1/G2 tumors (mean: 6.29 ±3.6%; p < 0.019; Figure 4 B). No significant differences in PD-1(+) and PD-L1(+) cell percentages were found compared to patients at UICC stages I/II and III/IV.
Figure 4
A – Diagram presenting the difference between the percentage of CD4(+)/PD-1(+) lymphocytes in diffuse- type and intestinal-type gastric cancer (*p < 0.029); B – diagram presenting the difference between the percentage of CD8(+)/PD-1(+) lymphocytes in poorly differentiated and well/moderate differentiated gastric cancer (*p < 0.019)
A significant positive correlation in the GC group was revealed between the percentage of CD4(+)/PD-1(+) cells and CD8(+)/PD-1(+) cells (r = 0.624; p < 0.0001; Figure 5 A). A positive correlation was also found between the percentage of CD4(+)/PD-1(+) cells and higher MFI values for PD-1 expression on CD4(+) cells (r = 0.478, p < 0.002; Figure 5 B). Similarly, a positive correlation was revealed between the percentage of CD4(+)/PD-L1(+) cells and higher MFI values for PD-L1 expression on CD4(+) cells (r = 0.385, p < 0.01; Figure 5 C).
Figure 5
A – Scatter diagram presenting positive correlation found in gastric cancer patients between CD4(+)/ PD-1(+) cells and CD8(+)/PD-1(+) cells (r = 0.624; p < 0.0001); B – Scatter diagram presenting positive correlation found in gastric cancer patients between the percentage of CD4(+)/PD-1(+) cells and higher MFI values for PD-1 expression on CD4(+) cells (r = 0.478, p < 0.002); C – Scatter diagram presenting positive correlation found in gastric cancer patients between the percentage of CD4(+)/PD-L1(+) cells and higher MFI values for PD-L1 expression on CD4(+) cells (r = 0.385, p < 0.01); D – Scatter diagram presenting negative correlation found in gastric cancer patients between the percentage of CD8(+)/PD-1(+) cells and PD-L1 expression on CD8(+) cells (r = –0.324, p < 0.05); E – Scatter diagram presenting negative correlation found in gastric cancer patients between MFI values for PD-L1 expression on CD8(+) cells and MFI values for PD-L1 expression on CD4(+) cells (r = –0.528, p < 0.001); F – Scatter diagram presenting negative correlation found in gastric cancer patients between the percentage of CD4(+)/PD-L1(+) cells and the percentage of CD8(+)/PD-1(+) cells (r = –0.522, p < 0.001)
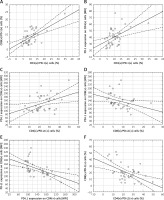
A significant inverse correlation in the GC group was found between the percentage of CD8(+)/PD-1(+) cells and PD-L1 expression on CD8(+) cells (r = –0.324, p < 0.05; Figure 5 D), as well as between MFI values for PD-L1 expression on CD8(+) cells and MFI values for PD-L1 expression on CD4(+) cells (r = –0.528, p < 0.001; Figure 5 E). A negative correlation was also found between the percentage of CD4(+)/PD-L1(+) cells and the percentage of CD8(+)/PD-1(+) cells (r = –0.522, p < 0.001; Figure 5 F).
Discussion
The aim of the present study was to assess the frequencies of PD-1(+) and PD-L1(+) cells and the expression of PD-1 and PD-L1 molecules on PB lymphocyte CD4(+) and CD8(+) subsets in patients treated for advanced gastric cancer.
PD-L1 is expressed on a variety of cell types, including epithelium, mesenchymal stem cells, B cells, T cells, dendritic cells, macrophages, and mast cells [9]. PD-1 and PD-L1 expression on tumor cells has been intensively studied. In gastrointestinal malignancies, the PD-L1 molecule is expressed in 20–55% of tumors [11]. About 40% of gastric cancer cells express the PD-L1 molecule [11], but this value can vary between tumors with different immune signatures. Epstein-Barr virus infection positive (EBV+), and microsatellite instability high (MSI-H) gastric tumors are more prone to PD-L1 expression [14, 15]. However, unlike other solid tumors, there is minimal PD-L1 expressed on the cancer cells. Expression occurs predominantly on infiltrating myeloid cells within the tumor microenvironment [16, 17].
CD8(+) cells constitute one of the most important subsets of tumor infiltrating lymphocytes. In GC, high densities of TILs, including cytotoxic T cells, are associated with better prognosis and indicate that adaptive immunity prevents tumor growth [18]. PD-L1 expressed on cancer cells and binding to its cognitive receptor PD-1 on the surface of immune cells downregulates tumor-specific T-cell activity in the tumor microenvironment and as a result contributes to tumor evasion of immuno-surveillance by the host [11]. Recently, anti-PD-1 therapy in gastric cancer has suggested promising results. In patients suffering from advanced disease, pembrolizumab has been associated with a response rate of 20% in PD-L1-positive tumors, and a response rate of 12% in unselected tumors [17]. Improved survival rates for patients with advanced, chemo-resistant gastric cancer have also been reported after treatment with a chemotherapy drug (nivolumab; anti-PD-1) [19]. However, there are insufficient data to determine whether PD-L1 expression predicts the efficacy of anti-PD-1 therapy in gastric cancer, and some of the results are controversial.
Several studies concerning the role of PD-1/PD-L1 in the anticancer immune response have focused on TILs. Saito et al. found that PD-1 expression on CD4+ and CD8+ T cells from gastric cancer tissue was significantly higher than in normal gastric mucosa and peripheral blood mononuclear cells (PBMC) [20]. In another study PD-L1 expression was a significant adverse prognostic factor in a high CD8(+) TIL gastric cancer group [21].
Fewer data are available concerning the status of PD-1/PD-L1 molecules on peripheral blood lymphocytes. Saito et al. investigated PD-1 expression on CD4(+) and CD8(+) T cells in PBMC, normal gastric mucosa, and gastric cancer tissue. PD-1 expression on CD4(+) and CD8(+) T cells from GC patients was significantly higher compared to normal controls [20]. Significantly more PD-1(+) and T-cell immunoglobulin-3 (Tim-3) positive CD8(+) T cells were found in peripheral blood from gastric cancer patients compared to healthy controls. PD-1(+)/CD8(+) T cells were correlated with Tim-3(+)/CD8(+) T cells in peripheral blood from gastric cancer patients [22]. These results from Asian patients correspond to our findings. The results show that the percentage of lymphocyte CD4(+) and CD8(+) subsets presenting PD-1 expression is significantly higher than in the control group. Expression of PD-1 antigens on CD8(+) cells in the GC group was significantly higher than that in the control group. Moreover, the percentage values for CD4(+)/PD-1(+) and CD8(+)/PD-1(+) cells in peripheral blood were positively correlated. This fact may suggest that mechanisms of PD-1/PD-L1-dependent dysfunction in CD4(+) and CD8(+) cells can appear simultaneously. The detailed mechanism is unknown, but it could involve impairment of interferon-γ, tumor necrosis factor-α and interleukin-2 production by CD8(+)/PD-1(+) cells compared to those PD-1-negative subsets in both peripheral and tumor-associated lymphocytes of GC patients, as has been previously reported [20, 23]. In advanced gastric cancer a similar positive correlation was found between peripheral blood CD4(+) and CD8(+) T cells presenting expression of CD200 – another molecule delivering immunoregulatory signals [24].
The study also aimed to assess the PD-L1 status on peripheral CD4(+) and CD8(+) cells in GC patients. Schlöβer et al. reported that PD-L1 and its cognate receptor PD-1 are widely expressed on T and B cells in primary gastric cancer, lymph nodes and peripheral blood in Caucasian patients. Although the percentage of CD8(+) cytotoxic T cells was elevated in PBMC in GC patients compared to the controls, no significant difference was found in the percentage of PD-L1(+) T cells in PBMC between GC patients and the healthy control group. Notably, more than 90% of PD-L1(+) cells were CD8(+) lymphocytes. However, the relatively low number of samples (n = 14) of PBMC obtained from GC patients could be deemed insufficient to reveal important relationships for PD-L1(+) T lymphocytes [25]. Analysis of 40 blood samples clearly demonstrated that the percentage of CD4(+)/PD-L1(+) and CD8(+)/PD-L1(+) cells was higher compared to the control group. MFI values for PD-L1 molecules on CD4(+) and CD8(+) cells were also significantly higher compared to the control group, but these were negatively correlated to each other in the GC group. A negative correlation was also found between the percentage of CD4(+)/PD-L1(+) cells and the percentage of CD8(+)/PD-1(+) cells. This negative correlation could be at least in part an effect of the specific association between CD4(+) and CD8(+) cells and PD-1/PD-L1 expression in GC patients. Whereas PD-1(+) T cells in PBMC were found to be mainly (82%) CD4(+) T helper cells, CD8(+) T cells account for a relevant fraction of PD1+ tumor-infiltrating T cells. The majority (92%) of T cells in PBMC expressing PD-L1 were CD8(+) cytotoxic T cells [25]. This phenomenon emphasizes the complexity and heterogeneity of distribution of effector immune cells under the influence of the PD-1/PD-L1 axis in peripheral blood and the tumor microenvironment in GC.
A higher percentage of CD4(+)/PD-1(+) cells in diffuse-type tumors compared to intestinal-type tumors was found. A higher percentage of CD8(+)/PD-1(+) cells was also observed in patients with poorly differentiated tumors (G3) compared to G1/G2 tumors. These findings correspond with several sources of data from different research studies indicating a correlation between PD-1/PD-L1 expression and adverse prognostic factors including diffuse-type tumors, higher T stage, and lymphatic invasion [21, 26]. Also, PD-1 expression on T cells has been found to be related to worse prognosis [20]. However, there are also reports with different conclusions, showing a better prognosis for PD-L1 positive gastric tumors [27, 28]. These conflicting results still need to be clarified in future studies.
The lack of assessment of PD-L1 expression on cancer cells might be considered as a limitation of the study. However, the experimental study by Kleinovink et al. has shown that PD-L1 expression by tumor cells could not be an absolute condition to expect a positive anti-PD-1/PD-L1 treatment outcome. They confirmed treatment efficacy using a PD-L1-blocking antibody in an animal model of PD-L1-knock-out (PD-L1KO) tumors. Outgrowth of PD-L1KO tumors was even further decreased by therapeutic PD-L1 blockade, leading to complete eradication of most tumors and long-term survival of nearly 90% of animals [29]. These results clearly indicate that PD-1/PD-L1 regulation is even more important in immune cells responsible for antitumor reactions.
In conclusion, we demonstrated that in advanced gastric cancer, PD-1 and PD-L1 molecules are expressed on a higher percentage of peripheral blood CD4(+) and CD8(+) cells than in healthy controls. We also found a higher frequency of CD4(+)/PD-1 and CD8(+)/PD-1(+) cells in diffuse-type and poorly differentiated tumors, respectively, which is potentially associated with poor prognosis. The observed differences may result from interaction between gastric cancer cells and the immune system and may confirm that downregulation of CD4(+) and CD8(+) lymphocytes associated with PD-1/PD-L1 expression can also be detected in peripheral blood T cells. This can lead to attenuation of the general immune anti-tumor response in GC. Our results may contribute to a better understanding of the role of effector T cells in the immune reaction against gastric cancer. Further studies are needed to clarify the relationship between peripheral lymphocyte subsets and TILs in gastric cancer, including in response to anti-PD-1/PD-L1 treatment.


