Introduction
Cognitive disorders such as Alzheimer’s disease (AD) constitute the most common neurologic disorders. They can impede daily activities and impair the quality of life, particularly among the elderly [1]. AD is the most widespread neurodegenerative disorder, characterized by a gradual decline in memory and cognitive abilities. It is more frequently encountered in the elderly and severely affects daily activities [2, 3]. AD is found in 69% of patients with dementia aged over 75 years and is characterized by impairment in activities of daily living, cognitive deterioration, and behavioral disorders [1].
Histopathologic abnormalities such as amyloid plaque aggregation, neurofibrillary tangles, and oligodendroglial hypertrophy can be observed in the early stages of AD, years before the clinical symptoms related to dementia become apparent [4]. AD has already entered a histopathologically advanced stage at the time such symptoms appear [5]. Early diagnosis and treatment are important in slowing down disease progression. Easily accessible biomarkers are critical for the early diagnosis of AD.
Platelet distribution width, the neutrophil to lymphocyte ratio (NLR), mean platelet volume (MPV), and granulocyte to lymphocyte ratio (GLR) have been examined in the literature [6–8]. Peripheral inflammation, as measured using NLR, red cell distribution width (RDW), and MPV, is associated with poor cognitive function and brain aging [9].
The monocyte/HDL-C ratio (MHR) could reflect an inflammatory condition and has been associated with chronic inflammation related to disease progression. Increased monocyte counts and decreased high-density lipoprotein-cholesterol (HDL-C) serum levels have been associated with the progression of inflammation and oxidative stress. The monocyte/HDL-C ratio (MHR, found by dividing the absolute monocyte value by the absolute HDL-C value) is an inflammation marker demonstrated to have a strong association with cardiovascular events [10].
Sun et al. reported that monocytes might be involved in clearance of tau proteins in AD [11]. Activated monocyte-related damage in the blood-brain barrier is another reason for the development of AD [12]. Monocytes play an important role in the clearance of amyloid β in the peripheral vascular system [13]. High monocyte counts in the blood were observed in patients with AD [14].
On the other hand, HDL-C suppresses macrophage activation, low-density lipoprotein-cholesterol (LDL-C) oxidation, and macrophage migration with its antioxidant and anti-inflammatory effects [15]. There is an inverse correlation between HDL-C, tau protein, and amyloid β-42 protein [16]. HDL-C inhibits the production of endothelial adhesion molecules while suppressing the differentiation of monocytes to macrophages and their migration and activation. HDL-C also increases endothelial nitric oxidase expression and induces vasorelaxation. HDL-C has an antioxidant effect to protect endothelial function [17, 18].
In the pathophysiology of AD, inflammation plays an important role. Oxidative stress also plays a role in the early stages of AD. Reactive oxygen species increase in AD and result in membrane damage and cytoskeletal abnormalities in neural cells [19]. F2-isoprostanes, 3-nitrotyrosine, carbonylated proteins, and heme oxygenase type 1 are some markers of oxidative stress. Activated microglia secrete neurotoxin Aβ with some inflammatory molecules such as interleukin-1 (IL-1), interleukin-6 (IL-6), tumor necrosis factor-α (TNF-α), and interferon-γ (IFN-γ) damage the neurons [20].
MHR is known as an inflammatory and oxidative stress biomarker that is cost-effective and easily measurable [21]. It may be effective for the early diagnosis of AD.
When we examined the literature, we found no studies evaluating MHR and AD. We planned to investigate whether there was a relationship between AD and MHR. The objective of this study was to examine the differences in MHR between patients with AD and controls and investigate its suitability as a straightforward and easily calculable biomarker for determining the progression of the disease.
Material and methods
Subjects
A retrospective study was conducted with 184 subjects aged over 65 years who presented for various reasons to the Neurology Outpatient Department of Giresun University Faculty of Medicine. The hospital’s electronic patient record data between September 2021 and April 2022 were screened. Patients with AD according to the National Institute of Neurological and Communicative Disorders and Stroke/Alzheimer’s Disease and Related Disorders Association (NINCDS-ADRDA) criteria made up the patient group, and age- and sex-matched patients with nonspecific symptoms such as dizziness and myalgia, who had normal cognitive functions, and had not been diagnosed as having dementia, made up the control group [22]. The age range of the AD group and control group was 68–93 years and 69–92 years, respectively. The patient group was divided into three groups according to the Clinical Dementia Grading (CDR) scale: mild, moderate, and severe. The global cognitive function of all subjects was evaluated using the Mini-Mental State Examination (MMSE) [23]. A total score less than or equal to 24 was accepted as cognitive impairment. The control group subjects were older than 65 years and fully independent as regards activities of daily living.
Laboratory analysis
Baseline information including age, sex, and comorbidities was collected. The blood glucose, total cholesterol, triglyceride, HDL-C, LDL-C, and uric acid levels were evaluated using a COBAS 8000 series (Switzerland) analyzer following 8 h of overnight fasting. White blood cell measurements were performed using an automated hematology analyzer (MINDRAY BC 6800, China). The blood monocyte count was divided by the blood HDL-C level to calculate the monocyte count to HDL-C ratio.
The following exclusion criteria were used: (1) the presence of hematologic or oncologic diseases or chronic renal or liver failure; (2) being on antihyperlipidemic medication; (3) AD-mimicking disorders; (4) non-Alzheimer’s dementia; (5) rheumatologic disorders; (6) inflammatory bowel disorders; (7) hypothyroidism or hyperthyroidism; (8) any kind of infection in the last month according to the hospital records; (9) any minor or major surgical procedure or intervention during the past month.
The Ordu University Ethics Committee for Clinical Research approved the study.
Statistical analysis
The IBM SPSS v23 software was used to analyze the study data. Normal distribution was determined using the Kolmogorov-Smirnov and Shapiro-Wilk tests. Pearson’s χ2 test was used for evaluating categorical variables. Group pairwise comparisons were performed using the t-test and the Mann-Whitney U-test for normally and non-normally distributed data, respectively. Comparisons among three or more groups were conducted using one-way variance analyses and the Duncan test for normally distributed data and the Kruskal-Wallis H test and Dunn’s test for non-normally distributed data. Risk factors that could affect AD were analyzed using a binary logistic regression model. Pearson’s correlation coefficient and Spearman’s rho correlation coefficient were used to analyze the relationship between normally and non-normally distributed quantitative data, respectively. Adjustment for confounding factors was performed using multivariate logistic regression models. The model was adjusted for age, sex, the monocyte/HDL ratio, glucose, uric acid, triglyceride, hemoglobin levels, and comorbidities. Statistical significance was set at p < 0.05.
Results
A total of 81 controls and 103 individuals diagnosed as having AD were included in the study. The sex distribution between the AD and control groups was similar (p = 0.478). The groups showed no differences regarding sex and age (p = 0.478 and p = 0.688, respectively). Diabetes mellitus (DM) was more commonly observed in the control group. Arterial hypertension was more common in the AD group and also the most commonly observed comorbidity in this group, but it was not statistically significant (p = 0.64) (Table I). There was also a lack of statistically significant differences between the groups based on comorbidities (Table I). The MHR value was found to be significantly higher in the AD group compared with the control group. Serum uric acid, total cholesterol, triglyceride, HDL-C, and LDL-C values were similar between the groups (Table II). The MMSE score was significantly lower in the Alzheimer’s group when compared with the control group (Table II).
Table I
Gender and comorbidity distribution by group
| Parameter | Alzheimer’s disease, n (%) | Control, n (%) | P-value* |
|---|---|---|---|
| Gender | 0.478 | ||
| Male | 33 (32) | 30 (37) | |
| Female | 70 (68) | 51 (63) | |
| Comorbidity | 0.64 | ||
| Absent | 15 (14.6) | 17 (21) | |
| DM | 5 (4.9) | 7 (8.6) | |
| HT | 54 (52.4) | 41 (50.6) | |
| Stroke | 1 (1) | 1 (1.2) | |
| DM + HT | 22 (21.4) | 13 (16) | |
| HT + Stroke | 5 (4.9) | 2 (2.5) | |
| DM + HT + Stroke | 1 (1) | 0 (0) | |
Table II
Demographic and laboratory parameters
[i] MMSE – Mini-Mental Test State Examination, HDL-C – high-density lipoprotein cholesterol, LDL-C – low-density lipoprotein cholesterol, MCV – mean corpuscular volume, HGB – hemoglobin, RBC – red blood cells, MCHC – mean corpuscular hemoglobin concentration, MHR – monocyte HDL-C ratio, SD – standard deviation. Mean ± standard deviation has been used for normally distributed data, and median (min.–max.) for non-normally distributed data.
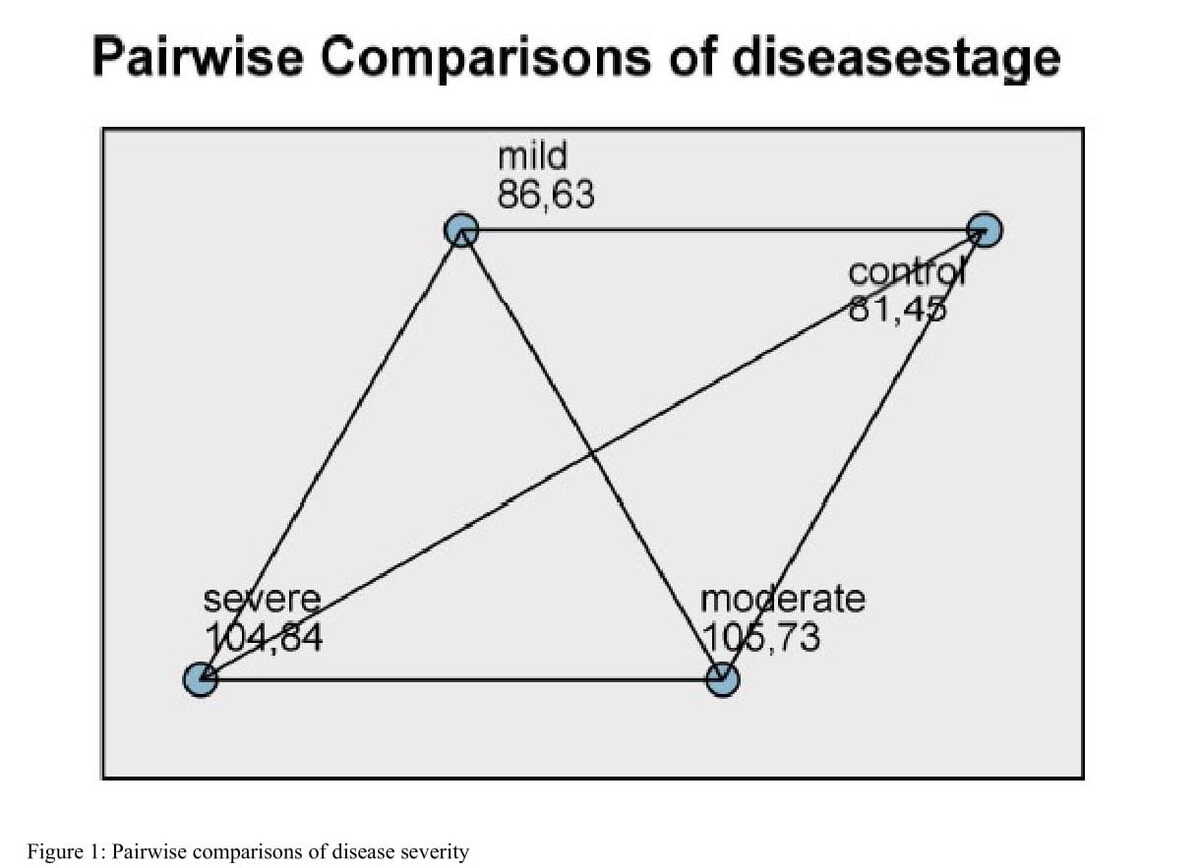
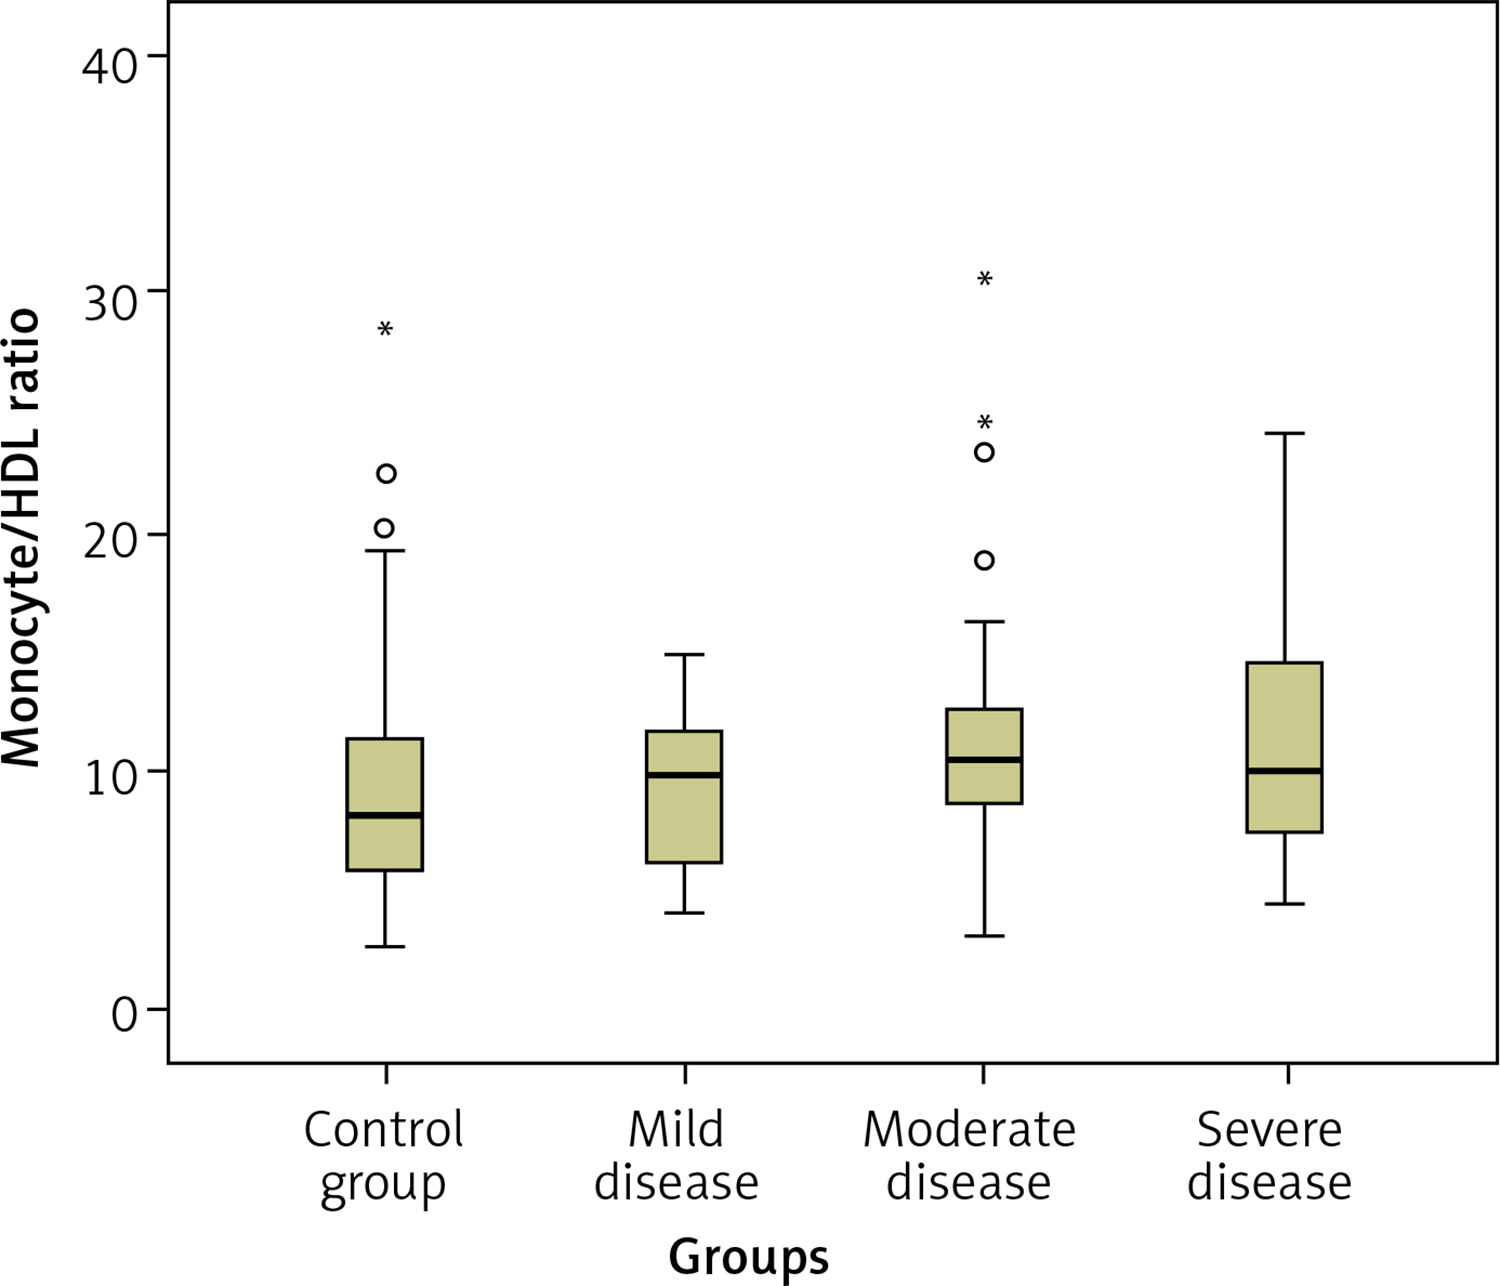
The patients with AD were classified into three subgroups based on the progression of the disease: mild (n = 23), moderate (n = 48), and severe (n = 32). A statistically significant difference was observed among these subgroups in terms of MMSE scores, which were significantly lower in the severe dementia subgroup (p = 0.001). Subgroup analysis was performed using the Kruskal-Wallis test. The MHR values of the moderate and severe AD subgroups were significantly higher than the control group (p = 0.012 and p = 0.035, respectively). Box plot graphs for each group are presented in Figure 1. The blood monocyte count was higher in the moderate severity dementia subgroup compared with the control group (p = 0.003).
A weak but statistically significant negative correlation was found between the MHR and MMSE scores (r = –0.191; p = 0.009). The MHR values were also negatively correlated with the mean corpuscular hemoglobin concentration (MCHC), with moderate power (r = –0.324; p < 0.001). A weak positive correlation was found between the MMSE score and the red blood cell (RBC) count (r = 0.175; p = 0.018) (Table III).
Table III
Regression analysis of the quantitative data
| Variable | Age | MMSE | Monocytes | HDL-C | MHR | LDL-C | Total cholesterol | Triglyceride | Glucose | MCV | MCHC | HGB | |
|---|---|---|---|---|---|---|---|---|---|---|---|---|---|
| MMSE score | r | –0.138** | |||||||||||
| p | 0.061 | ||||||||||||
| Monocytes | r | 0.077** | –0.214** | ||||||||||
| p | 0.296 | 0.004 | |||||||||||
| HDL-C | r | –0.080** | 0.070** | –0.190** | |||||||||
| p | 0.279 | 0.343 | 0.010 | ||||||||||
| MHR | r | 0.124** | –0.191** | 0.804** | –0.696** | ||||||||
| p | 0.095 | 0.009 | < 0.001 | < 0.001 | |||||||||
| LDL-C | r | –0.098* | 0.050** | –0.061** | 0.105** | –0.109** | |||||||
| p | 0.185 | 0.499 | 0.413 | 0.157 | 0.142 | ||||||||
| Total cholesterol | r | –0.148* | 0.080** | –0.117** | 0.250** | –0.231** | 0.886* | ||||||
| p | 0.044 | 0.279 | 0.113 | 0.001 | 0.002 | < 0.001 | |||||||
| Triglyceride | r | –0.070** | 0.078** | 0.038** | –0.381** | 0.259** | 0.120** | 0.259** | |||||
| p | 0.348 | 0.293 | 0.606 | < 0.001 | < 0.001 | 0.106 | < 0.001 | ||||||
| Glucose | r | –0.121** | –0.073** | 0.032** | –0.049** | 0.057** | –0.056** | –0.040** | 0.152** | ||||
| p | 0.102 | 0.326 | 0.670 | 0.513 | 0.442 | 0.448 | 0.590 | 0.039 | |||||
| MCV | r | 0.037* | –0.116** | –0.190** | 0.001** | –0.111** | –0.088* | –0.126* | –0.114** | 0.011** | |||
| p | 0.614 | 0.117 | 0.010 | 0.986 | 0.134 | 0.237 | 0.089 | 0.122 | 0.884 | ||||
| MCHC | r | –0.169** | 0.099** | –0.353** | 0.149** | –0.324** | 0.065** | 0.110** | –0.118** | 0.029** | 0.208** | ||
| p | 0.022 | 0.182 | < 0.001 | 0.044 | < 0.001 | 0.383 | 0.137 | 0.112 | 0.699 | 0.005 | |||
| HGB | r | –0.219** | 0.135** | –0.131** | 0.048** | –0.137** | 0.145** | 0.161** | 0.022** | –0.007** | 0.210** | 0.422** | |
| p | 0.003 | 0.067 | 0.077 | 0.518 | 0.064 | 0.050 | 0.029 | 0.762 | 0.922 | 0.004 | < 0.001 | ||
| RBC | r | –0.207* | 0.175** | 0.099** | –0.028** | 0.053** | 0.242* | 0.242* | 0.100** | –0.062** | –0.400* | 0.033** | 0.719** |
| p | 0.005 | 0.018 | 0.184 | 0.709 | 0.480 | 0.001 | 0.001 | 0.181 | 0.405 | < 0.001 | 0.658 | < 0.001 | |
** Spearman’s rho correlation coefficient. MMSE – Mini-Mental Test State Examination, HDL-C – high-density lipoprotein cholesterol, LDL-C – low-density lipoprotein cholesterol, MCV – mean corpuscular volume, HGB – hemoglobin, RBC – red blood cells, MCHC – mean corpuscular hemoglobin concentration, MHR – monocyte HDL-C ratio.
A logistic regression model was established to examine the impact of risk factors on AD. In the univariate model, MHR did not affect AD development (OR = 1.066, 95% CI: [0.998–1.138]; p = 0.056). The multivariate logistic regression analysis model revealed that a one-unit increase in MHR resulted in a 1.081-fold increase in the risk of AD. Also, a one-unit increase in the serum glucose level gave rise to a 1.008-fold increase in AD risk. The risk factors analyzed in the regression model are presented in Table IV.
Table IV
Logistic regression analysis of the risk factors
Discussion
An increase in MHR was found in patients with AD in the current study, and this increase was correlated with the MCHC and MMSE values. This is the first study in the literature to report an increased MHR value in AD.
We found no difference in MPV between the AD and control groups. Thrombocyte size is related to thrombocytosis in acute coronary syndrome or other vascular disorders. However, inflammation plays an important role in the basic pathology of AD.
MHR has also been investigated in patients with Parkinson’s disease (PD). Although no difference was observed between patients with PD and a control group, MHR was higher in patients with PD with long-term follow-up [24]. Inflammation plays a role in the pathogenesis of α-synucleinopathy in PD. In the pathology of multiple system atrophy (MSA), there is systematic inflammation. It was observed that MHR was predominantly higher in MSA than in PD, which shows that MHR is a good marker for inflammatory conditions [25]. MHR stands out as a marker reflecting inflammatory and oxidative stress in PD, similar to the neurodegenerative disorder AD, but is not a marker of early disease diagnosis because it is higher in patients who are followed for a longer time. Although MHR was higher in the patients with AD compared with the control group in the current study, this was due to the larger number of patients with moderate and severe-stage disease than those with early-stage disease in the subgroup analysis.
Atherosclerosis or vascular problems may be encountered more commonly in patients with severe-stage AD. Hypertension may be a risk factor for cognitive impairment and AD in patients aged between 40 and 70 years who have a genetic predisposition to AD, especially those possessing APOE ε4 [26]. DM is also a risk factor for AD [27]. Hyperinsulinemia and brain insulin resistance in patients with DM stimulate amyloid β initiation in the brain. Also, hyperglycemia generates advanced glycation end products (AGEs) in DM. Increased AGEs trigger the production of receptors for AGEs (RAGEs). RAGEs lead to oxidative stress, vascular injury, and inflammation [28].
The high MHR values in the late stages of AD demonstrate a potential for MHR to predict prognosis, as in coronary artery disease [29, 30]. Changes in MHR may indicate an unfavorable prognosis related to vascular changes in AD. This cannot be mentioned as the main outcome of this study because of the absence of cardiovascular outcomes.
Various peripheral blood parameters have been studied in inflammatory disorders and also in AD [31]. MPV was significantly increased in AD, and its value correlated with the severity of cognitive impairment [32]. A decreased hemoglobin level may be another blood parameter related to AD. It likely impacts cognitive function by decreasing cerebral blood perfusion, leading to neuroinflammation and oxidative stress [33]. Despite this, we found no significant difference in hemoglobin levels between the groups. The reason for the difference in hemoglobin levels compared with the literature may be the role of the multifactorial pathophysiology in AD.
In some studies on MCV in AD, it was found that MCV was elevated in AD compared with healthy controls [34, 35]. However, in a meta-analysis by Huang et al. (2022), no significant difference in MCV was found between patients with AD and healthy controls [36]. We did not found significant differences in terms of MCV between the groups, similar to Huang et al.’s results.
The limitations of this study include its retrospective design and the absence of data on factors such as smoking, alcohol consumption, cardiovascular data, body mass index, arterial blood pressure, and levels of inflammatory markers (e.g., IL-6, CRP, and TNF-α) of the patients. Neuropsychological tests (Letter Digit Substitution Task, Word Fluency Test, Stroop test, 15-word Verbal Learning Test, and Purdue Pegboard Test) were not performed on the study population.
In conclusion, MHR negatively correlates with MMSE scores. MHR can be used as an index reflecting the increased AD risk but it cannot be used as a diagnostic test for AD. More extensive prospective studies assessing cardiovascular risk factors and inflammatory markers in AD with a larger scope are needed to demonstrate any such relationship more robustly.