Atrophic gastritis (AG) and intestinal metaplasia (IM) are considered precursor lesions of intestinal-type gastric cancer (GC). AG in children is rare, with frequencies of up to 16% [1]. In Mexico, to the best of our knowledge, no frequency data have been reported on AG or IM. The frequency of AG is related to the prevalence of Helicobacter pylori (H. pylori) infection. In Mexico, the reported prevalence of H. pylori in children is up to 72.7% [2], and in adults it is up to 86.1% [3].
Gastroendoscopy with histopathological examination is the gold standard for GC diagnosis; however, it is an invasive and costly method that requires professional expertise. On the other hand, the levels of pepsinogen I (Pg I), pepsinogen II (PgII), gastrin-17 (G-17), and anti-H. pylori antibodies (GastroPanel) represent a group of biomarkers that could be useful in the identification of premalignant lesions.
The aim of this study was to determine the usefulness of the biomarkers PgI, PgII, G-17, PgI/PgII ratio, and H. pylori antibodies in the identification of GC precursor lesions.
Methods
We studied 129 patients with dyspepsia who were recruited by the Gastroenterology Departments of the Specialty and Paediatric Hospitals of Centro Medico Nacional de Occidente, Instituto Mexicano del Seguro Social in the city of Guadalajara, Jalisco. A peripheral blood sample was obtained from each patient before endoscopy. Gastric biopsies were obtained from endoscopy in 105 of 129 patients, which were analysed by a pathologist; in the remaining patients, endoscopy was not performed. PgI, PgII, and G-17 levels and H. pylori infection, represented by IgG antibodies, were determined in serum by ELISA using the GastroPanel test system (GastroPanel®, BIOHIT HealthCare, Helsinki, Finland).
Statistical analysis
Statistical analysis was performed using IBM SPSS v24.0 software. Comparative analysis between groups was performed by non-parametrical Mann-Whitney U test or Kruskal-Wallis test when needed. Odds ratios were determined by logistic regression, and receiver operating characteristic (ROC) curves were used to evaluate diagnostic performance. A p-value below 0.05 was considered significant. The sensitivity, specificity, positive predictive value (PPV), negative predictive value (NPV), positive and negative likelihood ratios (PLR, NLR), diagnostic odds ratio (DOR), accuracy index (AI), and Youden’s index (YI) were obtained using histology, the gold standard for GC, as a reference. All subjects provided written informed assent and consent. This study complies with current regulations on bioethical research and was approved by the Institutional Review Board.
Results
The histopathological results of 105 individuals were as follows: 5.7% of patients were normal without gastric alterations, 52.3% had nonatrophic gastritis, 4.8% had chemical gastropathy, 15.2% had AG, 10.5% had both AG and IM, 10.5% had IM, and 1.0% had poorly differentiated GC/diffuse with signet ring cells. In 37 of the 105 (35.2%) subjects, H. pylori infection was confirmed by histology.
According to the pathologist’s criteria, diagnoses were established by histology (Figure 1), and 3 groups were formed for the data analysis: Group 1, patients with AG, IM, and GC (n = 39); Group 2, patients with nonatrophic gastritis (NAG) or chemical gastropathy or without gastric alterations (n = 66); and Group 3, patients with gastric symptoms without endoscopy or histology (n = 24). Comparisons among these groups are shown in Table I.
Table I
Demographic data, personal habits, and biomarker results of the studied subjects
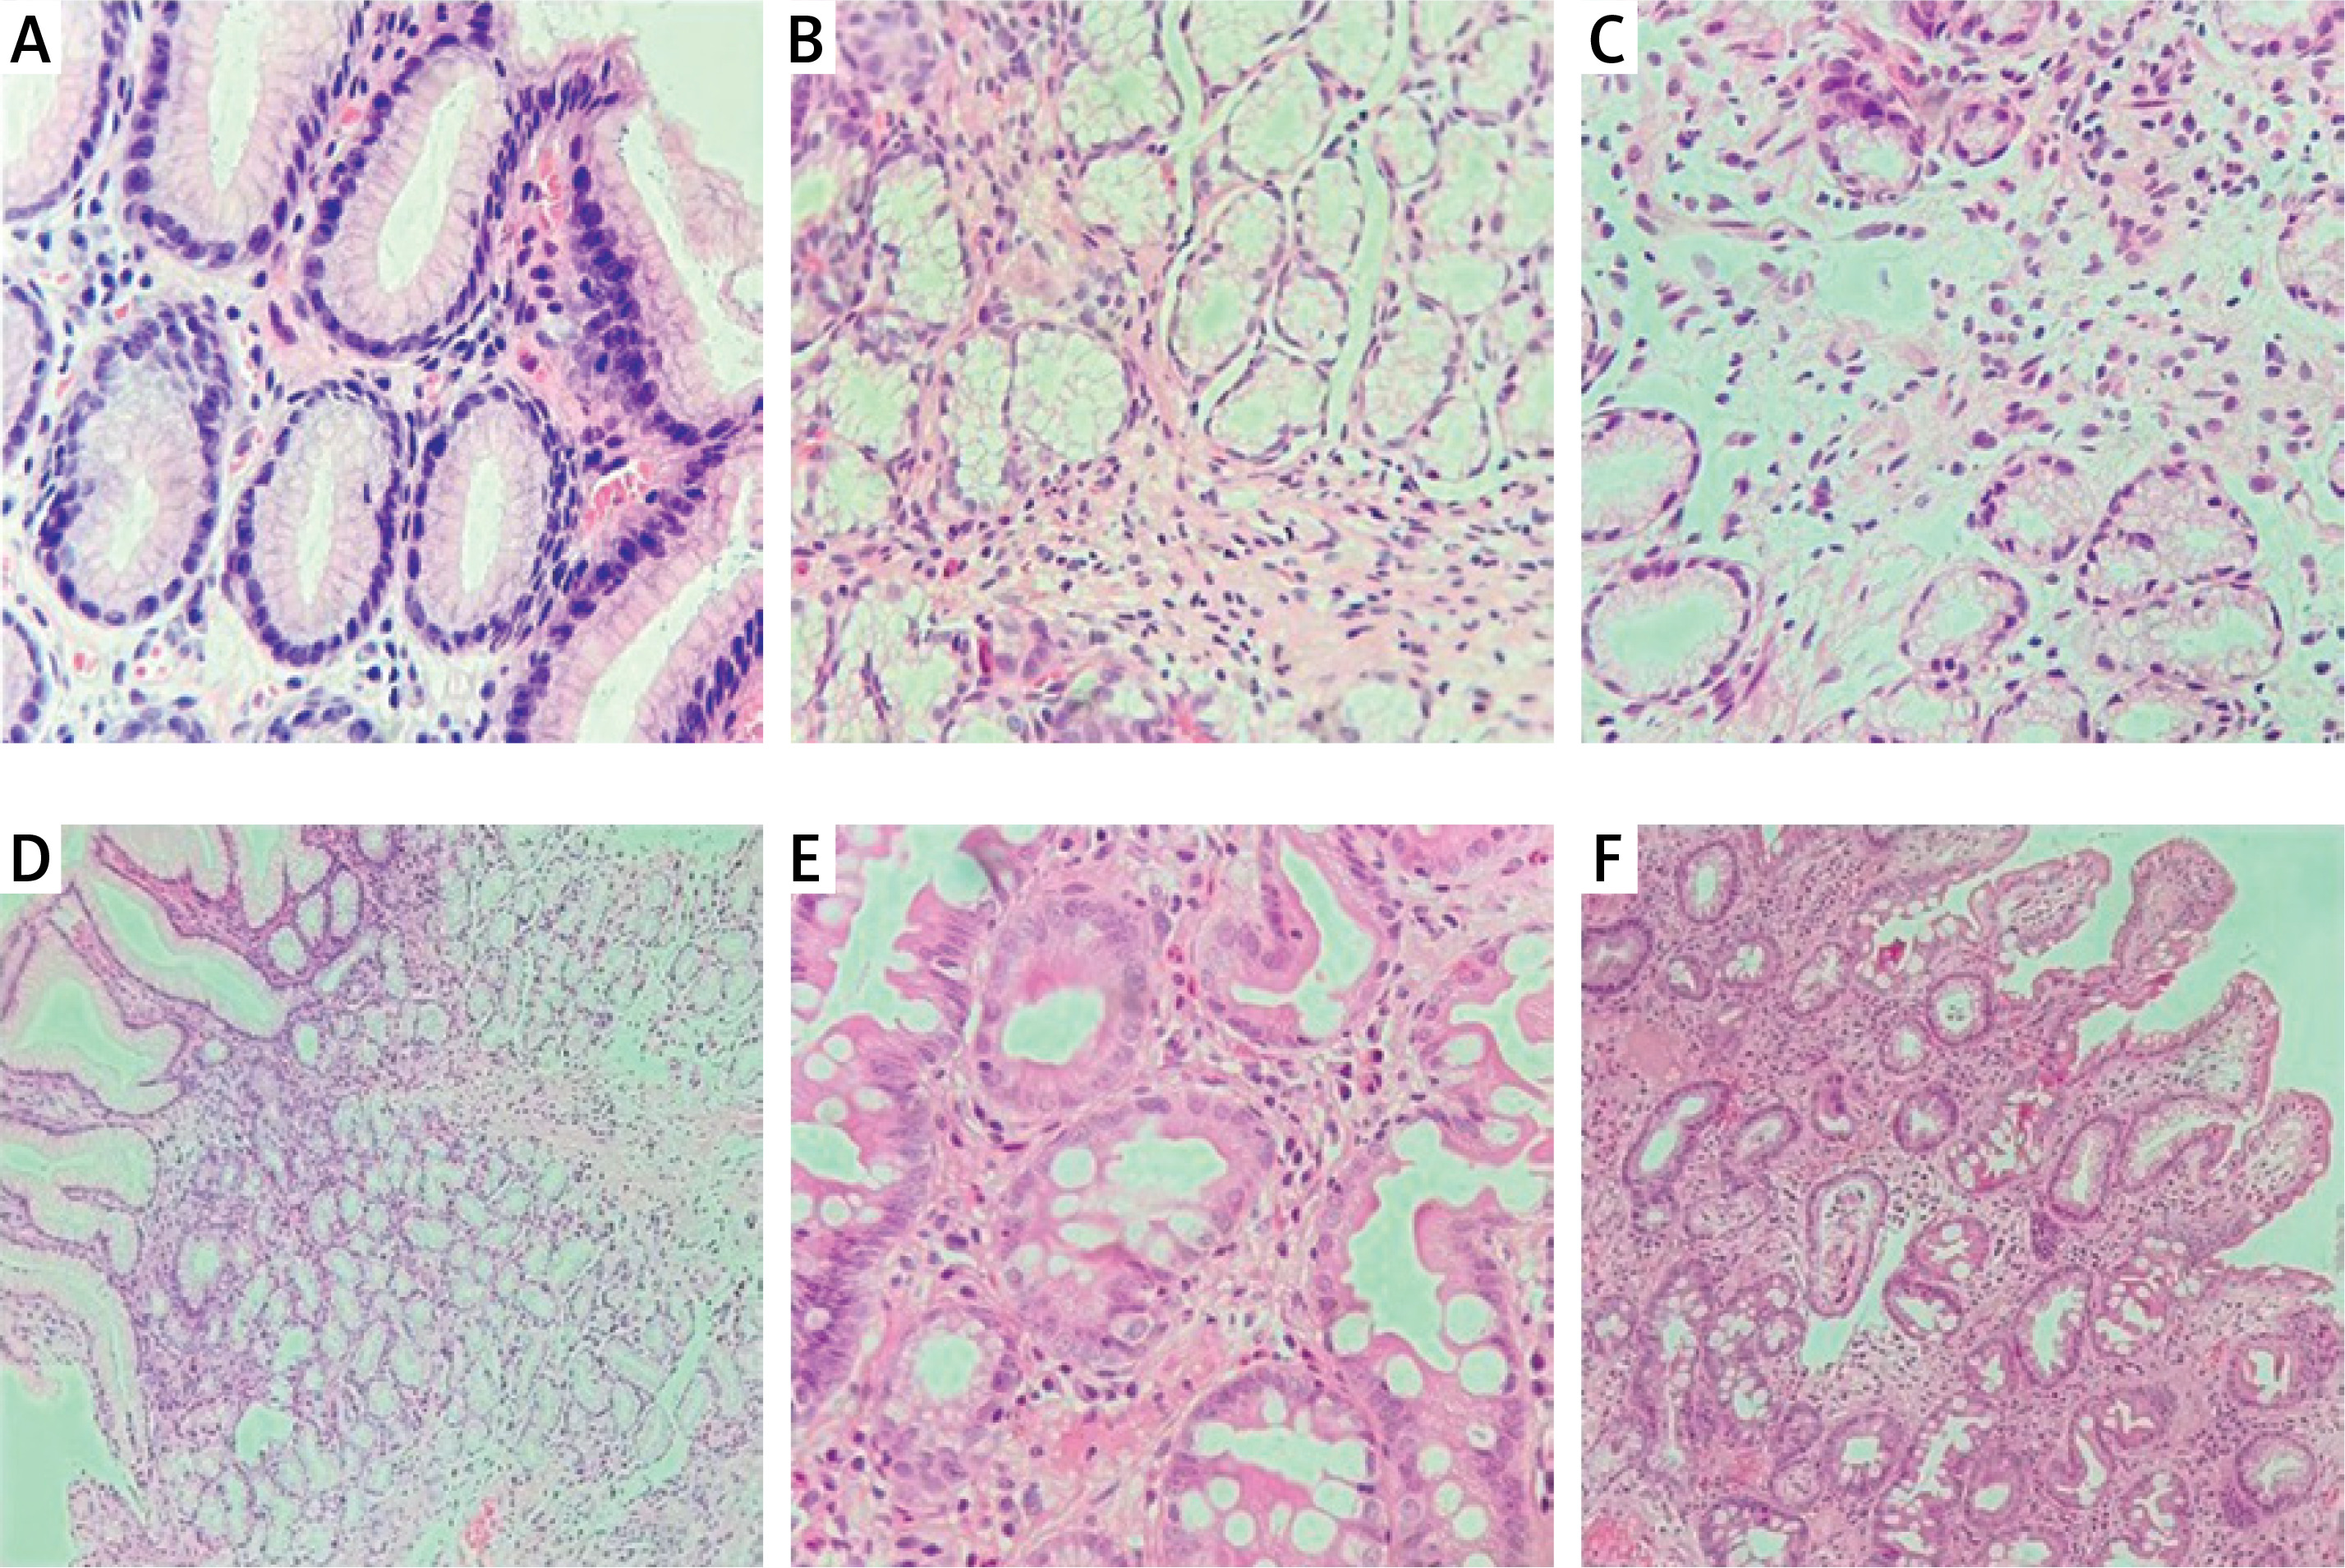
Figure 1
Histological images of gastric alterations observed in the studied patients. A – Non-atrophic gastritis associated with Helicobacter pylori, B–D – atrophic gastritis, E, F – intestinal metaplasia
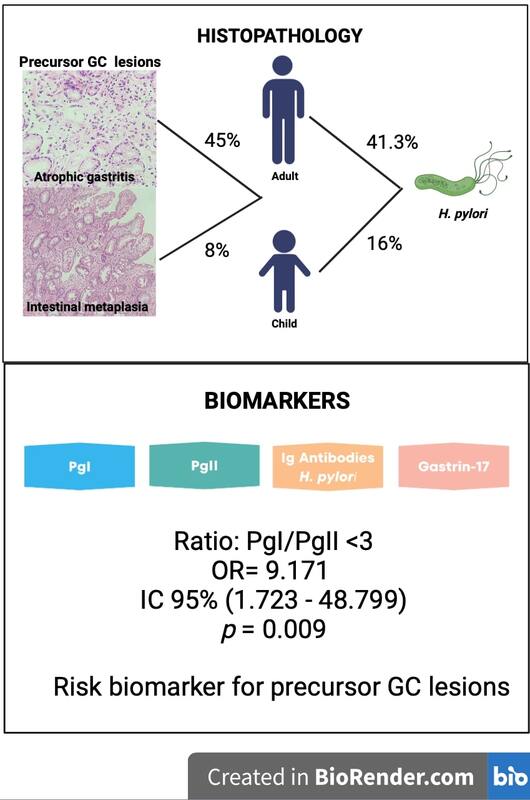
In adults, the most frequently observed alteration was preneoplastic lesions (AG and/or IM) (45.0%); H. pylori infection was detected in 41.3% of cases. In children, the frequency of AG was 8.0%, and H. pylori infection was present in 16.0% of cases.
We observed significant differences among the 3 groups (p < 0.05) in age and H. pylori infection as determined by histology. Because Group 3 did not undergo endoscopy or histopathological study, only the p-values of comparisons between Groups 1 and 2 are shown (Table I).
Biomarkers
Pepsinogen I, pepsinogen II, gastrin-17, and anti-H. pylori antibodies: In the overall sample, 18/129 subjects were positively identified as having AG by GastroPanel (14.0%). Thirteen of the 18 subjects (72.2%) were adults and 27.8% were children. IgG antibodies for H. pylori infection were positive in 49.6% of the subjects.
The histopathological study confirmed AG and/or IM in 55.6% (10/18); nonatrophic chronic gastritis was observed in 5 subjects, the histology was normal in 2 subjects, and one subject had no histopathological study.
According to the biomarker results, we performed an analysis considering 2 groups, atrophy (n = 18) and normal (n = 111), and we found significant differences in PgI levels (p < 0.001), which were lower in the atrophy group (mean: 25.6 ±24.1 µg/l, median 19.1 µg/l, interquartile range: 7.6–30.7 µg/l) than in the normal group (mean: 121.6 ±75.5 µg/l, median: 100.5 µg/l, interquartile range: 65.4–162.4 µg/l). Additionally, G-17 levels were significantly higher (p = 0.026) in the atrophy group (31.9 ±35.4 pmol/l) than in the normal group (11.1 ±14.1 pmol/l). The PgI/PgII ratio was lower (p < 0.001) in the atrophy group (6.1 ±9.2) than in the normal group (11.8 ±5.9) and was determined to be an important risk factor for precursor lesions such as AG or IM in our population, with an OR adjusted for sex and age of 9.171, 95% CI: 1.723–48.799, p = 0.009 (Table I).
Biomarkers, as a group, exhibited a sensitivity of 26% and specificity of 89% for the detection of precursor lesions of GC in this study by comparing them with histopathological results. Separately, the biomarkers PgI and PgI/PgII ratio were highly specific (92.4% and 96.9%, respectively) but poorly sensitive (20.5% and 23.1%, respectively). The accuracy index for all biomarkers was 65.7% (Table II).
Table II
Diagnostic test evaluation data
[i] TP – true positive, FN – false negative, FP – false positive, TN – true negative, PPV – positive predictive value (TP/TP + FP), NPV – negative predictive value (TN/TN + FN), PLR – positive likelihood ratio (sensitivity/1-specificity), NLR – negative likelihood ratio (1-sensitivity/specificity), DOR – diagnostic odds ratio (PLR/NLR or (TP/FN)/(FP/TN)), AI – accuracy index ((TP + TN)/(TN + FP + FN + TN)), AUC – area under the curve.
ROC curves were determined for all biomarkers, as a group and individually. The biomarker PgI/PgII ratio had an area under the curve (AUC) of 0.689 with a 95% CI of 0.577–0.802 (p = 0.001); none of the other biomarkers had significant AUC (Table II).
Discussion
In our study, precursor lesions of GC, such as AG and IM, were observed by histology in 45.0% of adults; the frequencies in Western populations vary between 0% and 8%, whereas in areas of high incidence of H. pylori, the frequency varies between 33% and 84% [4]. Consistent with this, we observed H. pylori infection in 41.3% of the adults in our population.
Frequencies for AG in children have not been reported for the Mexican population; in our study, the frequency was 8.0%, which is within the range of the worldwide reported frequencies of 0.38–16.0% [1, 5], and the frequency of H. pylori infection in children was lower (16%) than other reported frequencies: 24.8% [6] and 26.7% [7].
We discuss significant differences observed between the AG, IM, and GC groups and the NAG group in age, PgI/PgII ratio, and H. pylori IgG antibodies (the third group was not evaluated by endoscopy or histological study; therefore, this group could not be assigned as cases or controls).
The mean age for Group 1 (AG, IM, and GC) was higher than that for Group 2 (NAG), at 59.7 years vs. 40.0 years, respectively (p < 0.001); we found that age > 50 years was a risk factor for AG, IM, and GC (OR = 3.916, 95% CI: 1.666–9.204, p = 0.001), and the risk increased in subjects over 60 years old (OR = 4.143, 95% CI: 1.783–9.631, p = 0.001). Other studies have also reported age as a risk factor associated with the presence of IM, and patients over 50 years of age exhibited a four-fold higher risk of presenting IM (OR = 4.67) than patients under 50 years of age [8].
Low PgI and PgI/PgII ratio are indicators of atrophic changes in the gastric mucosa, and most studies have used PgI < 70 ng/ml and PgI/PgII ratio < 3 as the best cutoff values for GC screening in Asian populations [9]. In our study, only a PgI/PgII ratio < 3 showed significant differences between Groups 1 and 2 (8.5 vs. 12.2, p = 0.003); therefore, it was an important risk factor for AG, IM, and GC in our population (OR adjusted for sex and age was 9.171, 95% CI: 1.723–48.799, p = 0.009).
In the overall sample, 64 of 129 subjects (49.6%) were positive for H. pylori IgG antibodies, and according to histology, 37/105 (35.2%) subjects had H. pylori infection. Differences between H. pylori infection detected by histology were observed in Groups 1 and 2 (51.3% of subjects from Group 1 vs. 25.8% of Group 2 p = 0.016). The biomarker of H. pylori determined by histology was a risk factor for AG, IM, and GC in our population (OR = 3.034, 95% CI: 1.315–6.999, p = 0.018), and H. pylori determined by IgG antibodies had an OR of 1.951 (95% CI: 0.874–4.356, p = 0.103). Discrepancies between the histological and serological results for H. pylori detection could be attributed to a variety of factors, including the expertise of the pathologist, natural loss of infection due to advanced atrophy, or false-positive serology in the case of a previous infection, because antibodies may be present in blood following recovery from the infection.
Previously, the prevalence of H. pylori in the Mexican population was reported to range from 24.5% to 72.7% in children [2] and from 67.8% to 86.1% in adults [3]. Our frequencies are lower than those previously reported, probably because of the efforts made in the eradication of H. pylori infection, the frequencies are now diminished.
Regarding biomarkers, when considering only 2 groups (atrophy and normal), we observed significant differences in PgI and G-17 levels and the PgI/PgII ratio.
The evaluation of the GastroPanel biomarkers as diagnostic tests showed high specificity (89.4%) as well as single biomarkers PgI and PgI/PgII ratio (92.4% and 96.9%, respectively), which make these biomarkers useful for designating negative cases for precursor lesions of GC but not as sensitive for identifying positive cases.
The accuracy index of the GastroPanel biomarkers was 65.7% in patients in the AG, IM, and GC groups, whereas diagnosis with the gold standard was made in 89.4% of patients in the NAG group. Other studies have also shown that the biomarkers of GastroPanel have low sensitivity for AG detection [10–12]. Additionally, 1 patient was diagnosed by histology with diffuse-type GC. In this patient, the PgII value was slightly low, and H. pylori antibodies were high, suggesting H. pylori infection alone (premalignant lesions such as AG were discarded), and the GastroPanel could not identify GC. Other studies have shown that the GastroPanel is not useful for GC diagnosis because of its limited application as a screening tool for GC [13].
In conclusion, in the Western Mexican population, precursor lesions (AG, IM) are common in adults (45%) with dyspepsia but infrequent in children (8%). H. pylori infection was detected in 41.3% of adults and 16.0% of children. Of the studied biomarkers, a PgI/PgII ratio < 3 was an important risk factor for precursor lesions such as AG or IM in our population, with an OR of 9.171 (95% CI: 1.723–48.799, p = 0.009).