Introduction
Breast cancer, a frequent malignancy in females, presents as abnormal lumps within the breast or changes in the skin and nipple of the breast and can be diagnosed at different stages according to the observed location of breast cancer cells [1, 2]. Breast cancer causes morbidity and mortality among patients and poses a heavy and rising burden on humans and society worldwide [3]. Although recent progress in diagnosis and therapeutic strategies has improved the outcome of breast cancer, chemoresistance remains a primary cause of failure in treating this tumor [4]. In addition, immune escape is vital for breast cancer development and is associated with the chemoresistance of tumor cells [5, 6], which necessitates the exploration of molecular mechanisms underlying chemoresistance and immune escape in breast cancer.
Poly-ADP-ribose polymerase 9 (PARP9) is a member of the PARP family that catalyzes the posttranslational modification of proteins [7]. PARP9 is responsible for the development of various cancers, such as breast cancer, and contributes to the chemoresistance of lymphoma and prostate cancer cells [8–12]. Notably, PARP enzymes participate in the immune escape of tumors [13]. More importantly, PARP9 can recruit and activate the phosphoinositide 3-kinase (PI3K) and serine/threonine protein kinase (AKT) pathway [14]. PI3K and AKT are both enzymes crucial for diverse cell processes, including cell growth and metabolism [15]. The PI3K/AKT pathway has been reported to facilitate tumor cell survival [16]. Interestingly, prior studies demonstrated that the activated PI3K/AKT/mTOR pathway was implicated in drug resistance in breast cancer [17] and that PI3K/AKT pathway activation was associated with immune escape in gallbladder cancer [18].
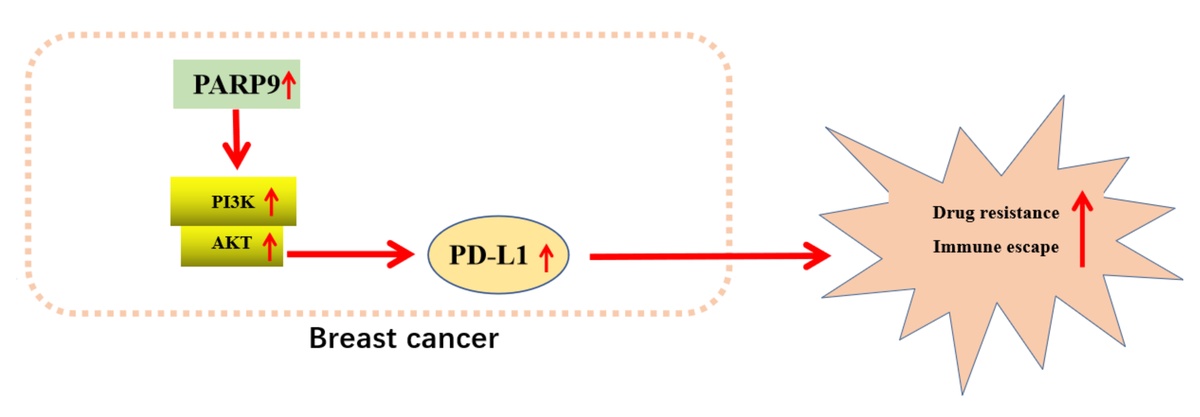
Furthermore, the PI3K/AKT pathway plays a role in oncogenesis by upregulating programmed death ligand 1 (PD-L1) expression [19]. PD-L1 is a transmembrane protein expressed in a great number of cells, including tumor cells [20]. PD-L1 is an important factor related to chemoresistance in cancers [21]. Of note, earlier research elucidated that the suppression of the PI3K/AKT pathway diminished PD-L1 expression to protect against the immune escape of non-small cell lung cancer cells [22]. Accordingly, we proposed a hypothesis that PARP9 might modulate chemoresistance and immune escape of breast cancer cells via the PI3K/AKT/PD-L1 axis and designed corresponding experiments for the verification of this hypothesis.
Material and methods
Cell culture and treatment
Parent MCF-7 cells (ax4010) and fulvestrant (FUL)-resistant MCF-7 cells (MCF-7/FUL, ax4013) were obtained from AXOL Bioscience (Easter Bush, UK), and human mammary epithelial MCF-10A cells (iCell-h131) from iCell Bioscience (Shanghai, China). These cells were verified by the companies.
MCF-10A and parental MCF-7 cells were respectively cultured in Dulbecco’s Modified Eagle Medium (DMEM) with 100 µg/ml streptomycin (Gibco, Grand Island, NY, USA), 10% fetal bovine serum (FBS, Thermo Fisher Scientific, Waltham, Massachusetts, USA), and 100 U/ml penicillin under conditions of 37°C and 5% CO2. Meanwhile, MCF-7/FUL cells were cultured in phenol red-free DMEM/F12 (Thermo Fisher Scientific) with 100 nM FUL (Sigma-Aldrich, St. Louis, MO, USA), 1% FBS (Thermo Fisher Scientific), 100 µg/ml streptomycin, 2.5 mM GlutaMAX (Gibco), 100 U/ml penicillin, and 6 ng/ml insulin (Gibco) under conditions of 37°C and 5% CO2.
Cell transfection
Cells were transfected with short hairpin RNA (sh)-PARP9 (PARP9 knockdown vectors, sequence: AAAAGCCAGCTCCTTCTTTCAATACTTCGGTATTGAAAGAAGGAGCTGGC) and sh-negative control (NC) (NC vectors) (Hanbio, Shanghai, China) as directed in the instructions of Lipofectamine 2000 reagents (Invitrogen, Carlsbad, CA, USA). Subsequent experiments were conducted 48 h later [11].
Resistance index detection in MCF-7/FUL cells
To assess FUL resistance, cells (1 × 10⁴ cells/well) were seeded in 96-well plates and placed in an incubator (37°C, 5% CO2, and 95% air) for overnight incubation. Subsequently, FUL (0, 0.25, 0.5, 1, 2, 4, 8, 16, 32, and 64 µg/ml) was cultured with cells for 24 h, followed by the addition of Cell Counting Kit (CCK)-8 reagents (10 µl per well). After cells were cultured for 2 h in a 37°C incubator, optical density (OD) values at 450 nm were measured in a microplate reader (model 680, Bio-Rad, Hercules, CA, USA) [23]. The 50% inhibition concentration (IC50) was calculated to quantify or measure the resistance of cells to FUL.
Quantitative reverse transcription-polymerase chain reaction
The total RNA of cells was isolated with TRIZOL reagents, followed by reverse transcription as per the manual of the reverse transcription kit (TaKaRa, Tokyo, Japan). Afterward, the samples were subjected to quantitative reverse transcription-polymerase chain reaction (qRT-PCR) with SYBR GreenMix (TaKaRa) in a Biosystems 7300 real-time PCR system (Applied Biosystems, Foster City, CA, USA). Each reaction was set with three duplicates. The data were analyzed with the 2–ΔΔCt method [24]: ΔΔCt = the experimental group (Ct the target gene – Ct the internal reference) – the control group (Ct the target gene – Ct the internal reference), with glyceraldehyde-3-phosphate dehydrogenase (GAPDH) as the normalizer. The related primers are listed in Table I.
Western blot
Cells were lysed for 15 min with radio-immunoprecipitation assay cell lysis buffer (P0013B, Beyotime, Shanghai, China) containing phenylmethylsulfonyl fluoride and protease and phosphatase inhibitor cocktails on ice and then centrifuged for 5 min at 13 000 g, followed by the measurement of protein concentration with the bicinchoninic acid kit (Beyotime). Subsequent to the addition of 10% sodium dodecyl sulfate loading buffer, the proteins were denatured through a 10-min boiling water bath. The amount of the supplemented samples for each group was calculated as per the loading amount of proteins. After loading, the proteins were initially electrophoresed for 30 min at 80 V and then for 90 min at 120 V after the entry of bromophenol blue into the separation gel. Next, the proteins were transferred to a polyvinylidene fluoride membrane for 100 min in an ice bath at 250 mA. After three washes with washing solution (1–2 min each time), the membrane was sealed for 2 h with the blocking solution (5% skim milk in tris-buffered saline (TBS)/0.1% tween 20). After that, the membrane was incubated overnight at 4°C with primary antibodies against PARP9 (1 : 1000, ab53796, Abcam, Cambridge, UK), AKT (1 : 1000, 4691S, Cell Signaling Technology (CST), Beverly, MA, USA), phosphorylation (p-)AKT (1 : 1000, 4060S, CST), PI3K (1 : 1000, ab191606, Abcam), p-PI3K (1 : 1000, ab182651, Abcam), multidrug resistance protein 1 (MRP1; 1 : 1000, ab260038, Abcam), multiple drug resistance 1 (MDR1; 1 : 200, sc55511, Santa Cruz Biotechnology), PD-L1 (1 : 1000, ab205921, Abcam), cleaved caspase 3 (1 : 1000, ab32042, Abcam), p-Cdc2 (1 : 1000, sc-136014, Santa Cruz Biotechnology, Santa Cruz, CA, USA), Cyclin2 (1 : 1000, ab16663, Abcam), and GAPDH (1 : 2000, ab9485, Abcam). After three washes with TBS with Tween 20 (TBST) (10 min/time), the membrane was cultured for 2 h with goat anti-rabbit Immunoglobulin G secondary antibodies (A0208, 1 : 1000, Beyotime) at room temperature, followed by three TBST washes, 10 min/time. After the dropwise addition of electrogenerated chemiluminescence developer (P0018FS, Beyotime), the membrane was examined on a chemiluminescence imaging system (Bio-Rad) and analyzed with Quantity One v4.6.2 software. The gray scale ratio of the corresponding protein band to the GAPDH protein band was regarded as the relative protein level. The experiment was repeated three times to obtain the mean value [25, 26].
Plate clone formation assay
The transfected cells were trypsinized, after which they were centrifuged (25°C, 1500 rpm) and re-suspended with a complete medium. Cells were seeded in 6-well plates (500 cells/well) with 2 ml of complete medium preheated at 37°C, followed by 2–3 weeks of culture with 5% CO2 at 37°C. When the cell clones in the 6-well plates were observable to the naked eye, the culture was stopped. After removal of the medium, the plates were washed twice with PBS, and each well was supplemented with 1.5 ml of methanol for 15-min cell fixing. Afterward, the methanol was cautiously discarded, after which 1 ml of Giemsa staining liquids was slowly added along the well wall into the plates for 20-min staining in the dark. Subsequently, the Giemsa staining liquids were washed off with running water, and then the 6-well plates were placed upside down on clean absorbent papers to dry the cells, followed by clone counting [27].
Scratch assay
Cells were seeded into 6-well plates and when they grew to 90% confluence, a pipette tip was utilized to create cell scratches, and cells were eluted once in a serum-free medium. Next, cells were observed and photographed under a low-power phase contrast microscope (MK, Olympus, Tokyo, Japan) for comparison and analysis. Subsequent to further 24-h culture with a serum-free medium in an incubator (37°C, 5% CO2), the cells were photographed again for recording. Image Pro Plus software was used to measure the distance of cell migration, followed by calculation of migrating ability of cells [28].
Transwell assay
Cells (1 × 10⁵) were suspended in serum-free DMEM and seeded in a Matrigel (BD Biosciences, Franklin Lakes, NJ, USA)-coated Transwell chamber, followed by addition of 600 µl of medium with 10% FBS in the lower incubator. After 48-h culture in humid air containing 5% CO2 at 37°C, cells invading the lower surface of the membrane were fixed with 100% methanol and stained with 0.1% crystal violet. Additionally, the non-invasive cells on the upper surface of the membrane were removed with a cotton swab. The invasive cells were counted by photographing the cells on the lower surface of 5 random areas (200 ×) under a microscope (Olympus) [28].
Flow cytometry
After 8-h transfection, cells were subjected to digestion with 0.25% trypsin, and the concentration was adjusted to 1 × 10⁶ cells/ml. Afterward, 1 ml of cells were subjected to 10-min centrifugation at 1500 rpm, and the supernatant was discarded. Each milliliter of cells was supplemented with 2 ml of PBS and centrifuged again, after which the supernatant was removed and cells were fixed at 4°C with 70% precooled ethanol overnight. The following day, cells were washed twice with PBS, and 100 µl cell suspensions were cultured with 50 µg of propidium iodide (PI) staining liquids encompassing RNase in the dark for 30 min and then filtered with a 100-mesh nylon net. Finally, a flow cytometer (Becton, Dickinson and Company, Franklin Lakes, NJ, USA) was utilized to record the red fluorescence at 488 nm (excitation wavelength) for cell cycle measurement [29].
An annexin V-fluorescein isothiocyanate (FITC) cell apoptosis detection kit (Beyotime) was selected for cell apoptosis detection. Specifically, cells were trypsinized, centrifuged, and then re-suspended in the binding buffer. Afterward, PI and Annexin V-FITC were added to cells for 15 min of culture at room temperature, followed by examination of cell apoptosis on the flow cytometer [29].
Isolation, identification, and culture of human CD8+ T cells
Fresh blood from healthy donors was transferred into the blood collection tube with heparin anticoagulant and mixed. Phosphate-buffered saline with Tween 20 (PBST) with 2% FBS was added to dilute the blood at a ratio of 1 : 1. After that, an equal volume of lymphocyte isolation solution (#P8610/P8900, Solarbio, Beijing, China) was added to a SepMate-50 tube (#15450, Stemcell Technologies, Vancouver, BC, Canada). The diluted blood samples were subjected to 10 min of centrifugation at 1200 g (room temperature), after which they were slowly spread at the top of the lymphocyte isolation solution along the tube wall. The supernatants containing mononuclear cells were collected and washed with PBST, followed by 10-min centrifugation at room temperature and 300 g. EasySep human CD8+ T cell isolation kits (#17953, Stemcell Technologies) were used to separate high-purity CD8+ T cells as per the operation procedures of the manufacturer. Trypan blue staining was performed to test the activity of CD8+ T cells. An ImmunoCult-XF T cell amplification medium (#10981, Stemcell Technologies) was cultured with CD8+ T cells, followed by stimulation with CD3 antibody (final concentration: 5 µg/ml)/CD28 antibody (final concentration: 1 µg/ml) T cell activator (Stemcell Technologies). The present research was approved by the Ethics Committee of the Second Affiliated Hospital of Nanchang University and abided by the Declaration of Helsinki. Informed consent was provided by the healthy donors [30].
Co-culture of CD8+ T cells and MCF-7/FUL cells
MCF-7/FUL cells in the logarithmic proliferation period underwent digestion with 0.25% trypsin and were made into single-cell suspensions which were then spread on plates. MCF-7/FUL cells (1 × 10⁵ cells/well) and activated CD8+ T cells (1 × 10⁶ cells/well) were respectively placed in the outer and inner chambers of a Transwell that contained DMEM with 10% human AB serum Hyclone (South Logan, UT, USA). Cells were cultured under conditions of 37°C and 5% CO2 [30].
Enzyme-linked immunosorbent assay
The levels of interferon (IFN)-γ, interleukin (IL)-2, and tumor necrosis factor (TNF)-α were measured with corresponding enzyme-linked immunosorbent assay (ELISA) kits (R&D Systems, Minneapolis, MN, USA). Specifically, 100 µl samples or standards were initially added to sample wells, followed by 90-min incubation at 37°C. Specific antibodies and avidin-biotin-peroxidase complex diluents were added and incubated for 60 min and 30 min, respectively. Finally, after samples were cultured with tetramethylbenzidine developing agents for 20-25 min, the microplate reader (model 680) was utilized to measure the OD value at 450 nm [31].
Crystal violet staining
After three PBS washes, CD8+ T cells co-cultured with MCF-7/FUL cells were subjected to 10-min fixing with 4% paraformaldehyde at room temperature and 20-min immersion in 0.1% crystal violet (Sigma-Aldrich) at 37°C. Finally, these cells were rinsed with running water and then photographed and observed under a microscope (Nikon E600, Nikon, Tokyo, Japan) [30].
Propidium iodide staining
After 48-h co-culture with MCF-7/FUL cells, CD8+ T cells underwent centrifugation and two PBS washes. After cell centrifugation, the supernatant was discarded. Cells were fixed with –20°C-precooled ethanol (70% volume fraction) for 30 min. After the ethanol was removed, cells were mixed evenly with 500 µl of PBS and then cultured with PI staining liquids for 5 min, followed by observation and counting of PI-positive cells under a fluorescence microscope (Nikon). The percentage of PI-positive cells was then counted [30].
Tumor formation in nude mice
Eighteen male BALB/c nude mice (aged 4–6 weeks; weighing 16 ±2 g; Shanghai Laboratory Animal Center, Shanghai, China) were fed under specific pathogen-free and aseptic conditions (constant room temperature of 25–28°C, relative air humidity of approximately 50%, a cycle of 12-h light and 12-h dark) with free access to food and water. The paddings were changed every 3 days under sterile conditions. The nude mice were arranged into three groups (MCF-7/FUL, sh-PARP9, and sh-NC groups) and subject to intraperitoneal injection of pentobarbital sodium (60 mg/kg) for anesthetization, after which the skins in the dorsal axilla of their right forelimb were conventionally disinfected with iodophor. Each nude mouse from the MCF-7/FUL group was inoculated with 0.2 ml MCF-7/FUL cell suspensions (1 × 10⁶ cells). Nude mice from the sh-PARP9 and sh-NC groups were separately injected with equal volumes of MCF-7/FUL cells stably transfected with sh-PARP9 and sh-NC. After injection, the needle was slowly withdrawn to avoid leakage of liquids, and mice were labeled. Five weeks later, the nude mice were euthanized with cervical dislocation, after which their subcutaneous tumors were isolated and weighed. Next, tumor volume was calculated: tumor volume = 1/2 × long diameter × short diameter2. qRT-PCR or western blot was utilized to examine the expression of related genes or proteins in tumor tissues. All animal experiments complied with the rules, regulations, and operation specifications of laboratory animal management and met the related ethical requirements for laboratory animals [28].
Immunohistochemistry
The isolated tumor tissues were fixed in 4% paraformaldehyde for 48 h and made into paraffin sections (4 µm). Following 20-min baking, the sections were conventionally dewaxed in xylene and then washed once with distilled water. After three PBS washes, the sections were dropwise added with 3% H2O2 and allowed to stand for 10 min at room temperature. The sections were then subjected to three PBS washes and heat-induced antigen retrieval. After that, the sections were washed three times with PBS and reacted with normal goat serum blocking solution for 20 min at room temperature, followed by removal of redundant liquids. The sections were incubated at 4°C with Ki67 primary antibodies (ab15580, Abcam) overnight, followed by three PBS rinses and 1-h incubation with secondary antibodies at 37°C. After three PBS rinses, diaminobenzidine (DAB) was used for 1–3 min of coloring, and then the reaction ceased. Thereafter, the sections were treated with hematoxylin for 3 min of nucleus staining before dehydration, clearing, and mounting. Afterward, a microscope (× 200) was utilized for observation, and immunohistochemistry (IHC) scores were analyzed with Image J software in three random fields of view. Double-blind scoring was performed by two experienced pathologists. Ki67 positivity was considered to be the presence of tan granules in the cell nucleus, and the percentage of positive cells and staining intensity under the microscope were scored with semi-quantitative judgments. The scoring of the percentage of positive cells was as follows: 0 points, the percentage of positive cells < 5%; 1 point, 5–25%; 2 points, 26–50%; 3 points, 51–75%; and 4 points, 76–100%. The positive staining intensity was scored as follows: 0 points for colorless, 1 point for faint yellow, 2 points for tan, and 3 points for brown. The positive degree was calculated by multiplying these two scores: 0 points, negative; 1–4 points, weakly positive; 5–8 points, positive; and 9–12 points, strongly positive [32].
Terminal deoxynucleotidyl transferase-mediated dUTP-biotin nick end-labeling staining
Tumor tissues of nude mice were fixed overnight in 4% paraformaldehyde, after which they were embedded in paraffin and sectioned. Five sections were dewaxed and hydrated, after which each section was cultured with 50 µl of 1% proteinase K diluents in a 37°C incubator for 30 min. The sections were then cultured at room temperature with methanol solution containing 0.3% H2O2 for 30 min to eliminate the endogenous peroxidase activity before the addition of dUTP-biotin nick end-labeling (TUNEL) solution. The sections were then incubated with terminal deoxynucleotidyl transferase (TdT) and horseradish peroxidase-labeled streptavidin, followed by 15-min culture with 2% DAB at room temperature. After 15-min nucleus counterstaining with hematoxylin, the sections were dehydrated, cleared, and then mounted with neutral gum. An optical microscope was utilized for photography, and five random fields of vision were chosen from each section. Image-Pro Plus 6.0 software was used to count the number of positive or nucleated cells in each field of vision. Cells with a tan nucleus were considered apoptosis-positive cells, while cells with a blue nucleus were normal cells. The mean value was obtained, and the ratio of positive cells to total cells was the percentage of TUNEL-positive cells [33].
Statistical analysis
All data were statistically analyzed with GraphPad prism7 software and summarized as mean ± standard deviation. The T-test was utilized for comparisons between two groups, and one-way analysis of variance for comparisons among multiple groups. Tukey’s test was used for post hoc multiple comparisons. A difference with p < 0.05 was considered statistically significant.
Results
PARP9 was highly expressed in drug-resistant breast cancer cells
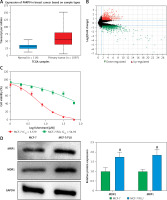
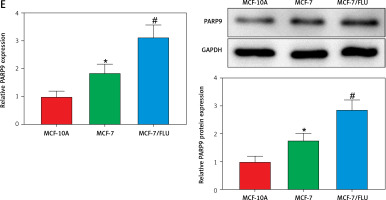
PARP9 has been shown to facilitate recurrence and metastasis in lymphoma [34]. Nevertheless, few studies have reported its role in breast cancer. The analysis of The Cancer Genome Atlas (TCGA) showed that, in comparison with normal tissues, PARP9 was highly expressed in breast cancer tissues (Figure 1 A). Additionally, microarray analysis was conducted with the GSE74391 dataset for FUL-resistant genes in estrogen receptor-positive (ER+) breast cancer cells, which revealed that PARP9 expression was markedly higher in FUL-resistant MCF-7 cells than that in FUL-sensitive MCF-7 cells (Figure 1 B), indicating the involvement of high PARP9 expression in FUL resistance of breast cancer cells. Afterward, the purchased FUL-resistant MCF-7/FUL cells were verified, and the growth curve exhibited a substantially higher IC50 value of FUL in MCF-7/FUL cells than in parental sensitive cells, with a resistance index of about 9.78 (Figure 1 C). Furthermore, western blot data reflected that, in contrast to parental MCF-7 cells, MCF-7/FUL cells had marked elevations in the expression of DR-related proteins MRP1 and MDR1 (Figure 1 D, #p < 0.05), which further illustrated the FUL resistance of MCF-7/FUL cells. Last, PARP9 expression was examined in MCF-7/FUL and parental cells. It was noted that PARP9 was markedly highly expressed in MCF-7 cells versus normal cells (*p < 0.05). Meanwhile, PARP9 expression was also enhanced in MCF-7/FUL cells in comparison with parental MCF-7 cells (Figure 1 E, #p < 0.05). To sum up, PARP9 might be essential for the regulation of FUL resistance in breast cancer cells.
Figure 1
PARP9 expression is high in FUL-resistant breast cancer cells. A – TCGA database analysis of PARP9 expression in breast cancer; B – GSE74391 dataset analysis of PARP9 expression in FUL-resistant ER+ breast cancer cells; C – drug resistance of cells after FUL treatment; D – Western blot to detect the expression of drug resistance-related proteins MRP1 and MDR1 in parental MCF-7 cells and MCF-7/FUL cells; E – qRT-PCR and western blot to measure PARP9 expression in MCF-10A, MCF-7, MCF-7/FUL cells. Data were displayed in the form of mean ± standard deviation and cell experiments were repeated 3 times
*p < 0.05 compared with the MCF-10A group; #p < 0.05 compared with the MCF-7 group.
PARP – poly-ADP-ribose polymerase, DR – drug-resistant, TCGA – The Cancer Genome Atlas, GSE – gene expression omnibus series, FUL – fulvestrant, ER – estrogen receptor, MRP – multidrug resistance protein, MDR – multiple drug resistance.
Knockdown of PARP9 inhibited the malignant phenotypes and chemoresistance of FUL-resistant breast cancer cells
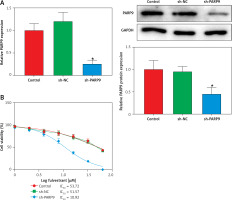
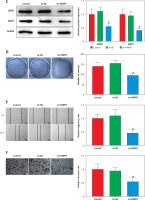
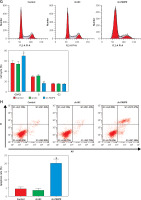
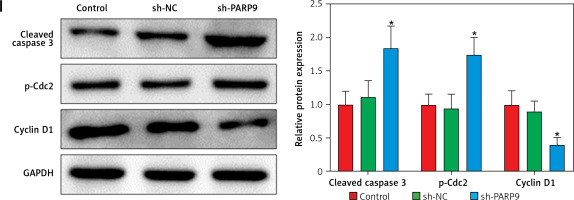
To further ascertain the effect of PARP9 on FUL-resistant breast cancer cells, sh-PARP9 vectors were transfected into MCF-7/FUL cells, followed by determination of PARP9 expression. The results showed that sh-PARP9 markedly lowered PARP9 expression in MCF-7/FUL cells (Figure 2 A, *p < 0.05). Subsequently, the impact of sh-PARP9 on cell growth and chemoresistance of MCF-7/FUL cells was observed. The growth curve and western blot results revealed that the knockdown of PARP9 repressed the resistance of MCF-7/FUL cells to FUL, accompanied by decreased IC50 and the expression of MRP1 and MDR1 in cells (Figures 2 B, C, *p < 0.05). The results of plate clone formation, scratch, and Transwell assays showed that after transfection of sh-PARP9, the proliferative, migrating, and invasive properties of MCF-7/FUL cells were substantially diminished (Figures 2 D–F, *p < 0.05). Data from flow cytometry indicated that the ratio of cells at the G0/G1 phase was remarkably enhanced, the ratio of cells at the S phase was reduced, and apoptosis was elevated in MCF-7/FUL cells after sh-PARP9 transfection (Figures 2 G, H, *p < 0.05). Western blot data revealed substantial increases in the expression of the cell cycle-related protein p-Cdc2 and the apoptotic protein cleaved caspase 3 but decreases in the expression of the cell cycle-related protein cyclin D1 in the sh-PARP9 group relative to the sh-NC group (Figure 2 I, *p < 0.05). In a word, PARP9 knockdown suppressed the malignant phenotypes and chemoresistance of FUL-resistant breast cancer cells.
Figure 2
Knockdown of PARP9 inhibits the malignant phenotypes and chemoresistance of FUL-resistant breast cancer cells. Sh-PARP9 or sh-NC was transfected into MCF-7/FUL cells, A – qRT-PCR and western blot to measure PARP9 expression; B – drug resistance assessment of cells after FUL treatment; C – Western blot to examine the expression of drug resistance-related proteins MRP1 and MDR1; D – plate clone formation assay to monitor cell proliferation; E – scratch test to observe cell migration; F – transwell assay to assess cell invasion; G – flow cytometry to detect cycle distribution of cells; H – flow cytometry to test cell apoptosis; I – Western blot to measure cyclin D1, p-Cdc2, and cleaved caspase 3 expression. Data were displayed in the form of mean ± standard deviation and experiments were repeated 3 times
*p < 0.05 compared with the sh-NC group.
PARP – poly-ADP-ribose polymerase, CT – chemotherapy, DR – drug-resistant, FUL – fulvestrant, sh – short hairpin, qRT-PCR – quantitative reverse transcription-polymerase chain reaction, MRP – multidrug resistance protein, MDR – multiple drug resistance, Cdc – cell division cycle, NC – negative control.
PARP9 knockdown inactivated the PI3K/AKT pathway to repress the malignant phenotypes and chemoresistance of FUL-resistant breast cancer cells
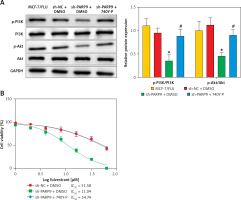
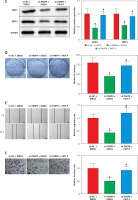
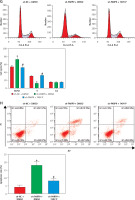
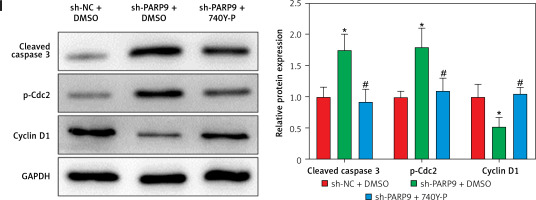
It was concluded from the above results that PARP9 knockdown inhibited malignant phenotypes and chemoresistance of MCF-7/FUL cells. However, the related molecular mechanism remains poorly characterized. As reported, the PI3K/AKT pathway mediates chemoresistance in the tumor microenvironment [35]. Therefore, this research investigated whether the knockdown of PARP9 orchestrated malignant phenotypes and chemoresistance of FUL-resistant breast cancer cells via the PI3K/AKT pathways. Sh-PARP9 and 740Y-P (a PI3K activator, 15 µM [36]) were simultaneously utilized to treat MCF-7/FUL cells. The results showed that p-PI3K and p-AKT expression was substantially lowered in the sh-PARP9 + DMSO group relative to the sh-NC + DMSO group (*p < 0.05). However, converse trends were noted in MCF-7/FUL cells of the sh-PARP9 + 740Y-P group relative to those of the sh-PARP9 + DMSO group (Figure 3 A, #p < 0.05). Furthermore, IC50 values of FUL, MRP1 and MDR1 expression, and cell proliferative, migrating, and invasive abilities were enhanced, the ratio of cells at the G0/G1 phase was reduced, the ratio of cells at the S phase was increased, and cell apoptosis was diminished in MCF-7/FUL cells of the sh-PARP9 + 740Y-P group in contrast to those of the sh-PARP9 + DMSO group (Figures 3 B–I, #p < 0.05). These data demonstrated that PARP9 knockdown depressed the malignant phenotypes and chemoresistance of FUL-resistant breast cancer cells via inactivation of the PI3K/AKT pathway.
Figure 3
PARP9 knockdown inactivates the PI3K/AKT pathway to inhibit the malignant phenotypes and chemoresistance of FUL-resistant breast cancer cells. MCF-7/FUL cells were treated with sh-NC + DMSO, sh-PARP9 + DMSO, and sh-PARP9 + the PI3K activator 740Y-P. A – qRT-PCR and western blot detection of PI3K and AKT expression; B – testing of drug resistance of cells after FUL treatment; C – Western blot assessment of MRP1 and MDR1 expression; D – plate clone formation assay detection of cell proliferation; E – scratch test examination of cell migration; F – transwell assay testing of cell invasion; G – flow cytometry measurement of cell cycle distribution; H – flow cytometry detection of cell apoptosis; I – Western blot assessment of expression of cyclin D1, p-Cdc2 and cleaved caspase 3. Data were displayed in the form of mean ± standard deviation and experiments were repeated 3 times
*p < 0.05 compared with the sh-NC + DMSO group; #p < 0.05 compared with the sh-PARP9 + DMSO group.
PARP – poly-ADP-ribose polymerase, PI3K – phosphoinositide 3-kinase, AKT – protein kinase B, CT – chemotherapy, DR – drug-resistant, FUL – fulvestrant, sh – short hairpin, qRT-PCR – quantitative reverse transcription-polymerase chain reaction, MRP – multidrug resistance protein, MDR – multiple drug resistance, Cdc – cell division cycle, DMSO – dimethyl sulfoxide.
PARP9 knockdown downregulated PD-L1 expression to suppress immune escape by blocking the PI3K/AKT pathway
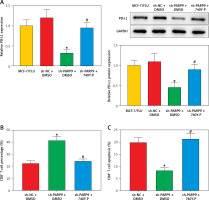
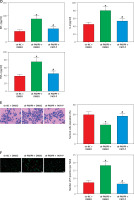
Prior research elucidated that the PI3K/AKT pathway modulated PD-L1 expression and thus affected tumor immune escape [22]. Accordingly, the influence of treatment of sh-PARP9 and/or 740Y-P on PD-L1 protein expression was further investigated in MCF-7/FUL cells. The results indicated that PD-L1 expression markedly decreased in the sh-PARP9 + DMSO group relative to the sh-NC + DMSO group (*p < 0.05), whereas opposite trends were detected in the sh-PARP9 + 740Y-P group in comparison with the sh-PARP9 + DMSO group (Figure 4 A, #p < 0.05). Afterward, to identify whether PARP9 affected immune escape of tumors by regulating PD-L1 expression via the PI3K/AKT pathway, sh-PARP9 was transfected alone or co-treated with 740Y-P into MCF-7/FUL cells which were then cultured with flow cytometer-identified CD8+ T cells for 12 h. The results demonstrated a marked enhancement in the percentage of CD8+ T cells, a substantial reduction in cell apoptosis, and a considerable increase in IFN-γ, TNF-α, and IL-2 levels in the sh-PARP9 + DMSO group versus the sh-NC + DMSO group (*p < 0.05). Meanwhile, there were opposite trends in the sh-PARP9 + 740Y-P group versus the sh-PARP9 + DMSO group (Figures 4 B–D, #p < 0.05). Subsequently, the lethal effect of co-culture on MCF-7/FUL cells was assessed. Crystal violet and PI staining results revealed significant declines in the intensity of adherent cells and gradual enhancements in the positive cell rate in MCF-7/FUL cells of the sh-PARP9 + DMSO group versus those of the sh-NC + DMSO group, implying that MCF-7/FUL cells with low PARP9 expression were more sensitive to CD8+ T cell-mediated tumor cytotoxicity (*p < 0.05). Nevertheless, the intensity of adherent cells markedly increased and the positive cell rate gradually decreased in the sh-PARP9 + 740Y-P group relative to the sh-PARP9 + DMSO group (Figures 4E, F, #p < 0.05). In conclusion, PARP9 knockdown blocked the PI3K/AKT pathway to downregulate PD-L1 expression, thus repressing immune escape.
Figure 4
PARP9 knockdown blocked the PI3K/AKT pathway to reduce PD-L1 expression, thus repressing immune escape in FUL-resistant breast cancer cells. MCF-7/FUL cells were treated with sh-NC + DMSO, sh-PARP9 + DMSO, and sh-PARP9 + the PI3K activator 740Y-P. A – qRT-PCR and western blot to test expression of PD-L1; CD8+ T cells were co-cultured with the transfected MCF-7/FUL cells. B – Percentage detection of CD8 + T cells. D – ELISA to check IL-2, IFN-γ, and TNF-α expression condition in cell supernatants; E – crystal violet staining to monitor MCF-7/FUL cells; F – PI staining to observe apoptosis of MCF-7/FUL cells. Data were displayed in the form of mean ± standard deviation and experiments were repeated 3 times
*p < 0.05 compared with the sh-NC + DMSO group; #p < 0.05 compared with the sh-PARP9 + DMSO group.
PARP – poly-ADP-ribose polymerase, PI3K – phosphoinositide 3-kinase, AKT – protein kinase B, PD-L – programmed death ligand, FUL – fulvestrant, sh – short hairpin, qRT-PCR – quantitative reverse transcription-polymerase chain reaction, ELISA – enzyme-linked immunosorbent assay, IL – interleukin, IFN – interferon, TNF – tumor necrosis factor, PI – propidium iodide, NC – negative control, DMSO – dimethyl sulfoxide.
PARP9 knockdown suppressed the growth of tumor in vivo
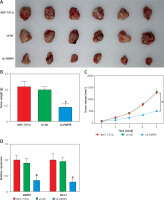
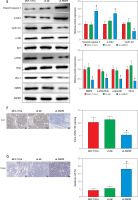
To further probe the impact of PARP9 in vivo, MCF-7/FUL cells stably transfected with sh-PARP9 or sh-NC were injected into nude mice, followed by the measurement of breast cancer xenograft growth and related protein expression in nude mice. The data revealed that compared with the sh-NC group, the volume and weight of xenografts substantially decreased in the sh-PARP9 group (Figures 5 A–C, *p < 0.05). Western blot results revealed that the protein expression of PARP9, p-PI3K, p-AKT, PD-L1, and cyclin D1 was markedly reduced while that of p-Cdc2 and cleaved caspase 3 was enhanced in the sh-PARP9 group versus the sh-NC group (Figures 5 D, E, *p < 0.05). Immunohistochemistry data showed substantially decreased Ki67 expression in the sh-PARP9 group relative to the sh-NC group (Figure 5 F, *p < 0.05). TUNEL staining results of apoptosis in tumor tissues showed that the sh-PARP9 group had marked elevations in the positive cell rate versus the sh-NC group, indicating that sh-PARP9 accelerated apoptosis (Figure 5 G, *p < 0.05). In summary, the low expression of PARP9 significantly inhibited tumor growth in vivo.
Figure 5
Knockdown of PARP9 suppresses tumor growth in vivo. MCF-7/FUL cells stably transfected with sh-PARP9 or sh-NC were injected into mice. A–C – The changes of xenograft substance, growth curve, and weight in nude mice; D – qRT-PCR or western blot detection of PARP9, PI3K, AKT, PD-L1, cyclin D1, p-Cdc2, and cleaved caspase 3 expression; E – qRT-PCR or western blot detection of PARP9, PI3K, AKT, PD-L1, cyclin D1, p-Cdc2, and cleaved caspase 3 expression; F – IHC measurement of Ki67 expression; G – TUNEL staining observation of apoptosis in tumor tissues. Data were displayed in the form of mean ± standard deviation and n = 6 nude mice
*p < 0.01 compared with the sh-NC group.
PARP – poly-ADP-ribose polymerase, FUL – fulvestrant, sh – short hairpin, qRT-PCR – quantitative reverse transcription-polymerase chain reaction, PI3K – phosphoinositide 3-kinase, AKT – protein kinase B, PD-L – programmed death ligand, Cdc – cell division cycle, IHC – immunohistochemistry, TUNEL – TdT-mediated dUTP-biotin nick end-labeling, NC – negative control.
Discussion
Breast cancer is among the most frequent cancers in women worldwide, with an increasing incidence and mortality [37]. Considering the involvement of drug resistance and immune escape in the failure of breast cancer treatment [38, 39], this study evaluated the impacts of PARP9 and the PI3K/AKT pathway on chemoresistance and immune escape in breast cancer. It was concluded from our data that PARP9 knockdown protected against chemoresistance and immune escape of breast cancer cells by blocking the PI3K/AKT pathway and downregulating PD-L1 expression.
As a key target protein closely associated with immunotherapy and tumor sensitivity [10, 40], PARP9 was revealed to be highly expressed in breast cancer cells and tissues [41], which is similar to our experimental results indicating that PARP9 expression was higher in MCF-7 cells vs. normal cells and TCGA prediction results of high expression of PARP9 in breast cancer tissues. Of note, previous studies demonstrated that PARP9 played a crucial role in regulating chemoresistance and cell growth in tumors [8, 42]. Therefore, it is reasonable to hypothesize that PARP9 may be implicated in the chemoresistance of breast cancer. Having been utilized for research on drug resistance of breast cancer [43, 44], FUL was used to treat MCF-7 cells to verify the involvement of PARP9 in the chemoresistance of breast cancer. The results showed the upregulation of PARP9 in MCF-7/FUL cells versus parental MCF-7 cells. Moreover, our observations revealed that the knockdown of PARP9 suppressed MCF-7/FUL cell migration, proliferation, and invasion, partially concurrent with prior research results indicating that PARP9 overexpression promoted breast cancer cell migration [11]. Meanwhile, the expression of cyclin D1, an important oncoprotein responsible for breast cancer cell proliferation and drug resistance [45], was reduced in MCF-7/FUL cells after silencing PARP9. Drug sensitivity-related Cdc2 [46] and apoptosis-related cleaved caspase 3 [47] were also upregulated in MCF-7/FUL cells after PARP9 downregulation. We also monitored decreased IC50 and drug resistance-related MRP1 and MDR1 [48, 49] expression in MCF-7/FUL cells after sh-PARP9 transfection. We further confirmed that PARP9 knockdown blocked tumor growth in vivo. Nevertheless, the role of PARP9 in immune escape has barely been explored. Intriguingly, our data revealed that PARP9 knockdown enhanced CD8+ T cell viability, decreased CD8+ T cell apoptosis, and increased the expression of immune-related factors IL-2, IFN-γ, and TNF-α. CD8+ T cell dysfunction triggers immune escape in tumors, whereas the reduction of IFN-γ, IL-2, and TNF-α contents helps tumor cells escape from immune responses [50, 51]. The aforementioned results fully illustrated the function of PARP9 knockdown in ameliorating chemoresistance and immune escape of breast cancer cells.
A previous study demonstrated that PARP9 activated the PI3K/AKT pathway during RNA virus infection [14]. Similar to this observation, our experimental results indicated that the phosphorylation of PI3K and AKT decreased in sh-PARP9-treated MCF-7/FUL cells. The PI3K/AKT pathway is a key pathway participating in the growth and chemoresistance of breast cancer [35, 52]. Likewise, the activation of the PI3K/AKT pathway restored PARP9 knockdown-induced decreases in FUL resistance and MRP1 and MDR1 expression in breast cancer cells. Concordantly, prior research showed that the inhibition of the PI3K/AKT/mTOR pathway sensitized breast cancer cells to FUL and that the PI3K/AKT pathway blockade resulted in reductions in MDR1 and MRP1 expression in human chronic myelogenous leukemia cells [53, 54]. Inactivation of the PI3K/AKT pathway also contributed to breast cancer cell apoptosis [55]. Consistently, our data revealed that the activated PI3K/AKT pathway abrogated elevations in MCF-7/FUL cell apoptosis and reductions in cell migration, proliferation, and invasion caused by PARP9 knockdown. Furthermore, Fang et al. observed the promoting function of PD-L1 in immune escape of breast cancer [56, 57]. Furthermore, PD-L1 expression was enhanced in lung cancer by activation of the PI3K/AKT pathway [58]. We likewise observed that PD-L1 was downregulated in PARP9-silencing breast cancer cells, accompanied by increases in the percentage of CD8+ T cells and the expression of IL-2, TNF-α, and IFN-γ and declines in CD8+ T cell apoptosis in supernatants, which was nullified by further activation of the PI3K/AKT pathway. Similarly, previous research revealed that the RAS/PI3K/AKT/mTOR pathway participated in the suppression of CD8+ T cell infiltration in pancreatic cancer [59].
In conclusion, we elucidated that the knockdown of PARP9 blocked the PI3K/AKT/PD-L1 axis to reduce chemoresistance and immune escape in breast cancer, which might support PARP9 as a novel and promising target for breast cancer treatment. In addition, our findings also implicate the potential of PI3K/AKT pathway inhibition as a candidate target in breast cancer treatment. Moreover, combined with the existing clinical trials of PI3K/AKT pathway inhibitors in breast cancer [60, 61], blocking the PI3K/AKT pathway holds great potential in optimizing the outcomes of breast cancer patients in the future.


