Introduction
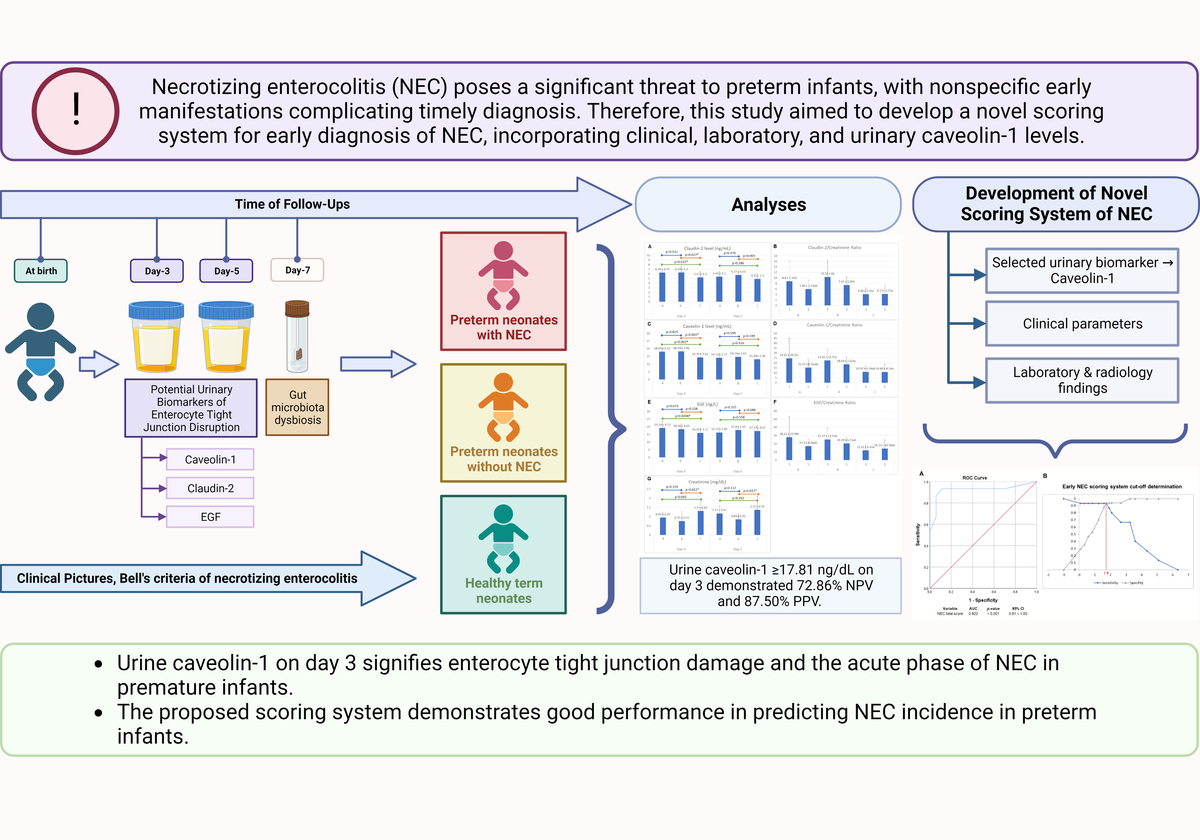
Necrotizing enterocolitis (NEC) is an acute inflammatory, multifactorial disease of intestinal injury, and necrosis that primarily affects preterm infants and is a leading cause of morbidity and mortality [1]. The global incidence of NEC is reported to vary from 7 to 13% in preterm and very low birthweight (VLBW) infants, i.e. birthweight < 1500 g [2, 3]. Although the incidence was 8.6% among preterm infants born in a single-center tertiary hospital in Indonesia, the data were sparse and limited [4]. Of all NEC cases primarily in VLBW infants, 27 to 52% were reported to require further surgical intervention, including laparotomy and bowel resection [5]. Despite modern advances in intensive neonatal care, the NEC mortality rate remains frequent, with rates reported between 18% and 63% [6–8]. Although the etiology of NEC remains elusive, multiple risk factors, including prematurity, low birth weight, hypoxia, abnormal microbiota colonization in the intestinal tract, microcirculatory disorders, formula feeding, and patent ductus arteriosus, have been highlighted with respect to their involvement in the development of NEC [9, 10]. Recent studies have suggested that sepsis, as a severe infectious disease, is a contributing factor for NEC. The incidence of NEC in patients with sepsis ranges from 34% to 57% [11, 12]. However, these risk factors may vary widely based on the advances in neonatal intensive care, which may differ between developed and developing countries, leading to varying degrees of clinical outcomes.
The diagnosis of NEC is established by the modified Bell’s criteria, which comprise systemic signs, abdominal, and radiologic findings [13]. Due to the multifactorial nature of NEC, the clinical manifestations are non-specific and have been observed to overlap with other diseases of gastrointestinal origin; thus, clinicians have depended on plain abdominal radiography (AXR) to find the telltale sign of NEC, i.e. pneumatosis intestinalis, though it is not always present, being found in approximately 39.4% of all NEC cases [14–16]. Therefore, developing an early diagnostic system for NEC is still a vast area of investigation encouraged to be explored.
There is no gold standard test for the diagnosis of NEC, and identifying infants at disease onset remains challenging. Neu and Walker (2017) stated that Bell’s criteria had several limitations and required updating in the NEC diagnosis, and the term “Bell’s is broken” appeared [1]. Several limitations of Bell criteria were especially observed in detecting the acute phase of NEC, which was often missed due to various signs and clinical symptoms of NEC overlapping with clinical symptoms of other diseases. The early detection of potential NEC biomarkers can improve morbidity and reduce mortality [16, 17].
Sensitive and specific laboratory parameters that can detect the acute phase of NEC are required to improve Bell’s criteria. Previous studies related to NEC biomarkers have widely utilized acute-phase proteins, cytokines, chemokines, and cell surface antigens, together with clinical and radiological signs and symptoms, to identify preterm infants with NEC. However, these biomarkers were detectable after the acute phase of NEC and were also highly detectable in the cascade of inflammatory processes that occurred in preterm infants without NEC [18]. Serum biomarkers, such as TGF-β, were proven to have good sensitivity and specificity to detect the early phase of NEC; however, they required an invasive procedure [19]. Thus, another sensitive, specific, yet non-invasive biomarker was required to detect preterm neonates with NEC in the acute phase.
Tight junction protein components could potentially become specific biomarkers in the early detection of NEC [20–22]. Tight junction disruption is closely related to an imbalance in the intestinal microbiota (dysbiosis) and the inflammatory process in the early pathogenesis of NEC, which would trigger the degradation of tight junction components in the digestive tract. The degradation of tight junction components increases gut permeability and induces inflammatory reactions. Subsequently, tight junction proteins are released from the intestinal epithelium into the systemic circulation and released through urinary excretion [21, 23].
The degradation of tight junction protein components associated with NEC were claudin-2, caveolin-1, and epidermal growth factor (EGF) [24–26]. Previous studies noted that increased expression of claudin-2 in enterocytes led to increased binding of claudin-2 with caveolin-1 [27], which acted synergistically in increasing the permeability of the gastrointestinal barrier on days 5 and 7 [23]. On the other hand, damage to enterocytes triggered an increase in absorption and secretion of EGF from the luminal on the 7th day and fall back to the baseline 1–2 days later as a repair response to gastrointestinal (GI) tract damage that occurred in NEC [28]. Because of clinically unstable NEC patients, i.e. preterm infants admitted to the NICU, the majority of urinary tight junction biomarkers were still in vivo and there is a lack of human subject research [23, 25, 29]. Therefore, this study aimed to explore urinary levels of claudin-2, caveolin-1, and EGF levels across three groups of neonates, i.e. preterm with NEC, preterm without NEC, and healthy term infants.
Nevertheless, utilizing only one laboratory parameter would be inadequate; attending clinicians should observe patients as a whole, combining risk factors, clinical pictures, and laboratory profiles to establish a diagnosis. Lueschow et al. (2021) suggested a combination of a scoring system with a high sensitivity and specificity biomarker to develop a novel scoring system with better performance to improve Bell’s criteria. Furthermore, the development of a novel scoring system using a machine learning approach accompanied by additional data on other parameters (e.g., biomarkers) to improve the performance of NEC diagnostic methods has been encouraged [30].
Indonesia is an archipelago country where healthcare access disparities are not uncommon [31]. Therefore, encouraging the simplicity of an early NEC diagnosis without compromising its sensitivity is important. In the present study, we developed a novel scoring system by utilizing the parameters from Bell’s criteria and combined it with noninvasive urinary tight junction biomarkers that had been evaluated with a machine learning analysis. As mentioned previously, NEC is preceded by gut microbiome dysbiosis [32]; therefore, to prove true NEC subjects in this study, the diagnosis of NEC in our subjects was established using Bell’s criteria, accompanied by proven gut dysbiosis by quantitative PCR (qPCR). As it is difficult to establish a gold standard of NEC pathology and it is technically difficult, as well as ethically challenging to obtain intestinal tissue biopsy in NEC infants [33], especially in lower stages of Bell’s criteria, the diagnosis of NEC in our cohort was established by both Bell’s criteria and the trend of marked gut microbiota dysbiosis from stool qPCR to improve subject discrimination reliability.
Material and methods
Study background and ethical approval
This single-center cohort study involving preterm and term neonates was conducted at a tertiary hospital perinatology ward and neonatal intensive care unit (NICU) of Saiful Anwar General Hospital (SAGH), Malang, East Java, Indonesia, between January and June 2022. The participants were followed up and further divided into three groups: preterm neonates with NEC (Group A), preterm neonates without NEC (Group B), and healthy term infants (Group C, control). The subjects were followed up until they reached clinical outcomes or at the age of 28 days. This study was approved by the Research Ethics Committee of the Saiful Anwar General Hospital and registered at clinicaltrials.gov (NCT05335577) for a detailed protocol. Informed consent was obtained from all the parents. Routine blood examinations were drawn from preterm subjects, while full-term infants were not tested due to the absence of clinical indications in healthy term infants. Blood samples were analyzed in the Central Laboratory of Clinical Pathology, SAGH. The urine samples subjected to biomarker studies were analyzed at the Central Laboratory of Biomedical Science, Faculty of Medicine, Brawijaya University. The stool samples used to identify the gut microbiome were analyzed at the Institute of Bioscience, Brawijaya University.
Eligibility of participants
Preterm neonates born at a gestational age (GA) of 28–34 weeks by caesarean section (CS) or vaginal delivery, treated in the perinatology department or NICU of SAGH, were included in this study as preterm subjects. Preterm neonates who developed NEC based on Bell’s modified criteria and gut (intestinal) microbiota dysbiosis were included in the preterm NEC (Group A). Preterm neonates who did not develop NEC were assigned as preterm neonates without NEC (Group B). Healthy term infants born at 38–42 weeks, clinically stable, and without any pathological signs or symptoms, were included in Group C (control). All subjects included in this study were exclusively or predominantly breastfed, and none of them received probiotics. For Group A, neonates who died or were transferred during the study before the NEC diagnosis was established and those requiring surgery other than those indicated for NEC grade III were excluded from the study. Infants who developed congenital anomalies were excluded from Groups B and C. The data collection ceased in cases of death or transfer to other hospitals.
Subject sample size and sampling technique
The subject sample size was calculated using G*Power 3.1.9.7 software [34]. The setting was a prospective cohort study using a repeated measures statistical test (ANOVA), involving three groups of independent variables (premature infants with NEC, premature infants without NEC, and healthy term infants) with two sampling times (days 3 and 5). Effect size f = 0.4118374 was determined by the urinary tight junction protein level based on previous studies by Blackwood et al. (2015) [21], α = 0.05, β = 0.20, number of groups = 3, number of measurements = 2, and an intra-class correlation coefficient = 0.5 with the assumption of a moderate correlation between variables [35]. Thus, the minimum total number of urine samples needed was 48 samples, with a minimum of 8 subjects in each group. To anticipate a reduction in the number of subjects, 10% was added to the initial number of subjects required; thus, 10 subjects were required in each group.
Definitions
NEC cases were defined as infants diagnosed with NEC grade 2 or higher based on the modified Bell’s criteria (Supplementary Table SI) and intestinal dysbiosis proven by qPCR. Intestinal or gut microbiota dysbiosis was defined as a significant difference in the fold change in the gut microbiota between NEC subjects and preterm or term neonates. NEC was diagnosed by two independent neonatologists. Blood samples and laboratory features were analyzed independently by the Central Laboratory of Clinical Pathology. Urinary samples were collected on day 3 and day 5 of life, while stool samples were collected on day 7. Urinary claudin-2, caveolin-1, and EGF levels were analyzed using a sandwich enzyme-linked immunosorbent assay (ELISA). Stool samples for the gut microbiota profile were analyzed using quantitative real-time polymerase chain reaction (qPCR), as indicated by fold change. All bodily fluid samples were analyzed independently by a trained technician at each laboratory who was blinded to the study.
Urinary biomarker assay with ELISA
Urine samples were collected (±3 ml) from the urine collector, sealed, and transferred immediately to an ice box. The sample storage was carried out at 4°C for 5 days or frozen at –20°C for 1 month, or –80°C for 6 months in a freezer. Sandwich ELISA kits were pre-coated 96-well plates with human caveolin-1 (E1727Hu), claudin-2 (E2301Hu), EGF (E0144Hu), and creatinine (EA0134Hu). Urinary biomarkers of tight junction disruption were tested according to the manufacturer’s instructions using ELISA test kits (BT-Lab, Shanghai, China). The optical density was measured at 450 nm and a standard curve was constructed to generate each protein concentration. Each urinary biomarker was normalized to the urinary creatinine level using the biomarker/creatinine ratio.
Stool sample for quantitative PCR
Stool samples (±40 mg) were collected from diaper liner, sealed, and transferred immediately to an ice box. The samples were stored at –80°C for over 6 months in a freezer. The intestinal microbiota DNA was extracted using a QIAamp DNA Stool Mini Kit (Qiagen, Germantown, MD, USA) according to the manufacturer’s protocol. The concentration and quantity of the DNA obtained were determined using assay reagents. The intestinal microbiota analysis revealed fold changes in gene expression in the phyla Proteobacteria, Firmicutes, and Bacteroidetes. Further analyses were conducted to identify several genera, including Klebsiella spp., uropathogenic E. coli (UPEC), and Pseudomonas spp. from Proteobacteria; Clostridium spp. and Lactobacillus spp. from Firmicutes; Bacteroides spp. and Prevotella spp. from Bacteroidetes; and Bifidobacterium spp. The specific primers used in this study are depicted in Supplementary Table SII from the 16s ribosomal RNA (rRNA) genes based on previous studies [36–43]. The sequences were generated from IndoSequence, Institute of Bioscience, Brawijaya University. qPCR was conducted as per the Livak protocol and expressed as relative 2–ΔΔCT with Group C as an internal control [44].
Statistical analysis
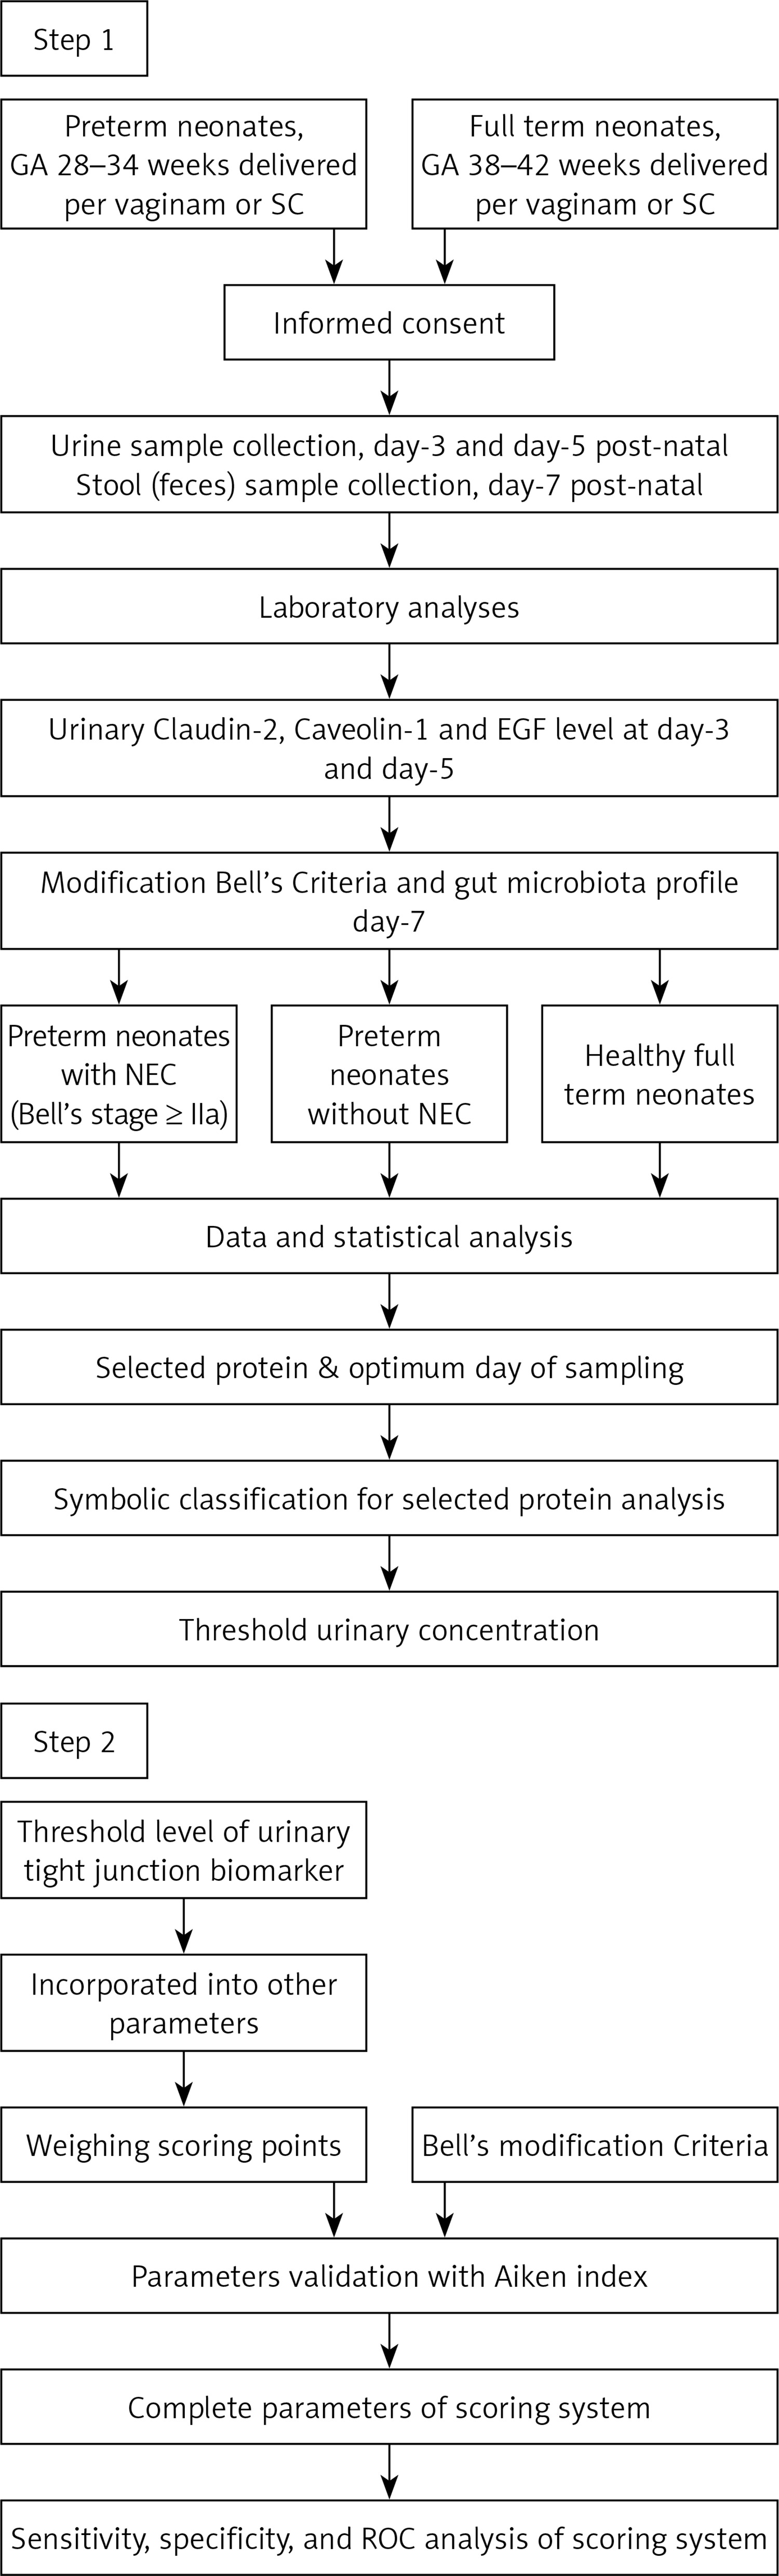
There were two steps in this study. The first step highlighted the correlation between the urinary levels of tight junction proteins, that is, claudin-2, caveolin-1, and EGF, and the risk of developing NEC, and then determined one urine parameter for further analysis. The second step highlighted the cutoff determination of urine biomarkers by symbolic classification, a machine-learning analysis using HeuristicLab 3.3 software [45]. The urinary biomarker was subsequently incorporated into a novel scoring system for the early diagnosis of NEC.
During the study period, the demographic, clinical, and laboratory parameters of all infants with NEC were compared to those of infants without NEC. A descriptive analysis was conducted to obtain the central tendencies of the cohorts; numeric variables were expressed in mean ± SD or median and interquartile range (IQR), while categorical variables were expressed in frequency and percentages.
In the first step, a one-way ANOVA or Kruskal-Wallis test was used to determine the differences between the urinary levels of claudin-2, caveolin-1, and EGF among the groups. The most significant biomarker identified in this study was then incorporated into a symbolic classification analysis to determine the optimum threshold of differentiation. The sensitivity and specificity of the selected biomarker prototypes were determined using receiver operating characteristic (ROC) curves. The statistical significance was set at p < 0.05.
In the second step, a scoring system was developed using one selected tight junction biomarker combined with clinical and laboratory parameters that have a strong relationship with the incidence of NEC in premature infants. Notably, the weighting was based on the Aiken index validation method involving two senior neonatologists and one pediatric surgeon from different academic hospitals. Any Yes answer indicated the existence of abnormalities based on the definition and was scored as a weighted value, whereas No = 0 (Supplementary Table SIII). The sum of each item’s scores was then analyzed. The analysis was carried out using SPSS 25.0 and HeuristicLab 3.3 software. A flowchart of the study is shown in Figure 1.
Results
Clinical characteristics of the cohorts
The final subjects who participated in this study included 34 neonates, comprising 12 preterm infants with NEC (Group A), 12 preterm infants without NEC (Group B), and 10 healthy term infants. Details of the participants’ flow diagrams are shown in Supplementary Figure S1. The clinical characteristics of the participants in each group are summarized in Table I. From a clinical perspective, the parameters that differed significantly between groups A, B, and C were gestational age (GA) and birthweight (BW). These two clinical parameters were interconnected; that is, the smaller the GA (preterm vs. term), the lower was the BW. APGAR scores at the 1st and 5th minute of life in the three groups were also significantly different; however, the APGAR scores between preterm groups A and B were not significantly different, that is, APGAR scores 1’ 5 (3–6) vs. 6 (4–7) (p = 0.233) and APGAR 5’ 7 (5–8) vs. 8 (6–9) (p = 0.433). The length of stay (LOS) and clinical outcomes differed significantly among the three groups, with group A (NEC) having the longest LOS and poorer clinical outcomes, correlated with the course of NEC. The types of nutrition, sex distribution, and singleton vs. twin status did not differ among the groups. The maternal clinical status and laboratory profile of the subjects at birth also showed non-significant differences, thus implying that the baseline status of each subject at birth was quite homogeneous.
Table I
Demographic and clinical characteristics of subjects at birth
| Parameter | Preterm with NEC (Group A) | Preterm without NEC (Group B) | Term neonates, control (Group C) | P-value |
|---|---|---|---|---|
| Total n = 34 (100%) | 12 (35.29%) | 12 (35.29%) | 10 (29.42%) | |
| Neonatal aspects: | ||||
| Gestational age [weeks] median, IQR | 30.8 (29.0–31.0) | 33.0 (31.0–35.0) | 37.5 (37.5–38.5) | < 0.001*a |
| Birthweight [g] mean ± SD) | 1428.67 ±347.95 | 1617.50 ±304.75 | 2918.80 ±278.71 | < 0.001*a |
| Birthweight criteria, n (%): | ||||
| VLBW (< 1500 g) | 9 (75.0) | 4 (33.3) | 0 | < 0.001*c |
| LBW (1500–2499 g) | 3 (25.0) | 8 (66.7) | 1 (10.0) | |
| Normal (2500–4000 g) | 0 | 0 | 9 (90.0) | |
| Sex, n (%): | ||||
| Male | 3 (25.0) | 3 (25.0) | 6 (60.0) | 0.151c |
| Female | 9 (75.0) | 9 (75.0) | 4 (40.0) | |
| Mode of delivery, n (%): | ||||
| Caesarian section | 10 (83.3) | 10 (83.3) | 6 (60.0) | 0.755c |
| Per vaginam | 2 (16.7) | 2 (16.7) | 4 (40.0) | |
| APGAR score at 1′ (median, IQR) | 5 (3–6) | 6 (4–7) | 7 (6–8) | 0.002*b |
| APGAR score at 5′ (median, IQR) | 7 (5–8) | 8 (6–9) | 9 (8.5–9) | 0.002*b |
| Downes score criteria of respiratory distress, n (%): | ||||
| ≥ 4 (distressed) | 9 (75.0) | 2 (16.7) | 0 | < 0.001*c |
| < 4 (mild or non-distressed) | 3 (25.0) | 10 (83.3) | 10 (100.0) | |
| Nutritional type, n (%): | ||||
| Exclusive breastfeeding | 10 (83.3) | 9 (75.0) | 8 (80.0) | 0.879c |
| Predominant breastfeeding | 2 (16.7) | 3 (25.0) | 2 (20.0) | |
| Singleton vs. Gemelli, n (%): | ||||
| Singleton | 8 (66.7) | 11 (91.7) | 10 (100.0) | 0.066c |
| Gemelli | 4 (33.3) | 1 (8.3) | 0 | |
| Clinical outcome, n (%): | ||||
| Death | 10 (83.3) | 1 (8.3) | 0 | < 0.001*c |
| Discharged | 2 (16.7) | 11 (91.7) | 10 (100.0) | |
| Length of stay [days] median, IQR | 15.5 (10.5–22.0) | 8.5 (5.75–11.25) | 3.0 (2.0–5.0) | 0.012*a |
| Laboratory profiles at birth (mean ± SD): | ||||
| Hemoglobin [g/dl] | 15.53 ±1.72 | 16.10 ±2.91 | N/E | 0.674d |
| Leukocyte count [cell/mm3] | 12 008 ±3475.8 | 11 441 ±9177.3 | 0.159d | |
| Platelet count [cell/mm3] | 233 333 ±68 854 | 223 000 ±58 475 | 0.771d | |
| Hematocrit (%) | 46.38 ±5.22 | 45.42 ±7.96 | 0.628d | |
| Absolute neutrophil count [cell/mm3] | 7 405 ±4084.1 | 6 476 ±6096.0 | 0.314d | |
| Immature/total neutrophil ratio | 0.07 ±0.1 | 0.32 ±0.77 | 0.582d | |
| C-reactive protein [mg/l] | 0.05 ±0.06 | 0.51 ±0.75 | 0.161d | |
| Random blood glucose [mg/dl] | 74.88 ±28.4 | 70.78 ±10.7 | 0.743d | |
| Maternal aspects: | ||||
| Maternal comorbidity, n (%): | ||||
| No comorbidity | 0 (0) | 2 (16.7) | 5 (50.0) | |
| PPROM, PROM | 6 (50.0) | 4 (33.3) | 2 (20.0) | 0.128c |
| Pre-eclampsia/Eclampsia | 1 (8.3) | 2 (16.7) | 2 (20.0) | |
| Antepartum bleeding | 1 (8.3) | 2 (16.7) | 1 (10.0) | |
| Others | 4 (33.3) | 2 (16.7) | 0 | |
| Maternal body mass index (BMI), n (%): | ||||
| < 18 or > 25 kg/m2 | 1 (8.3) | 0 | 0 | 0.389c |
| 18–25 kg/m2 | 11 (91.7) | 12 (100.0) | 12 (100.0) | |
| Prepartum antibiotic, n (%): | ||||
| Yes | 11 (91.7) | 10 (83.3) | 6 (60.0) | 0.412c |
| No | 1 (8.3) | 2 (16.7) | 4 (40.0) | |
| Passive smoker status, n (%): | ||||
| Yes | 4 (33.3) | 6 (50.0) | 2 (20.0) | 0.466c |
| No | 8 (66.7) | 6 (50.0) | 8 (80.0) | |
VLBW – very low birth weight infant, LBW – low birth weight infant, IQR – interquartile range (25th and 75th quartiles), NEC – necrotizing enterocolitis, PPROM – premature prelabor rupture of the membrane, PROM – premature rupture of the membrane, SD – standard deviation, NE – not evaluated since there was no clinical indication to invasively examine clinically stable infants.
Fold change gene expression of intestinal microbiota
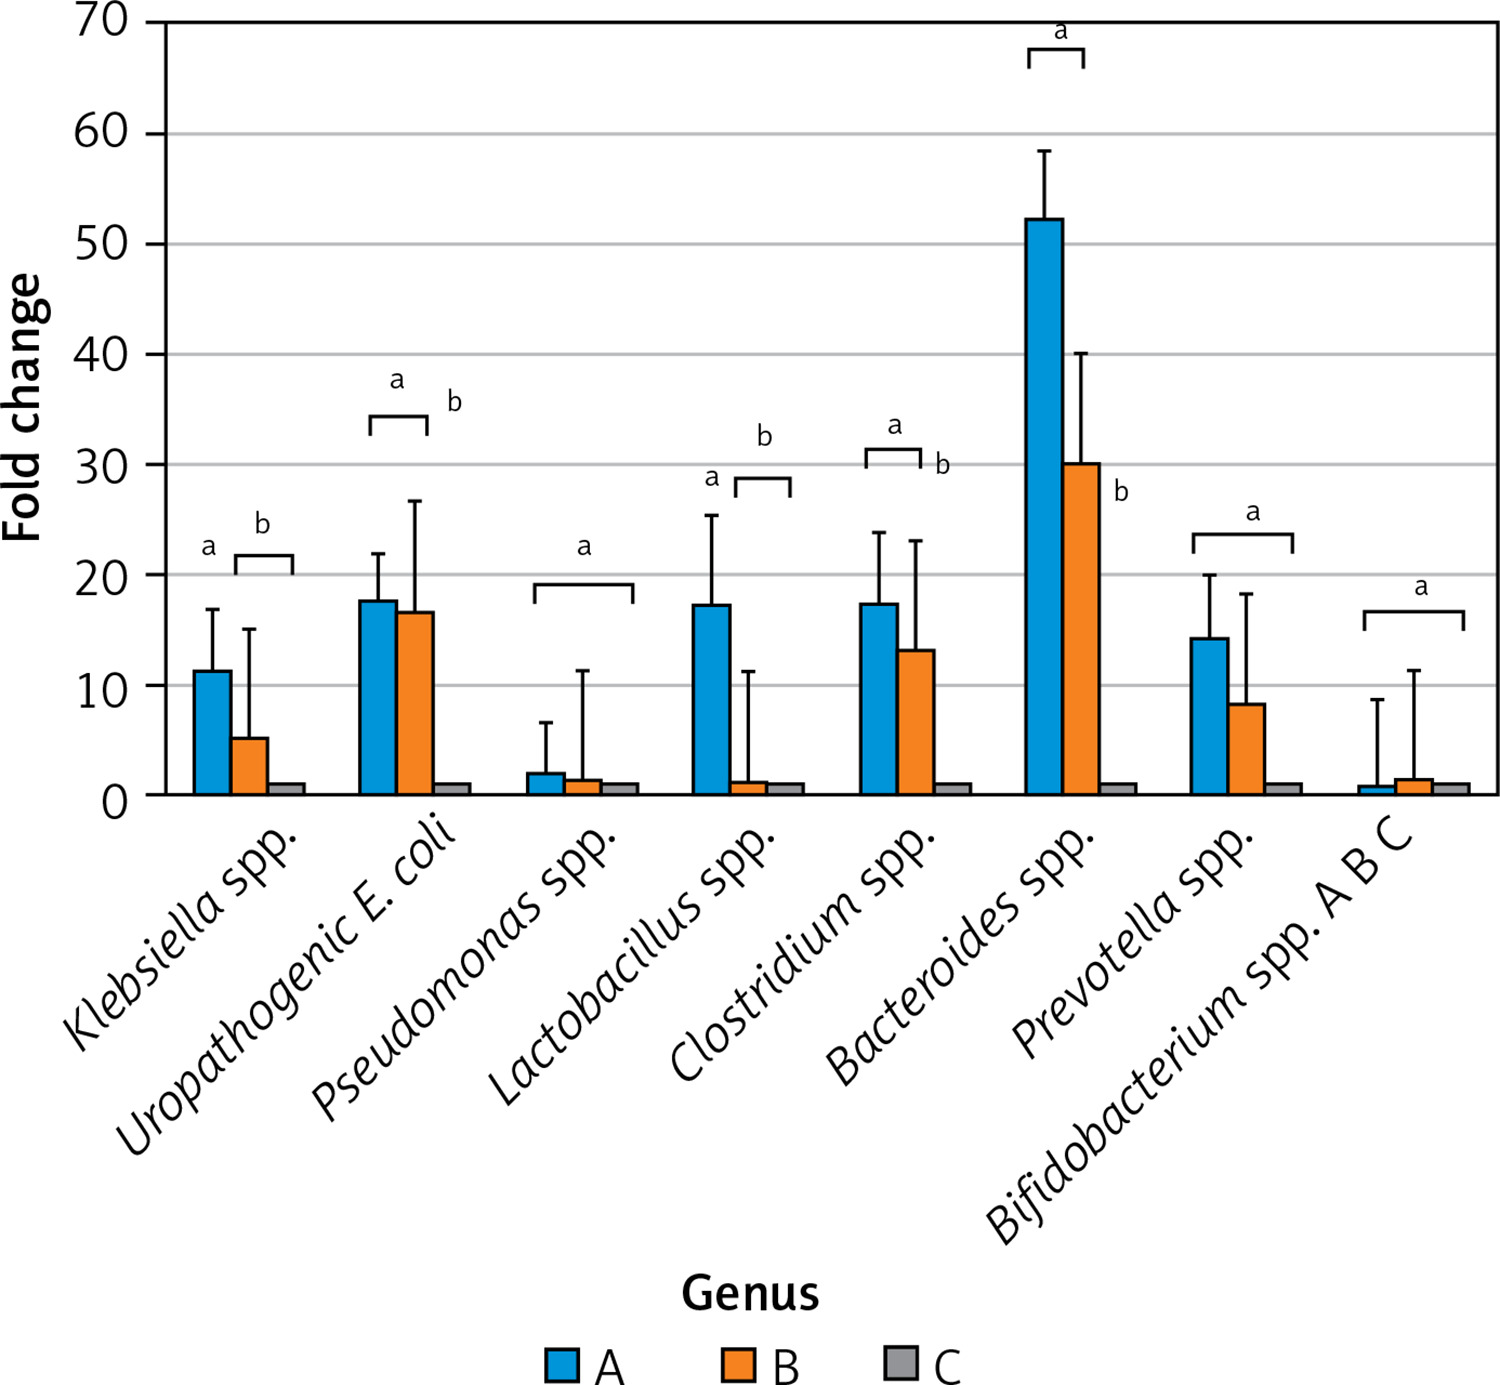
The fold change in gene expression of selected genera from the intestinal microbiota at day 7 of life between subjects is summarized in Figure 2. At the selected genus level, Group A (preterm with NEC) showed a significant increase in the fold changes of Klebsiella spp. (11-fold) and Lactobacillus spp. (17-fold) compared to the control. On the other hand, although there were no significant differences between Groups A and B, for Clostridium spp. and Bacteroides spp., these preterm groups showed significant differences in the fold change compared to the full-term control. These marked differences in the fold change of selected genera between the subject groups suggest a trend of gut microbiota dysbiosis.
Figure 2
Fold change gene expression of selected intestinal microbiota at day 7. Fold change in the gene expression of selected genera of intestinal microbiota at day 7 between subjects. Analyses were performed using a one-way ANOVA followed by Tukey’s post-hoc test. Different alphabetical notations indicate significant differences. For instance, the genera Prevotella and Bifidobacterium showed no significant differences between the three groups, as shown by the same notation, i.e. “a.” The bar colors are blue (group A, NEC), orange (group B, preterm non-NEC), and gray (group C, control)
Urinary tight junction biomarkers
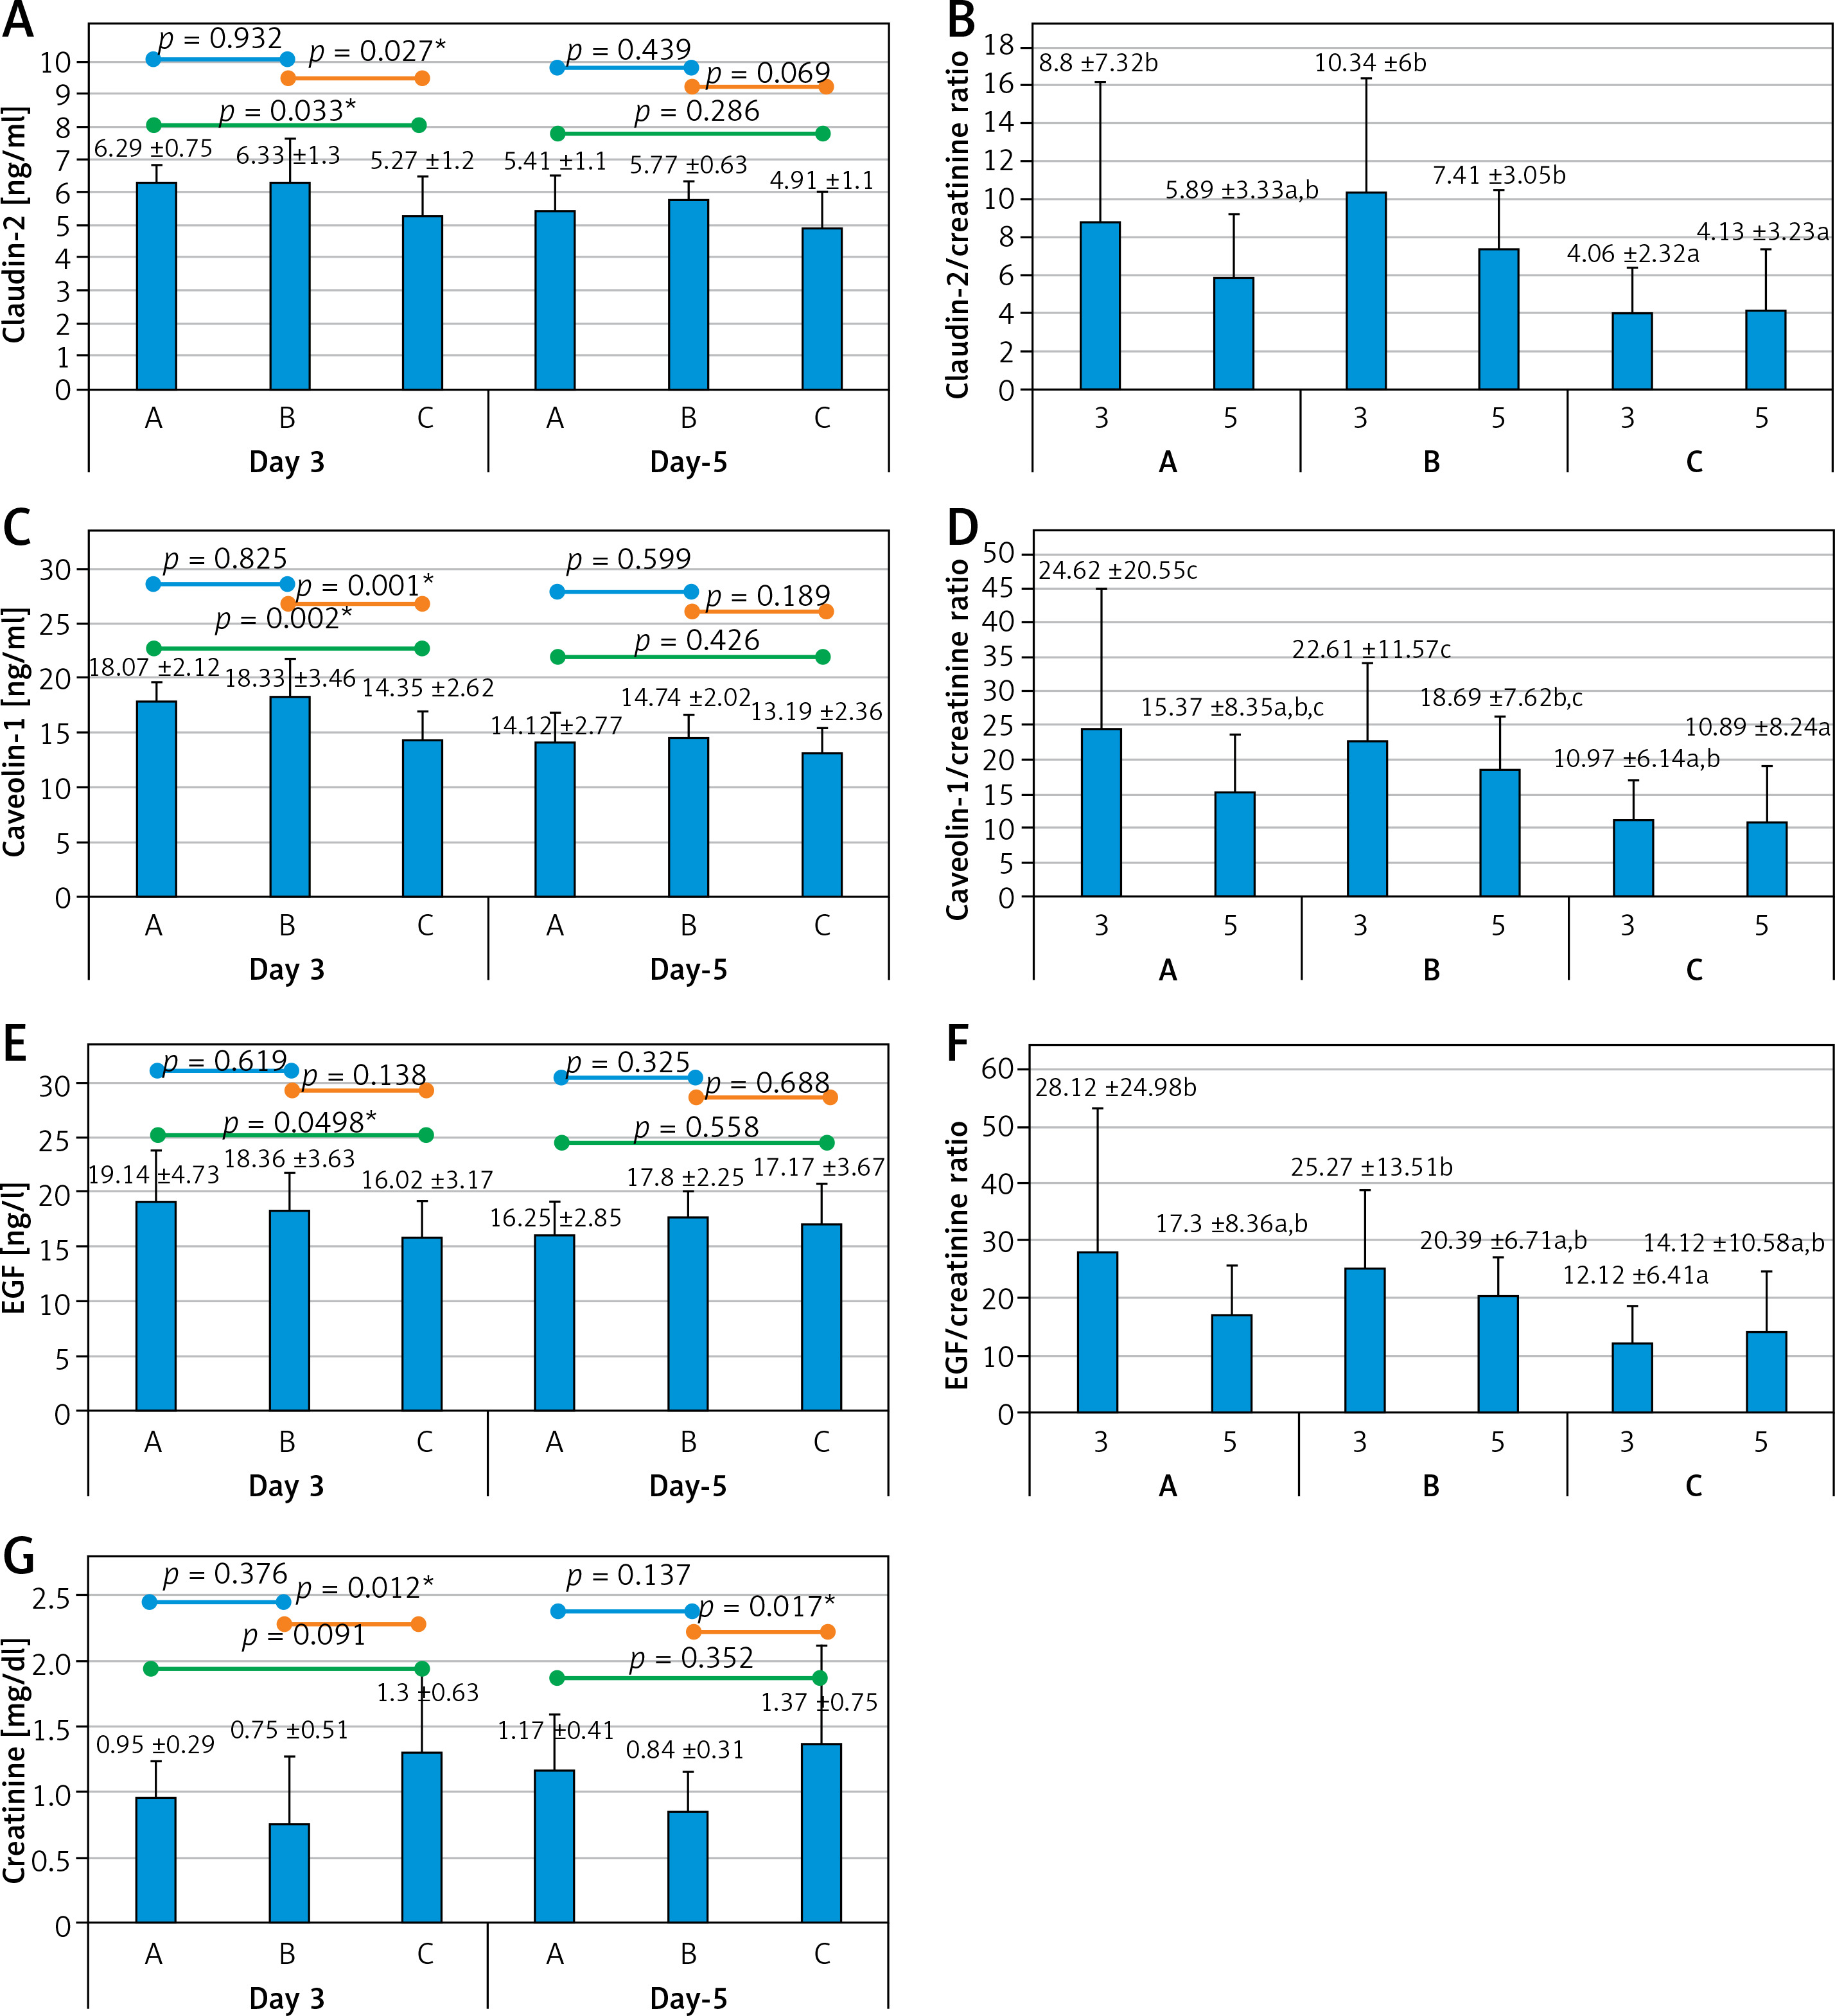
Figure 3 depicts absolute and normalized urinary concentration of tight junction disruption biomarkers, i.e. claudin-2, caveolin-1, and EGF. For claudin-2, the absolute urinary level (Figure 3 A) showed a significant difference at day 3 and could differentiate preterm infants (group A and B) from control infants, while normalized claudin-2 (Figure 3 B) showed a higher level of normalized claudin-2 in preterm non-NEC infants (Group B) although it could differentiate preterm infants from control infants. For caveolin-1, the absolute urinary level (Figure 3 C) showed significant differences at day 3 and could differentiate preterm infants (group A and B) from control infants, as normalized caveolin-1 (Figure 3 D). Normalized caveolin-1 showed a similar trend whereby group A had a higher level of caveolin-1 in both absolute level and normalization with creatinine. Both absolute and normalized EGF levels in our subjects showed no significant difference between groups. Therefore, the selected urinary biomarker of enterocyte tight junction disruption for further analysis was caveolin-1 at day 3.
Figure 3
Absolute and normalized urinary concentrations of tight junction disruption. Absolute urinary concentrations of claudin-2 (A), caveolin-1 (C), EGF (E), and creatinine (G). Normalized urinary concentrations of claudin-2 (B), caveolin-1 (D), and EGF (F) were expressed as biomarker/creatinine ratios. A, C, E, G were analyzed using oneway ANOVA, followed by post-hoc LSD 5% test; asterisks (*) indicate statistical significance, p < 0.05. B, D, and F were analyzed with a non-parametric Kruskal-Wallis test and Dunn 5% post-hoc test; different notations, i.e. “a” and “b”, indicate statistically significant differences. For instance, in Figure 2 D, the normalized urinary Group A’s caveolin-1 value on day 3 was significantly different compared with Group C’s caveolin-1 value on day 3, indicated by different alphabetical notations; however, no difference was detected between the caveolin-1 value of Group A and B on day 3 (they have the same alphabetical notation)
Caveolin-1 threshold determination with symbolic classification
Symbolic classification was performed to determine the classification threshold for urinary caveolin-1 on day 3. Computational modeling with symbolic classification yielded the performance scores summarized in Table II. The performance measure showed an F1 score of 0.836, which was close to 1, indicating that the obtained model had a high level of accuracy in classifying NEC events. Similarly, when viewed from the positive predictive value (PPV) and negative predictive value (NPV) performance coefficients, the training data showed accuracies of 87.5% and 72.86%, respectively. This finding indicates that the model was good at distinguishing neonates positive for NEC from those who were not. Figure 4 shows a visual true-positive rate of 26.92% and a high true-negative rate of 98.08%. This model showed that caveolin-1 has excellent potential for discriminating true-negative NEC events. Furthermore, the classification threshold for the discrimination of NEC and non-NEC cases was found to be caveolin-1 ≥ 17.81 ng/ml.
Table II
Performance measure score model of symbolic classification
| Performance measure | Score |
|---|---|
| F1 score | 0.836 |
| False discovery rate | 12.50% |
| False positive rate | 1.92% |
| Matthews correlation | 0.388 |
| NPV | 72.86% |
| PPV | 87.50% |
| True negative rate | 98.08% |
| True positive rate | 26.92% |
Figure 4
Classification threshold to classify NEC events. Orange (•) and blue dots indicate NEC and non-NEC cases, while blue (▪) dots indicate non-NEC samples. The red line shows the classification threshold based on the caveolin-1 level on day 3, which was found to be ≥ 17.81 ng/ml. There is no blue dot crossing the red line, indicating that caveolin-1 had a high true-negative rate, whereas it showed a lower true-positive rate (orange dots above the threshold line). Analysis was conducted by symbolic classification
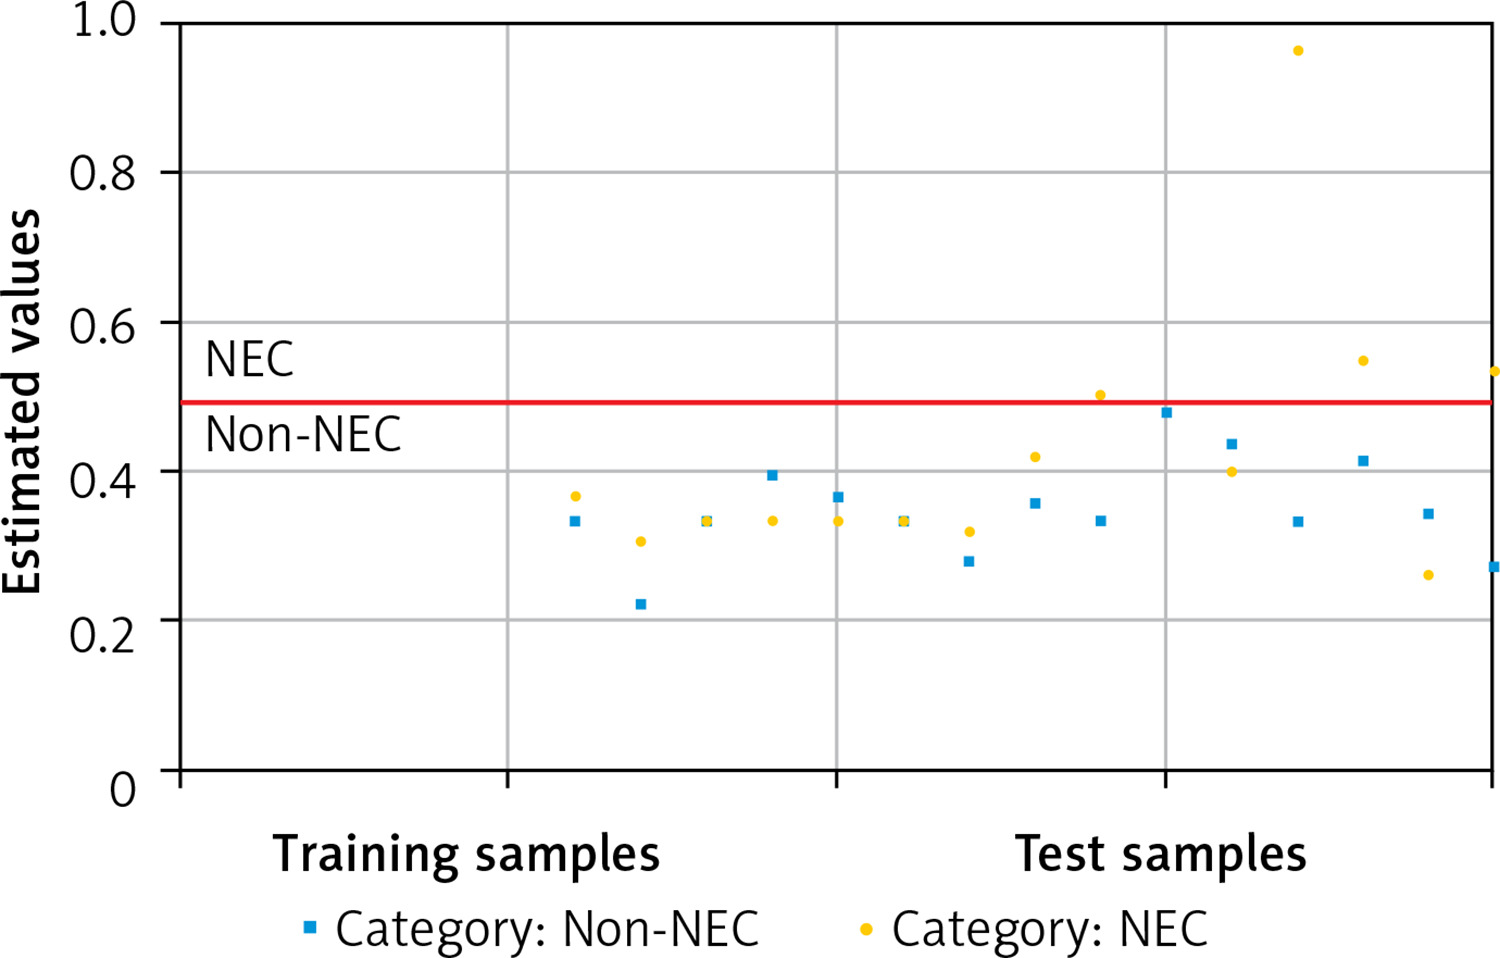
Furthermore, sensitivity and specificity tests were performed for a caveolin-1 cut-off ≥ 17.81 ng/ml on day 3 using SPSS cross-tabulation. The results showed a sensitivity of 87.5%, a specificity of 75.0%, and an accuracy of 79.17%.
Early NEC scoring system development
Early NEC scoring was performed by combining the clinical and laboratory parameters based on Bell’s modified criteria and previous studies, adding urinary caveolin-1 (day 3). The parameter definitions used in the new scoring system are summarized in Supplementary Table SIII. The final weighting matrices for each parameter, validated using the Aiken index, are summarized in Table III. Any Yes answer indicated the existence of abnormalities based on the definition and was scored as a weighted value, while No = 0. The sum of each item’s scores was then analyzed.
Table III
Final weighing matrix for each parameter
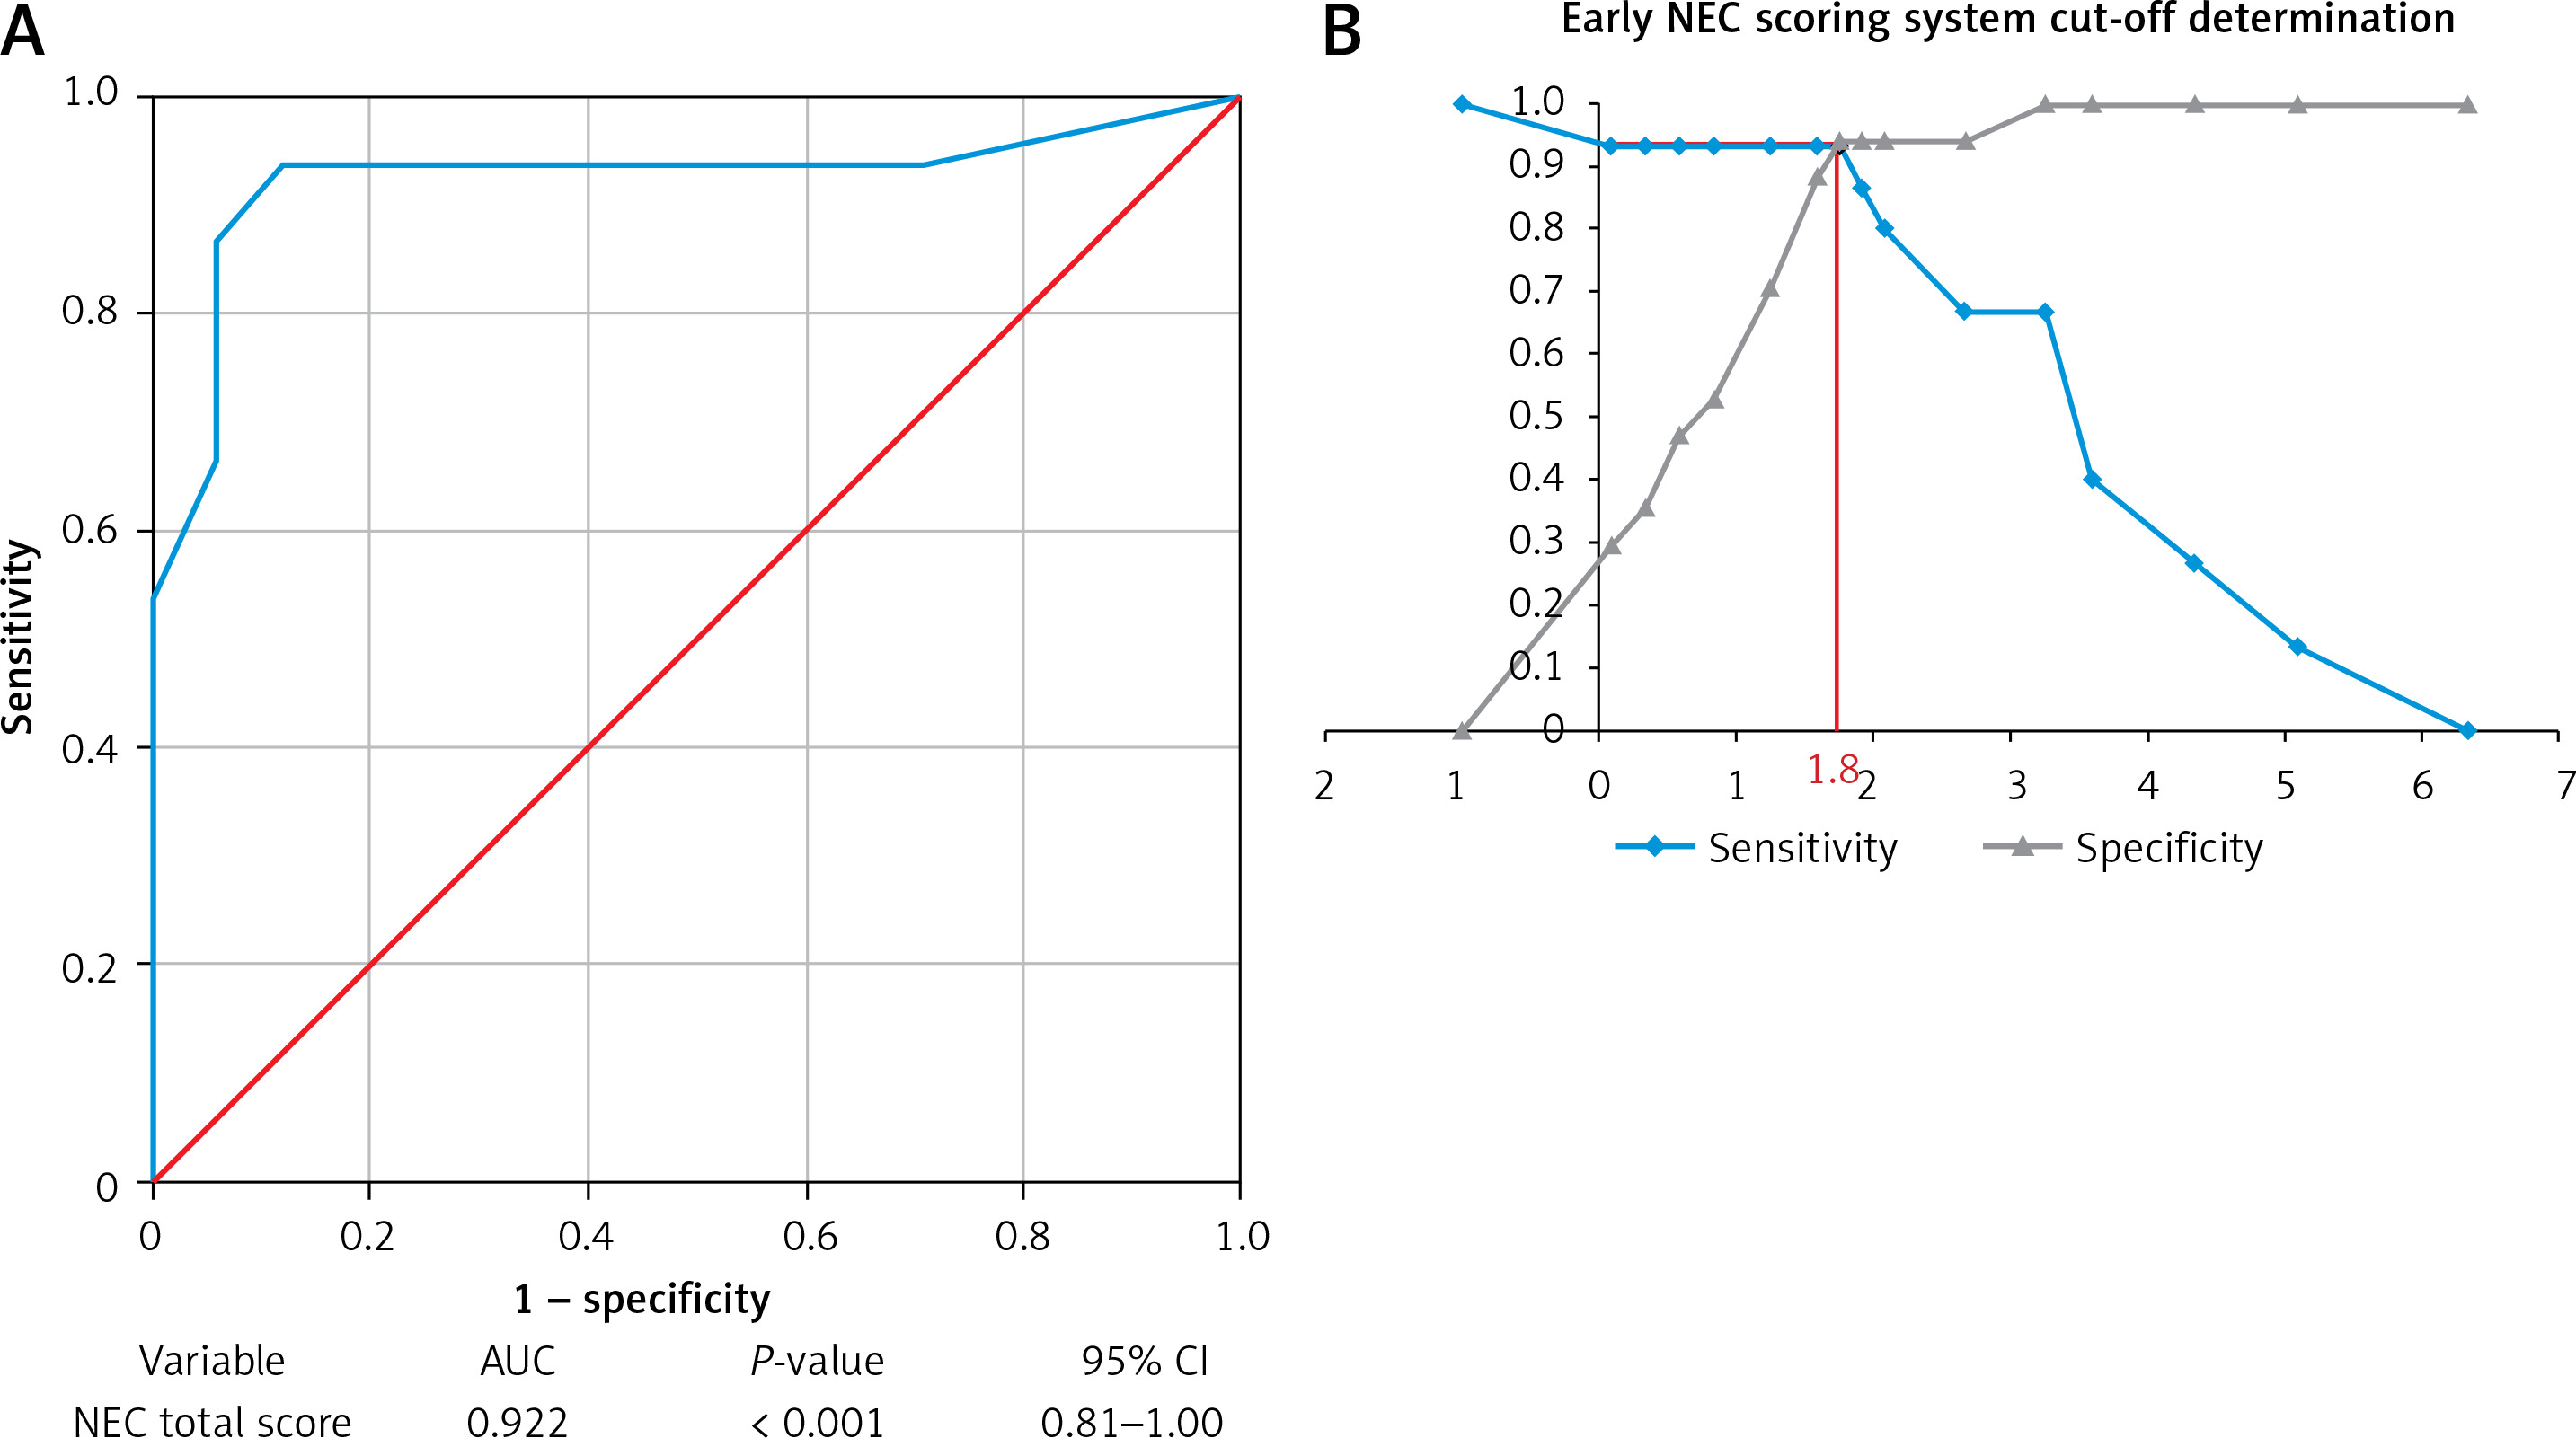
For each weighted value closer to 1.0, a higher priority level was indicated. To determine the cutoff value of the NEC scoring results using a total score of 10 questions, we performed ROC curve analysis (Figure 5 A). A p-value < 0.05 indicated that the developed NEC scoring system was suitable for predicting NEC events. Figure 5 B emphasizes the intersection point where a score of 1.8 obtained an optimum sensitivity of 0.93 (93%) and a specificity of 0.94 (94%). Finally, we compared the findings of this study with those of other NEC criteria [30, 46] based on specificity and sensitivity, as summarized in Table IV.
Table IV
Comparison of sensitivity and specify of NEC criteria from previous studies
| Variable | Modified Bell’s criteria | Gut microbiota dysbiosis | Urinary caveolin-1 at day 3 ≥ 17.81 ng/dl | Novel scoring system (selected parameters from Bell’s criteria + caveolin-1). Total score ≥ 1.81 |
|---|---|---|---|---|
| Sensitivity | 70.6% | 44% | 87.5% | 93.0% |
| Specificity | 40.0% | 100% | 75.0% | 94.0% |
| Reference | (Lueschow et al., 2022) [30] | (Morrow et al., 2013) [46] | This study | This study |
Figure 5
ROC curve, AUC and cutoff determination for early NEC scoring system. A – ROC curve with respective AUC, p-value, and 95% CI. B – Cutoff determination for early NEC detection showed an intersection and a total score of 1.8
NEC – necrotizing enterocolitis, ROC – receiver operating characteristic curve, AUC – area under the ROC curve, CI – confidence interval.
Discussion
Necrotizing enterocolitis is an acute inflammatory, multifactorial disease of intestinal injury, and necrosis that primarily affects preterm infants and is a leading cause of morbidity and mortality [1]. Despite the modern advances in intensive neonatal care, the NEC mortality rate remains high, with rates reported to be between 18% and 63% [6–8]. There is no gold standard test for the diagnosis of necrotizing enterocolitis (NEC), and identifying infants at disease onset remains challenging. Due to the multifactorial nature of NEC, its clinical manifestations are nonspecific and overlap with those of other diseases of gastrointestinal origin [47]. Therefore, developing an early diagnostic system for NEC is still a vast area of investigation encouraged to be explored.
There are several limitations of the Bell criteria, NEC diagnostic criteria widely used for over three decades, especially in detecting the acute phase of NEC. Most cases of NEC occur after 2–4 weeks of life; however, the pathogenic process of this disease occurs earlier, within the first week of life [48]. Thus, early detection of NEC would improve care and treatment. Therefore, it is necessary to improve Bell’s criteria by combining sensitive and specific laboratory parameters that can detect the acute phase of NEC.
In this study, the trend of microbiota dysbiosis in the NEC group was significant, confirming that microbiota dysbiosis is one of the specific signs of NEC. This study showed a marked increase in Klebsiella spp. and Lactobacillus spp. in the NEC group (group A) compared to the non-NEC groups (groups B and C). Although there was no significant difference in Clostridium spp. and Bacteroides spp. in both preterm groups, groups A and B showed significant differences in the fold change compared to the control. A previous study demonstrated that an increase in Klebsiella spp. in the microbiome of preterm infants was associated with elevated levels of human β-defensin 2 and correlated with a significantly higher inflammatory response within the gut mucosal microenvironment [49]. Other studies have shown that preterm infants experience a delay in the establishment of beneficial anaerobic bacteria, in contrast to full-term infants. GA has been suggested to be a crucial factor influencing the development of the gut microbiota in premature infants [50]. Prematurity is thought to contribute to a delay in the establishment of a mature microbiota that resembles that of adults. This idea is supported by the observation that full-term neonates, whose gut microbiota is more similar to that of adults, have a significantly lower incidence of NEC [32, 51, 52].
However, there is no definite number or exact ratio at which taxonomic-level dysbiosis occurs, and there is no literature that definitively determines the exact cut-off for dysbiosis. This is due to the dynamic nature of the composition of the neonatal gut microbiota, making the study results variable; the same dysbiosis trend may provide a different cut-off [53–55]. On the other hand, colonization of the neonatal gut microbiota is influenced by various factors, such as gestational age, maternal diet, mode of delivery, genetics, environment, and nutrition. Therefore, it was difficult to determine a definite dysbiosis threshold value.
The urinary caveolin-1 levels in both preterm groups were generally higher than those in the full-term group, both in terms of absolute caveolin-1 levels and when normalized to creatinine levels. Caveolin-1 is a protein found in tight junction membrane microdomains of gastrointestinal cells. It plays a role in regulating the signaling of various growth factor receptors and the process of endocytosis of tight junction proteins [27]. Additionally, caveolin-1 is involved in mediating the paracellular permeability of the gastrointestinal tract in response to pro-inflammatory cytokines in vivo [29]. This was an early study involving human subjects from the preterm population with and without NEC, showing that caveolin-1 levels were significantly different in the preterm NEC group from the term group, particularly on day 3 of the study.
This NEC scoring system was developed to make it easier for neonatologists to diagnose NEC earlier. However, NEC could not be established with a single biomarker because of the complexity of the disease course and manifestations [20, 56]. For this reason, this scoring system incorporated noninvasive caveolin-1 biomarkers and clinical parameters based on previous studies.
Based on the expert validity test using the Aiken index, the parameters that were considered high priority (high weighting) were abdominal cellulitis and plain abdominal radiography findings in the form of pneumatosis intestinalis, portal venous gas, or pneumoperitoneum. This is in agreement with previous studies, both based on Bell’s criteria and confirmed by more recent studies by Fox et al. (2015) and Khalak et al. (2018). Other combined clinical parameters are emesis and residue, abdominal circumference, and platelet count [1, 13, 57, 58].
What distinguished this scoring system from previous studies was the weighting of each criterion so that more specific parameters, such as pneumatosis and abdominal cellulitis, and objective biomarkers, such as caveolin-1, on day 3 would have a higher score. In contrast, parameters that were less specific, such as those that often overlap with other pathologies, for example sepsis, thrombocytopenia, and metabolic acidosis, would have a lower score. Considering the weighting of each score, 2 patients with the same initial number of points (e.g., 3 out of 10 points) would have different final scores depending on the weighting of the assessment items.
The limitations of this study are its single-center design and relatively small sample size. Further investigation is encouraged to validate this scoring system with the biomarker urinary caveolin-1 on day 3, in an independent validation cohort with a larger number of subjects and multiple centers. Due to the relatively non-invasive nature of this study, further studies are encouraged to assess the validity of this NEC scoring system in a group of patients with congenital abnormalities, which was not performed in this study.
In conclusion, to the best of our knowledge, this is the first study to develop a comprehensive and prospective NEC early detection scoring system in human subjects. This study showed that the concentration of a urine biomarker of tight junction damage, caveolin-1 on day 3, was significantly higher in the preterm group with NEC than in the term and preterm non-NEC groups. These findings suggest that the biomarker caveolin-1 on day 3 is a potential marker of enterocyte tight junction damage and acute-phase NEC in premature infants. An NEC early diagnosis scoring system developed with a combination of clinical and laboratory data with urine caveolin-1 parameters showed good performance in predicting the incidence of NEC in premature infants. This novel approach presents a potential breakthrough in the early detection of NEC, offering the prospect of timely interventions and improved neonatal outcomes.