In evaluating the nephrotoxicity of amphotericin B lipid complex (ABE, Abelcet™) vs. liposomal amphotericin B (AMB, Ambisome™), Tonin et al. [1] examined 2 randomised studies published between 2000 and 2001 and found a higher toxicity with ABE (OR = 3.00, 95% confidence interval (CI) = 1.65–5.45) compared with AMB. On the other hand, Subirà et al. [2] found a lower nephrotoxicity with ABE than with conventional amphotericin B (FUN, Fungizone™) (OR = 0.188, 95% CI: 0.058–0.602) [2]. Finally, the meta-analysis of Botero Aguirre et al. [3] showed less nephrotoxicity with AMB compared with FUN (OR = 0.383, 95% CI: 0.299–0.491, 10 randomised trials, Analysis 1.1).
Trial-sequential analysis (TSA) is an original statistical technique [4] that improves the interpretation of a series of randomised trials by demonstrating that the overall evidence is conclusive (and so no further trials are needed). Likewise, when positive evidence cannot be conclusively demonstrated, TSA conclusively demonstrates the proof of no difference (namely: “futility” when controls receive no active treatment or “equivalence” when controls receive an active treatment), which is a more informative result than no proof of difference. Each meta-analysis can in fact be classified by TSA into four categories (superiority, inferiority, futility/proof of no difference, or inconclusive result). Notably, TSA adopts more conservative thresholds than standard meta-analysis in demonstrating superiority or inferiority or futility/proof of no difference.
We applied TSA to re-examine the 14 randomised studies evaluated in the two meta-analyses [1, 3]. Our TSA considered the endpoint of nephrotoxicity as previously defined [1, 3]. The main assumptions of our analysis included two-sided testing, risk of type 1 error at 5%, and power at 80%.
Two comparisons were examined (AMB vs. FUN and ABE vs. AMB). In comparing AMB vs. FUN, the intervention effect according to the pre-specified endpoint was set at an event frequency of 26.1% for controls (equal to the meta-analytical event frequency of the 10 control groups) and relative risk reduction of 19.2% (according to the program’s estimate). In the comparison between ABE vs. AMB, the intervention effect was set at an event frequency of 18.8% with relative risk reduction of 50%.
As usual, the main result of TSA was expressed through a cumulative z-curve graph [4]. In this graph, the boundaries for concluding superiority or inferiority or futility were calculated according to the O’Brien-Fleming a-spending function. All our analyses employed the statistical software developed by the Copenhagen Trial Unit (TSA software, 2011; downloadable at www.ctu.dk/tsa).
After excluding duplicate entries, a total of 12 studies were included in our analysis. These trials enrolled patients with diagnosis of fungal infection and patients with documented or suspected neutropaenia (absolute neutrophil count < 500 cells/mmł). Antifungal treatment consisted of FUN, AMB, or ABE administered intravenously. The dosages of FUN, AMB, and ABE were consistent with approved regimens and were similar but not the same across the 12 studies. Nephrotoxicity was defined as a two-fold or more increase over baseline levels of creatinine and/or an increase exceeding the upper normal limit by more than 1.4 mg/dl.
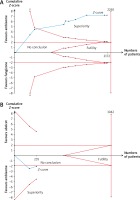
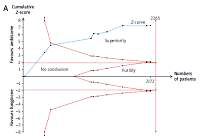
Figures 1 A and B shows the results of our TSAs. In comparing AMB vs. FUN (Figure 1 A), the analysis of the 10 randomised studies indicated that AMB was less nephrotoxic than FUN; this result was conclusive because the z-curve crossed the boundary estimated by the analysis.
Figure 1
The graph shows 2 trial sequential analyses based on the endpoint of nephrotoxicity. In Panel A, amphotericin B (AMB) determines less nephrotoxicity than conventional amphotericin B because the z-curve crosses the boundary of superiority (10 trials, N = 2172) and is close to the optimal sample size of 2265 patients. In Panel B, the clinical evidence for the comparison of amphotericin B lipid complex (ABE) vs. AMB is limited and does not allow any conclusion to be drawn; the number of patients enrolled in the included trials is much lower (2 trials; N = 235) than the optimal sample size (N = 1042); the z-curve does not cross the boundary of superiority and remains distant from the boundaries of futility/proof of no difference

In the comparison between ABE and AMB (Figure 1 B), the analysis of the 2 randomised studies indicated no proof of difference; more interestingly, the z-curve summarising the evidence from these 2 trials remained far from the boundaries of superiority and futility/equivalence. This indicates that neither superiority nor equivalence were conclusively demonstrated. Therefore, one cannot draw any conclusion about this comparison because further trials would be needed for a total of 1042 patients compared with the 235 enrolled in the available trials.
According to the same meta-analysis, the OR in the single available trial comparing ABE vs. FUN (published by Subirà et al. [2]) was 0.188 (95% CI: 0.058–0.602), thus favouring the former over the latter. Also, in this case, the TSA indicated that the information was not conclusive (graph not shown) because 460 patients would be needed in comparison with the actual number of 105 patients (based on heterogeneity of 50% and relative risk reduction of 50%).
In recent years, no comparative clinical studies have been conducted to re-evaluate the place in therapy of the three most commonly used formulations of amphotericin B (i.e. FUN, ABE, and AMB). Nephrotoxicity is an important factor in selecting a formulation for hospital use because AMB is less nephrotoxic than FUN, but its cost is much higher. For this reason, ABE is quite frequently proposed as a compromise between the excessive cost of AMB and the high nephrotoxicity of FUN because ABE is midway under both aspects. On the other hand, TSA is increasingly recognised as a useful tool for interpreting borderline results provided by meta-analysis [5–7].
Table I summarises how the overall results of our TSA can be interpreted. The main question regards the comparison between ABE and AMB, the results of which are not conclusive. Similarly, enough information is not available regarding the comparison between ABE and FUN, which is supported by just a single trial.
Table I
Synthesis of our results
In conclusion, ABE has the potential to reduce nephrotoxicity as compared with FUN and could also have a similar nephrotoxicity in comparison with AMB based on indirect comparisons [8]. However, these potential advantages of ABE are not supported by sufficient evidence and hence further trials are still needed, particularly about the nephrotoxicity of ABE vs. AMB.


