Introduction
Gastric cancer (GC) is one of the most common malignant tumors in the digestive system, and is associated with high morbidity and mortality [1]. The prognosis of locally advanced GC is poor: 5-year survival remains in the 30–50% range despite the combined efforts of surgical resection, adjuvant chemotherapy and/or radiotherapy [2]. Therefore, there is an unmet need to develop novel therapeutic strategies to improve the outcome of GC.
MicroRNAs are a class of small non-coding RNAs, which possess various functions involving the regulation of apoptosis, proliferation, and autophagy [3–6]. MiR-26b (gene ID: 31612) belongs to the miR-26 family. It has been found to be down-regulated in a variety of malignant tumors, including hepatocellular carcinoma, ovarian carcinoma and prostate cancer [7–9]. It has been hypothesized that miR-26b functions as a tumor suppressor gene in regulating apoptosis, cell differentiation, invasion, and radiosensitivity, likely by silencing its target genes [7–10]. However, little is known about the expression and functions of miR-26b in GC. In this study, we found that expression of miR-26b was downregulated in GC, and overexpression of miR-26b inhibited growth and resistance to paclitaxel chemotherapy by silencing the CDC6 gene in the gastric cancer cell line SGC7901. The findings may shed light on developing a potential novel therapeutic target of GC.
Material and methods
Cell culture
The human normal gastric epithelial cell line GES-1, GC cell lines BGC823 and SGC7901 and HEK293T cells were obtained from China Academy of Chinese Medical Sciences. The human GC SGC7901/PA cell line (resistance to paclitaxel) was obtained from the Fourth Military Medical University (Xi’an, Shanxi, China). These cells were cultured in RPMI-1640 medium containing 10% fetal bovine serum (Gibco, Carlsbad, CA, USA), and cultured with 5% CO2 at 37°C. In order to maintain the sensitivity phenotype, SGC7901/PA cells was cultured with 20 μg/l paclitaxel (Gibco, Carlsbad, CA, USA), and cultured in paclitaxel-free medium for 14 days prior to the experiment.
Quantitative real-time PCR (qRT-PCR)
Total RNA was extracted with Trizol reagent and cDNA was synthesized with the High Capacity cDNA Reverse Transcription Kit (Applied Biosystems, Foster City, CA, USA). The RNA expression levels of miR-26b and cell division cycle 6 (CDC6) were quantified by SYBR (Applied Biosystems, Foster City, CA, USA). The primers for CDC6 were 5’-AACCACTGTCTGAATGTAAATC-3’ (forward) and 5’-CTGTTACCATCAACTTCTGAG-3’ (reverse). GAPDH and U6 were used as endogenous reference genes [11].
MicroRNA targets prediction and dual-luciferase reporter assay
Target genes of miR-26b were predicted by miRanda (http://www.microrna.org) and TargetScan (http://www.targetscan.org). The wild-type and mutant-type luciferase reporter vectors (pmiR-CDC6-wt and pmiR-CDC6-mut), constructed by the Genescript company (Nanjing, China), included the wild-type binding site and mutant binding site of CDC6 3’UTR. MiR-26b agonist (agomiR-26b) or negative control agonist (agomiR-NC) were synthesized by the Ribobio company (Guangzhou, China). AgomiR-26b is a chemically synthesized miRNA mimic, which was used to mimic the overexpression of miR-26b [12]. MicroRNA and luciferase reporter vector were cotransfected into HEK 293T cells. Luciferase reporter assay was performed as previously reported [13].
Western blot
Protein samples were extracted from cells and separated by polyacrylamide gel electrophoresis, transferred to PVDF membrane. The membrane was hybridized with CDC6 antibody (ab155759, Abcam, Cambridge, MA, USA) followed by secondary antibody. BeyoECL Plus reagent (Beyotime, Nanjing, China) was used to visualize the immunoblots, and the images were analyzed by ImageJ software (BD, Franklin Lakes, NJ, USA) to quantify the expression of CDC6 protein.
RNA interference
We designed RNAi vectors with three different targeting sites (pSilencer, ThermoFisher, Foster City, CA, USA). The vectors were constructed by Sangon Company (Shanghai, China). All three RNAi vectors were tested for the inhibition of the expression of CDC6. The vector that showed the best inhibitive effect was chosen for our experiment. The sequences of the nucleotides used for this vector were: 5’-GATCCCCCACTCTCCGAATGTAAA-TCTTCAAGAGAGATTTACATTCGGAGAGTGTTTTTT -3’ (sense) and 5’-AGCTAAAAAACACTCTCCGAATGTAAATCTCTCTTGAAGATTTACATTCGGAGAGTGGGG-3’ (antisense). An empty pSilencer vector was used as a control (pS-NC).
Cell proliferation and chemotherapy resistance assay
Cellular proliferation was evaluated by MTT assay according to our previous study [14]. Cells were seeded into 96-well plates with 3000 cells per well and treated with paclitaxel (10 μg/l, 25 μg/l, 50 μg/l, 100 μg/l and 200 μg/l) [15]. After 48 h, the cellular viability was measured, and a dose-response curve was drawn to calculate the half maximal inhibitory concentration (IC50) using a Probit regression model.
Cell invasion assay
Cell invasion was measured using a Transwell chamber (Costar, Corning, NY, USA) with polycarbonic membrane (6.5 mm in diameter, 8 μm pore size) and Matrigel (BD, NJ, USA) as previously reported [16].
Results
The expression of miR-26b was down-regulated in GC cells
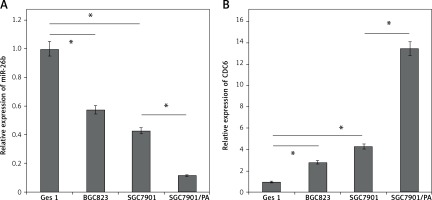
By using qRT-PCR, the miR-26b expression levels were found to be significantly lower in two independent GC cancer cell lines, BGC823 and SGC7901, compared to that in GES1 cells. In addition, the expression level of miR-26b was lower in SGC7901/PA cells than that in SGC7901 cells (p < 0.05, Figure 1 A). These findings suggest that miR-26b may play a role in tumorigenesis and chemotherapy resistance of GC.
MiR-26b functionally targets CDC6 in GC cell lines
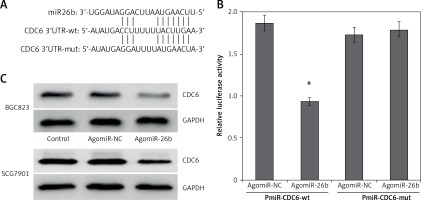
By using bioinformatics software, both TargetScan and miRanda identified a conserved miR-26b binding sites in the 3′-UTRs of CDC6 at the position of 109–115 bp (Figure 2 A).
Figure 2
CDC6 is a target gene of miR-26b. A – 3’-UTR region of CDC6 mRNA is partially complementary to miR-26b. B – The relative luciferase activities in cells co-transfected with pmiR-CDC6-wt and agomiR-26b vs. control vector. Firefly luciferase activity was normalized to Renilla luciferase. C – Transfection of agomiR-26b suppressed the CDC6 protein level in BGC823 and SGC7901 cells. *P < 0.05

Consistent with the downregulated miR-26b level, CDC6 was highly expressed both in BGC823 and SGC7901 cells, in sharp contrast with GES1 cells. In addition, the expression of CDC6 was even higher in SGC7901/PA cells (Figure 1 B). By Pearson’s correlation analysis, a negative correlation was identified between miR-26b and CDC6 (p < 0.05).
We next used luciferase reporter assay to investigate whether CDC6 is a direct target of miR-26b. Compared to NC, the relative luciferase activity was significantly lower in HEK293T cells co-transfected with wild-type luciferase vector and agomiR-26b (p < 0.05) (Figure 2 B). These results suggest that miR-26b specifically binds the 3’UTR of the CDC6 gene to inhibit its expression. This was further confirmed by western blot at the protein level: CDC6 levels were significant lower in BGC823 and SGC7901 cells transfected with agomiR-26b (Figure 2 C). Taken together, the findings confirm that miR-26b negatively regulates endogenous CDC6 expression.
CDC6 knockdown inhibited the growth and invasion of GC cells
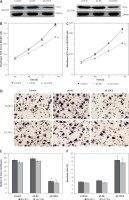
To ascertain whether CDC6 knockdown may affect the cell growth of GC, we first established BGC823 and SGC7901 cells overexpressing the silencing vector pS-CDC6, and confirmed that the expression levels of CDC6 protein were significantly lower, compared to cells transfected with control vectors (p < 0.05, Figure 3 A).
Figure 3
CDC6 knockdown inhibits the growth of GC cells. A – Transfection of pS-CDC6 knocked down CDC6 expression in BGC823 and SGC7901 cells. B, C – CDC6 knockdown significantly inhibited cellular proliferation of BGC283 (B) and SGC7901 (C) cells. D, E – CDC6 knockdown inhibited invasion of BGC283 and SGC7901 cells. F – CDC6 knockdown promoted cell apoptosis of BGC283 and SGC7901 cells. *P < 0.05

As shown in Figure 3 B and C, CDC6 knockdown inhibited cellular viability of both BGC823 and SGC7901 cells (p < 0.05). By using Transwell assay, we further found that CDC6 knockdown in BGC823 and SGC7901 cells significantly inhibited cell invasion (Figure 3 D, p < 0.05). This likely was due to increased apoptosis in these cells, as shown in Figure 3 E (p < 0.05).
CDC6 knockdown inhibited resistance to paclitaxel chemotherapy in SGC7901/PA cells
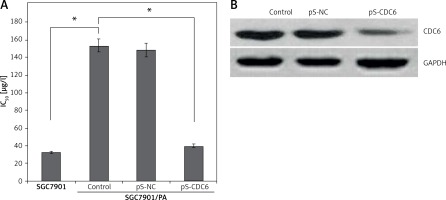
Paclitaxel is widely used in patients with advanced GC. The half maximal inhibitory concentrations (IC50) of paclitaxel in SGC7901 and SGC7901/PA cells were 32.64 ±0.25 μg/l and 153.17 ±0.49 μg/l, respectively; the calculated resistance index (RI) was 4.69. SGC7901 cells were significantly more sensitive to paclitaxel (p < 0.05, Figure 4 A). The expression of CDC6 was silenced in SGC7901/PA cells by transfecting pS-CDC6 (p < 0.05, Figure 4 B). This led to increased IC50 of paclitaxel from 153.17 ±0.49 μg/l to 39.81 ±0.28 μg/l (p < 0.05, Figure 4 A). The results suggest that silencing of CDC6 inhibited resistance to paclitaxel chemotherapy.
Figure 4
CDC6 knockdown inhibited resistance to paclitaxel chemotherapy in SGC7901/PA cells. A – The paclitaxel concentration of 50% inhibition of cell growth (IC50) of SGC7901/PA cells was higher than that in SGC7901 cells, CDC6 silence decreased IC50 of paclitaxel in SGC7901/PA cells. B – Transfection of pS-CDC6 knockdown the CDC6 expression in SGC7901/ PA cells. *P < 0.05

Discussion
Gastric cancer is an aggressive cancer that often is associated with resistance to chemotherapy or radiation [17–19]. This may have contributed to the high relapse rate of GC. Our findings of the downregulation of miR-26b in the GC cell lines suggest that miR-26b might serve as a tumor suppressor gene. This finding needs to be validated in GC tissue specimens. Moreover, miR-26b may also play a role in chemotherapy resistance, as its level was even lower in cells that are resistant to paclitaxel.
Overexpression of CDC6 has been reported in a variety of cancers [20, 21]. CDC6 is an essential initiation protein for DNA replication, playing a vital role in tumorigenesis by regulating cell cycle, apoptosis, and invasion [22, 23]. In addition, it was reported to be involved in chemotherapy resistance by activation of the ATR-Chk1 pathway [24]. Our findings of overexpression of CDC6 in the GC cell lines suggest that it may play a role in the tumorigenesis in GC. Moreover, it might also be involved in the development of resistance to paclitaxel chemotherapy in GC. If this finding can be generalized to GC tissue specimens, then targeting CDC by overexpressing miR-26b may serve as a promising anticancer strategy for GC.


