Introduction
Myocardial infarction (MI) is the prevalent sign of adverse left ventricular (LV) remodeling and heart failure (HF), and a major trigger of morbidity and death worldwide [1, 2]. Despite the combined use of pharmacological and emergency reperfusion treatments, adverse LV remodeling remains associated with unfavorable outcomes [2, 3]. Hence, the development of new treatment schemes able to effectively suppress or reverse adverse postischemia LV remodeling and dysfunction is needed. MicroRNAs (miRs), which are small noncoding RNAs, can modulate gene expressions following transcription [4], and it is estimated that most genes and cell processes are regulated by molecules such as miRs [5, 6]. miRs are also related to various diseases [7], including cardiovascular diseases [8]. Cardiac remodeling (CR) is the most interesting phenomenon in such conditions. Distinct miRs that play a vital role in cardiomyocyte hypertrophy include miR-208, -133, and -212/132 [9–11], whereas miR-21, -30, -133, and, -29 have been confirmed to be involved in fibrosis [12–16]. In this aspect, the relevance of miR-26a/b in some cardiac diseases has been established [17–23]. Taken together, these observations confirmed the hypothesis of miR-26b being a potential target for ameliorating cardiac function. Remarkably, a study demonstrated that miR-26a suppresses breast cancer cell growth by inhibiting RNF6/ERα/Bcl-xL signaling [24]. Accordingly, we hypothesized that miR-26b is involved in CR after MI. The present study was conducted to verify this hypothesis based on an MI rat model that was established by left coronary artery ligation and to assess the potential regulatory mechanism associated with RNF6/ERα/Bcl-xL signaling.
Material and methods
Animals
Animal experiments were approved by the Institutional Animal Care and Use Committee of the North Sichuan Medical College (No. 064/11 and R13-5424). All in vivo experiments were conducted using male adult Wistar rats (weight: 250–300 g).
Myocardial infarction rat model and miR profiling
In rats, MI was induced by ligating the left anterior descending artery, as previously described [25, 26]. On day 14 after MI induction, cardiac tissues were obtained for miR microarray. MiR expression was profiled using concentrated samples of six rats from each group at all time points on day 14 after MI induction, as previously described [27].
Construction of a lentivirus vector
HEK293T cells in the logarithmic phase were employed for lentivirus packaging. After trypsinization and counting, cells (5 × 10⁵ cells/ml) were inoculated into a 10-cm2 culture dish. The complete medium was replaced with serum-free medium 2 h before cell infection. When cell confluence reached approximately 80%, cells were infected with Lipofectamine 2000. Next, 2.5 ml of solution A (Opti-MEM supplemented with 25 µg of GV320 lentiviral vector expressing miR-26b mimic, miR-NC, RNF6, or empty vector; 12.5 µg of pHelper1.0; and 10 µg of pHelper2.0) and solution B (10 µl of Lipofectamine 2000 and 2.5 ml of Opti-MEM) were mixed at room temperature for 20 min. HEK293T cells were cultured with a mixture of solutions A and B at 37°C with 5% CO2. After 8 h of culture, cells were completely washed with phosphate-buffered saline, removed from cultured medium, and continued to be cultured with a medium containing 10% fetal bovine serum for 48 h. Subsequently, the supernatant of HEK239T cells was collected and centrifuged at 2000 g at 4°C for 10 min to remove cell debris. Cells filtered using a 0.45-µm filter were collected and preserved at –80°C.
Animal treatment
Control rats (control group; sham-operated, punctured without coronary artery ligation) and MI rat models (model group) were not subjected to any delivery of lentivirus, and the two groups comprised 20 male rats each. The model group (n = 80, 50% male and 50% female) rats were injected with the lentivirus through the tail vein: miR-NC, miR-26b, combination of miR-26b and lentiviral-NC, and combination of miR-26b and RNF6; each group comprised 10 male and 10 female rats. The lentivirus injection (1 × 10⁷ PFU per rat) through the tail vein was performed within 300 s after modeling and 3 days after modeling again. On day 13 after MI induction, cardiac function was assessed with the Vevo 770 ultrasound imaging system (Visual Sonics). Then, the rats were euthanatized, and the cardiac tissues were collected for subsequent experiments.
Echocardiography
On day 7 after MI induction, the rats were anesthetized with 1% isoflurane. During echocardiography, isoflurane (1.5–2.0%) and oxygen were supplied to maintain anesthesia. Cardiac function parameters including LV end-diastolic diameter (LVEDD) and volume (LVEDV) and LV end-systolic diameter (LVESD) and volume (LVESV) were determined and recorded using ultrasound biomicroscopy InviVue (Vevo 770; Visual Sonics) with an RMV 704 probe of 40 MHz central frequency. Thereafter, LV fractional shortening (LVFS) and ejection fraction (LVEF) were acquired [28], and the average values was determined after three successive cardiac cycles.
Tissue collection
The rats were euthanized on day 14 after MI induction, and their hearts were quickly excised. Myocardial tissues were extracted from the apex of the heart to the ligature site along the short axis using a blade, and the tissues were sliced into 2-mm-thick sections, followed by triphenyl tetrazolium chloride (TTC) staining. Meanwhile, myocardial tissues were extracted from the infarct areas. Parts of myocardial tissues were preserved for subsequent quantitative reverse transcription polymerase chain reaction (RT-qPCR) and western blotting (WB).
Cell cultivation and transfection
H9C2 cells and HEK293T cells were purchased from ATCC and cultivated in accordance with the manufacturer’s instructions. To investigate the effect of H2O2 treatment on miR-26b expression and relevant objective genes, cells were inoculated for 1 day, preserved in a standardized medium, and maintained under normoxic and H2O2 (100 µM) conditions for 2 days. Cells were subsequently collected for RT-qPCR. To evaluate the effects of RNF6 and miR-26b in vitro, cells were treated with LNA-modified miR-26b mimic, NC mimic, or a combination of miR-26b with pcDNA3-NC or pcDNA3-RNF6 at different concentrations and maintained under normoxic or H2O2 conditions for 2 days. Furthermore, cells were obtained for RT-qPCR, WB, and cell proliferation and apoptosis assays.
Cell growth
Cell viability capacity was evaluated using the CCK-8 assay according to the manufacturer’s instructions. Cells were seeded into 96-well plates, CCK-8 (10 µl) was added to each well and cells were incubated for a further 2 h at 37°C. Optical density was measured at 450 nm using an auto-microplate reader (infinite M200, Tecan, Switzerland), as mentioned previously [29, 30].
Dual-luciferase reporter assay (DLRA)
TargetScan Human 7.2 (http://www.targetscan.org/vert_72/) was applied to identify the miR-26b-5p-binding sites on RNF6 3′-UTR. After amplification, the fragments of RNF6 mRNA with possible mutants (MUT) or WT miR-26a-5p-binding sites were cloned into a pGL3 vector (50 ng), which were then cotransfected to HEK293T cells for 2 days with miR-26b-5p or miR-NC (100 ng) through Lipofectamine 2000 (Invitrogen, USA). The pRL-TK-Renilla vector (25 ng) that provided the constitutive expression of Renilla luciferase was cotransfected as an internal control to correct the differences in both transfection and harvest efficiencies. In the end, relative luciferase activity was detected by a GloMax 96 Luminometer based on the recommendations of Dual-Glo Luciferase Assay System (Promega, Madison, WI, USA). All experiments were performed in triplicate.
Western blotting
Cells were treated with the protease inhibitor cocktail (Roche Applied Science) and radioimmunoprecipitation assay buffer (pH 8.0). Protein concentration was measured using a bicinchoninic acid kit. Proteins were separated with sodium dodecyl sulfate polyacrylamide gel electrophoresis and electrically added to polyvinylidene difluoride membranes (Millipore, MA, USA). The available sites were blocked by incubating with primary antibodies at 4°C overnight and subsequently rinsed with Tris-buffered saline and tween 20 (TBST). Moreover, immunoblots were observed by cultivating cells with secondary antibodies for 60 min at room temperature. The bands observed on membranes were rinsed with TBST and visualized using the Thermo Maximum Sensitivity Substrate Kit (MA, USA).
Reverse transcription polymerase chain reaction
Total RNA was extracted from cells and tissue specimens (0.100 g) with TRIzol (Invitrogen), and the concentration was determined using NanoDrop2000 (OD260). cDNA was prepared through reverse transcription using an Oligo(dT)20 primer, and the MMLV First-Strand Synthesis Kit (Invitrogen) for RT-qPCR. RT-qPCR detection of U6 and miR-1225 was performed using relevant kits, according to the manufacturer’s instruction. The RT-qPCR conditions were as follows: denaturation for 10 min at 95°C, 40 denaturation cycles for 15 s at 95°C, and extension for 40 s at 60°C. Glyceraldehyde-3-phosphate dehydrogenase or U6 mRNA expressions served as the internal control. The 2–ΔΔCT method was performed to measure the target mRNA expression levels. All procedures were conducted in parallel three times.
Flow cytometry
Cell apoptosis was assessed by flow cytometry (FCM) with an Annexin V-FITC/PI apoptosis detection kit (BD Pharmingen). Cells were suspended in a binding buffer (0.02 ml) and exposed to Annexin V-FITC (0.01 ml)/PI (5 µl). Cell apoptosis rates were determined through FCM.
Triphenyltetrazolium chloride staining
The myocardial infarct size was determined by triphenyltetrazolium chloride (TTC) staining. Briefly, the rat heart was sliced into small sections which were incubated with 1% TTC (A610558, SangonBootech Co, Shanghai, China) for 30 min, fixed with 10% formalin for 10 min, and then observed after rinsing. The infarct area (pale white) and the area at risk (brick red) were measured using Image-Pro Plus 6.0 software. The infarct size (%) was calculated as infarct area/area at risk × 100%.
Results
miR expression profiles after myocardial infarction
To explore the miR expression profiles in cardiac impairment, the expression profiles of miRs isolated from cardiac tissues from the model and control groups (six samples per group) were determined on day 14 after MI induction. Differentially expressed genes (DEGs) were selected from the GSE46395 microarray data with an adjusted p-value of < 0.05 and |log2FCM| of > 2.0 as the threshold, and a heatmap of the top 17 DEGs was constructed (Figure 1 A). Furthermore, miR-26b expression in myocardial tissues was determined using RT-qPCR after successful establishment of the MI rat model, confirming the decrease in miR-26b expression level in myocardial tissues from the model group compared with those from the control group (Figure 1 B).
Figure 1
MicroRNA-26b (miR-26b) was a downregulated gene in cardiac tissues from rats with MI. A – The heatmap of the top 17 differentially expressed genes (DEGs) in microarray data of GSE46395. The abscissa and ordinate present sample number and DEGs, respectively, and the upper right histogram represents color grade. Each rectangle in the image represents the expression of a sample. B – miR-26b expression in myocardial tissues in the control and MI groups determined by RT-qPCR
MI – myocardial infarction, **p < 0.01 vs. control group only.
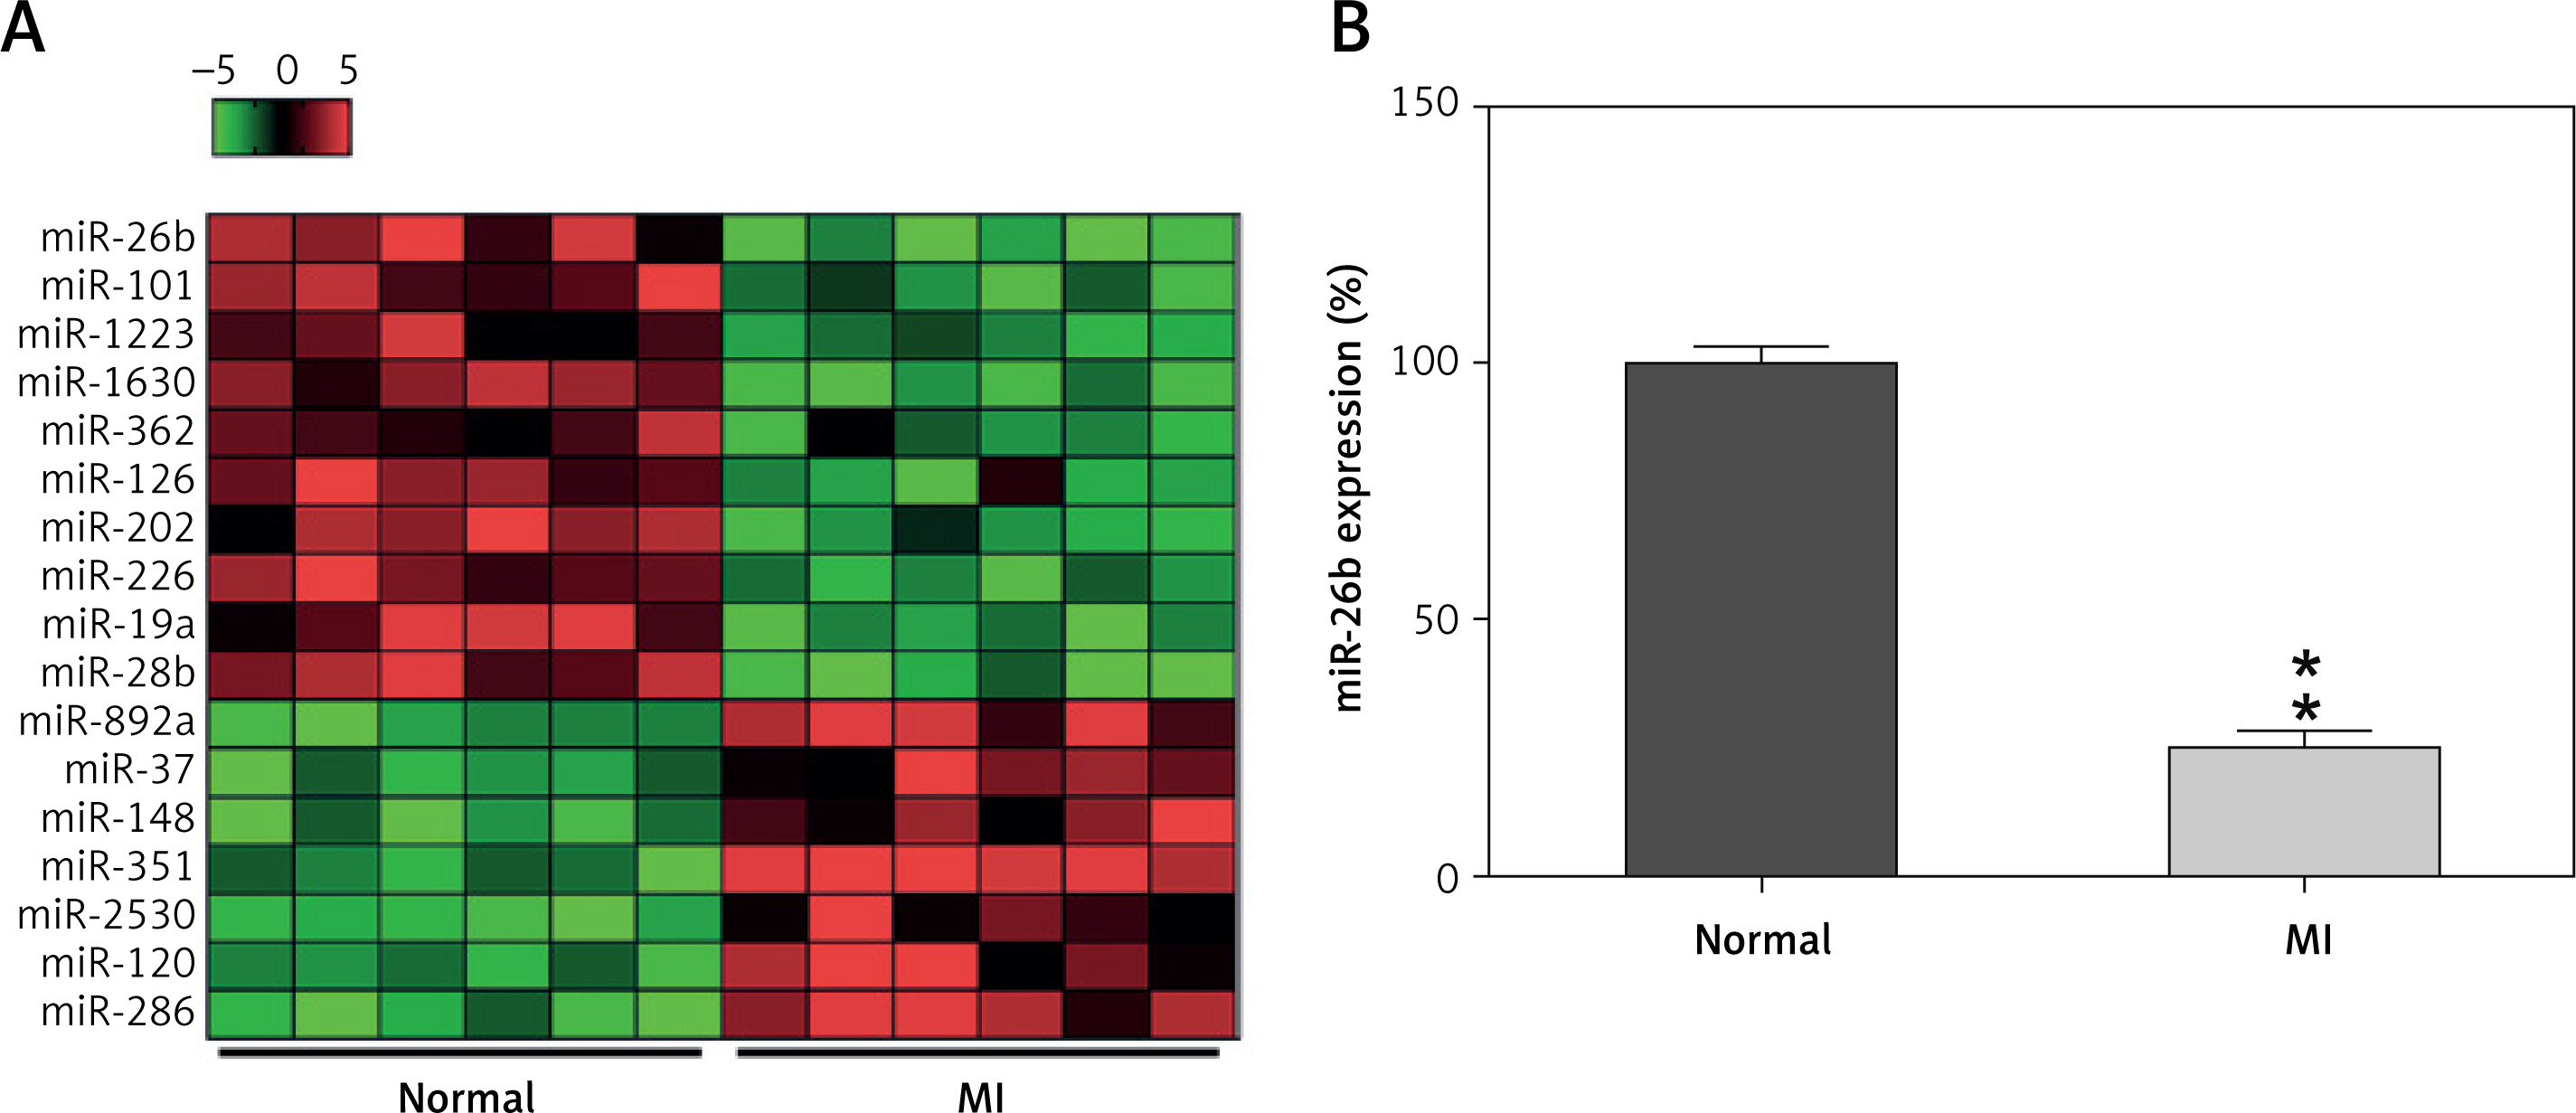
Figure 2
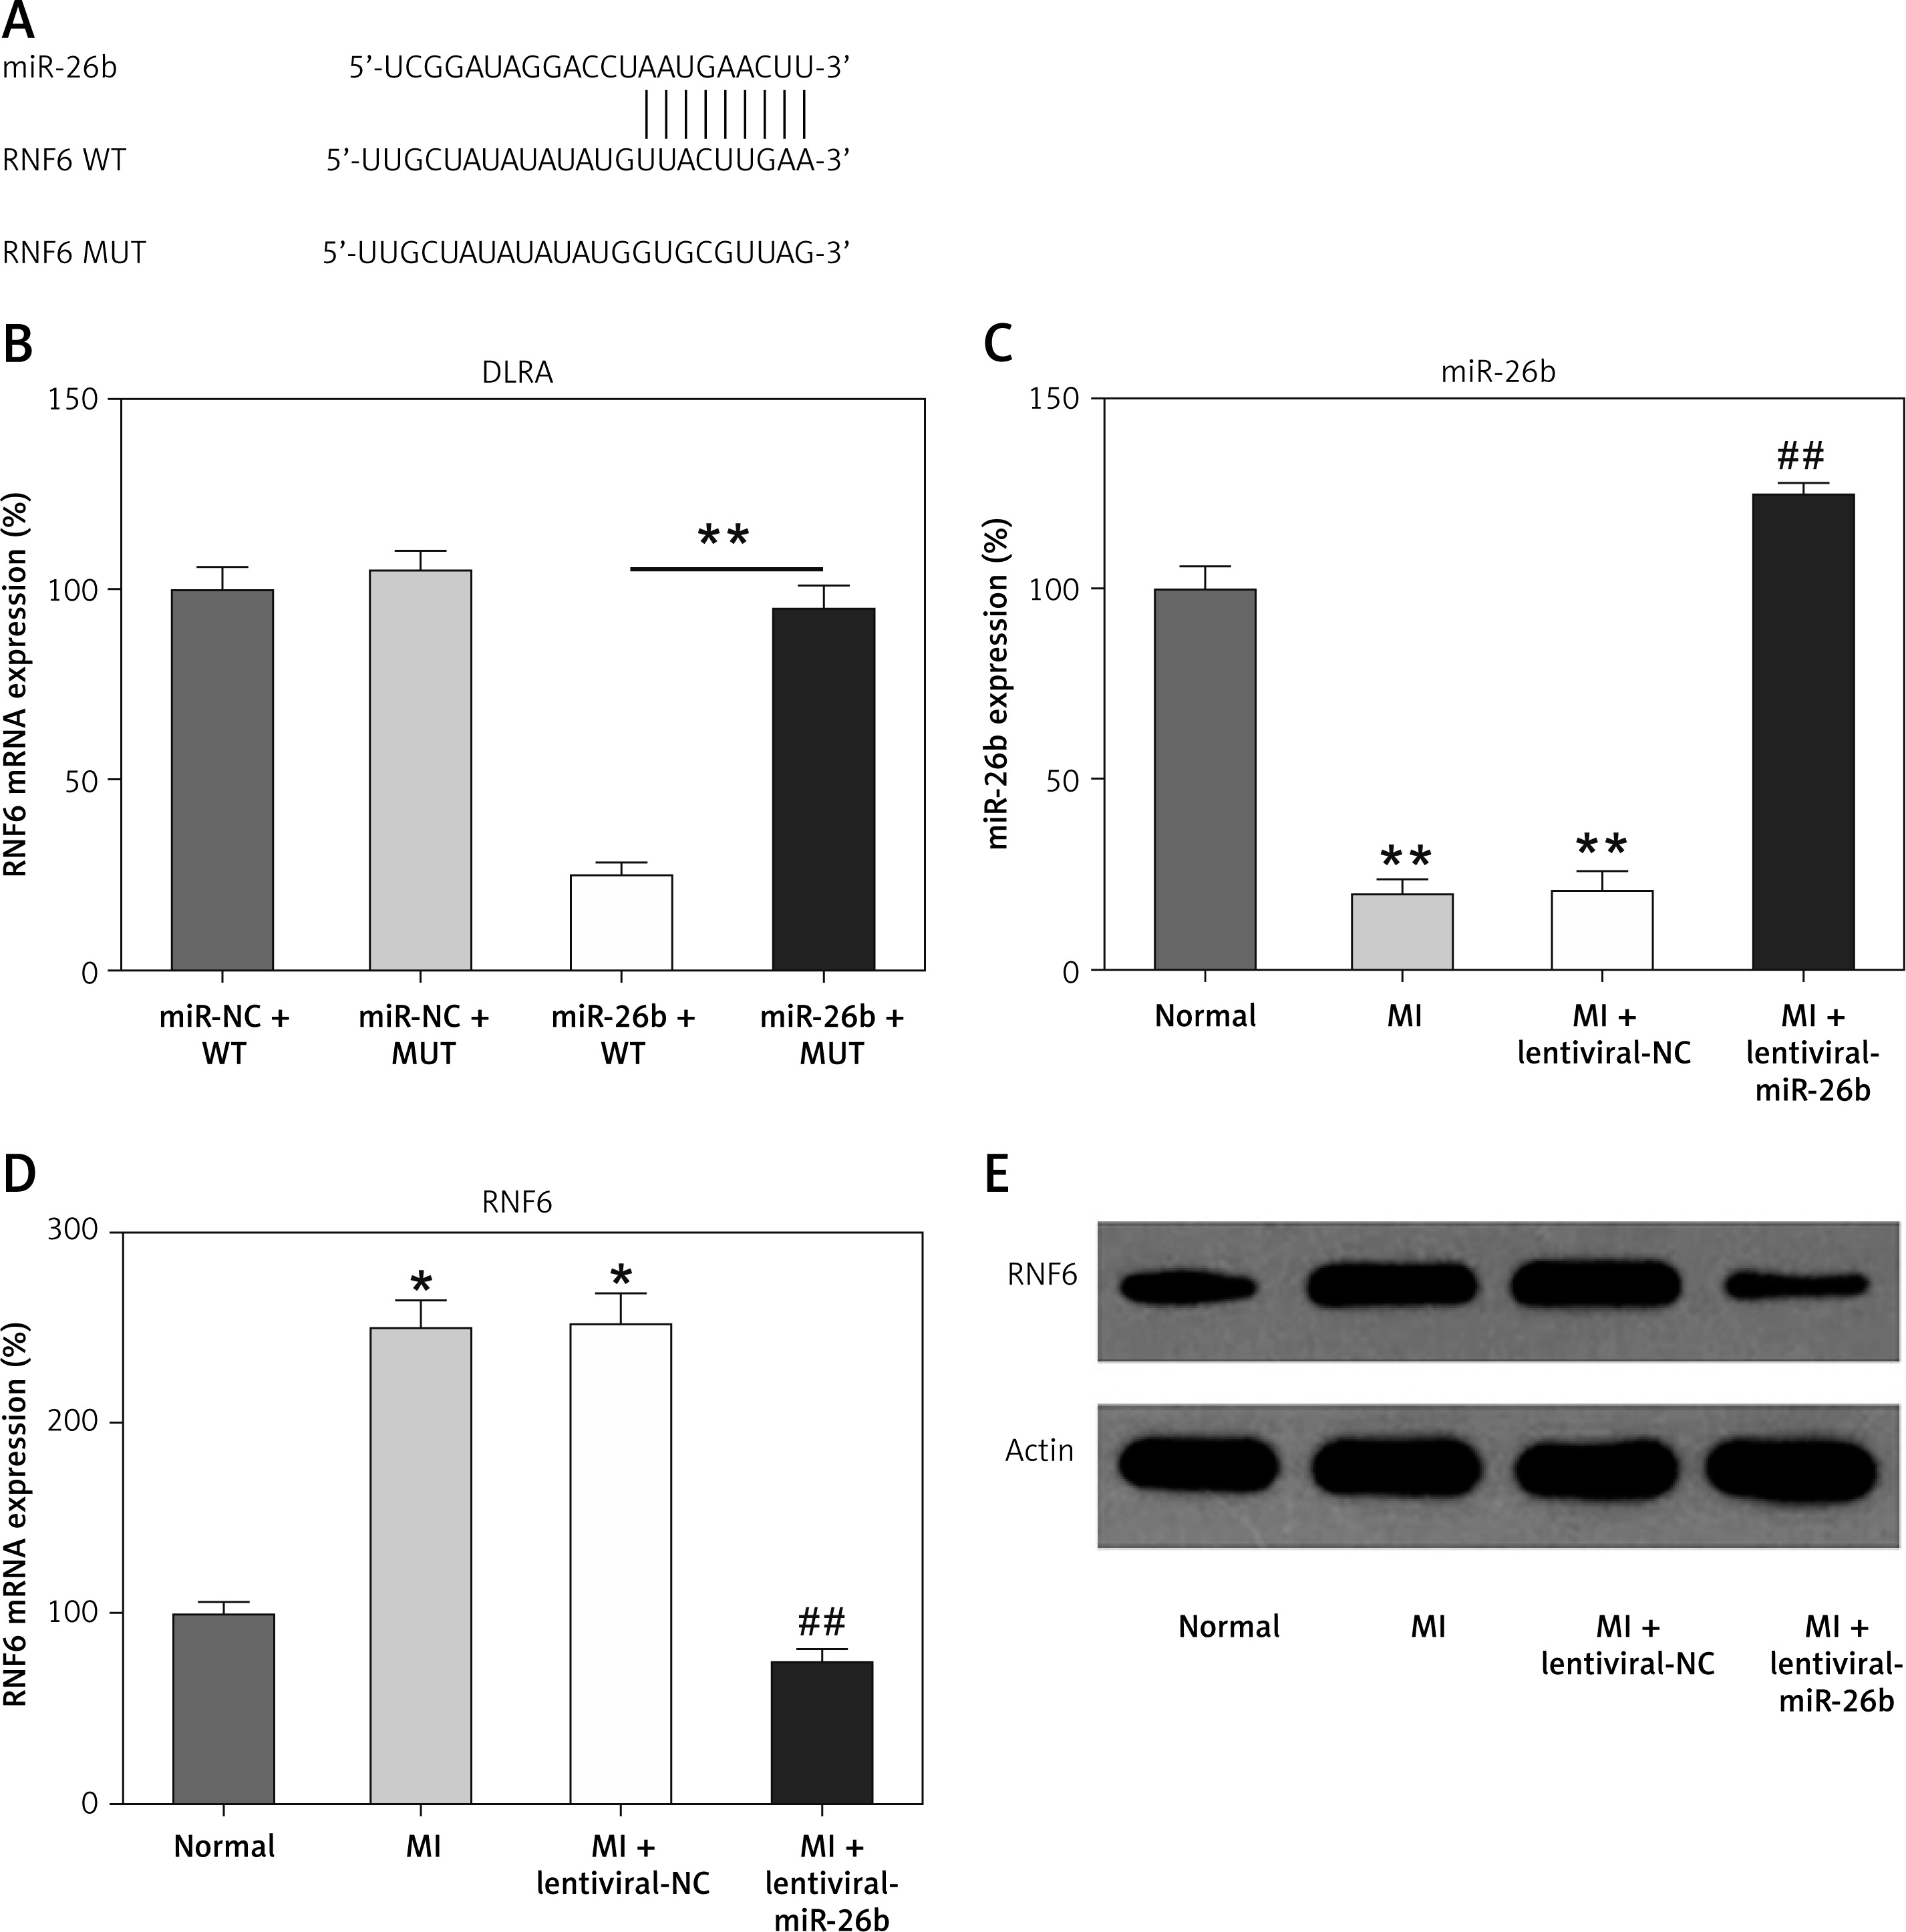
MicroRNA-26b (miR-26b) targets RNF63′-UTR. A – Bioinformatics analysis indicating that miR-26b possesses a binding site on RNF6 3′-UTR. B – DLRA was conducted, followed by dual-luciferase reporter assay with a wild-type or mutated RNF6 mRNA, and miR-26b or NC mimic were cotransfected into HEK293T cells. MI rats used were injected with lentiviral vectors expressing miR-NC or miR-26b. C – RT-qPCR showed miR-26b expression in myocardial tissues from MI rats. D, E – RT-qPCR and WB showed RNF6 mRNA and protein expression in myocardial tissues from MI rats
*p < 0.05, **P < 0.01 vs. indicated/control groups, ##p < 0.01 vs. MI groups.
MiR-26b targets RNF6 3′-UTR
Subsequently, we performed bioinformatics prediction to identify the putative target of miR-26b. The obtained data indicated that RNF6 3′-UTR has binding sites on miR-26b (Figure 2 A). Dual-luciferase reporter assay data then confirmed that RNF6 was a target gene of miR-26b, and miR-26b mimic transfection can inhibit the downregulation of luciferase activity via wild-type RNF6 (Figure 2 B). To further examine the effect of miR-26b upregulation on RNF6 expression in the model group, lentiviral-miR-26b/NC was used and injected in the model group to regulate miR-26b expression. We first detected miR-26b expression in the model group. RT-qPCR showed that lentiviral-miR-26b administration resulted in elevated miR-26b expression levels compared with those in the lentiviral-miR-NC group (Figure 2 C). Then, RT-qPCR and WB demonstrated that MI-induced cardiac modeling induced RNF6 expression, whereas miR-26b upregulation significantly decreased RNF6 expression in both mRNA and protein levels (Figures 2 D, E), suggesting that RNF6 expression was negatively correlated with miR-26b in myocardial tissues from the model group.
miR-26b improved cardiac function after MI by targeting RNF6
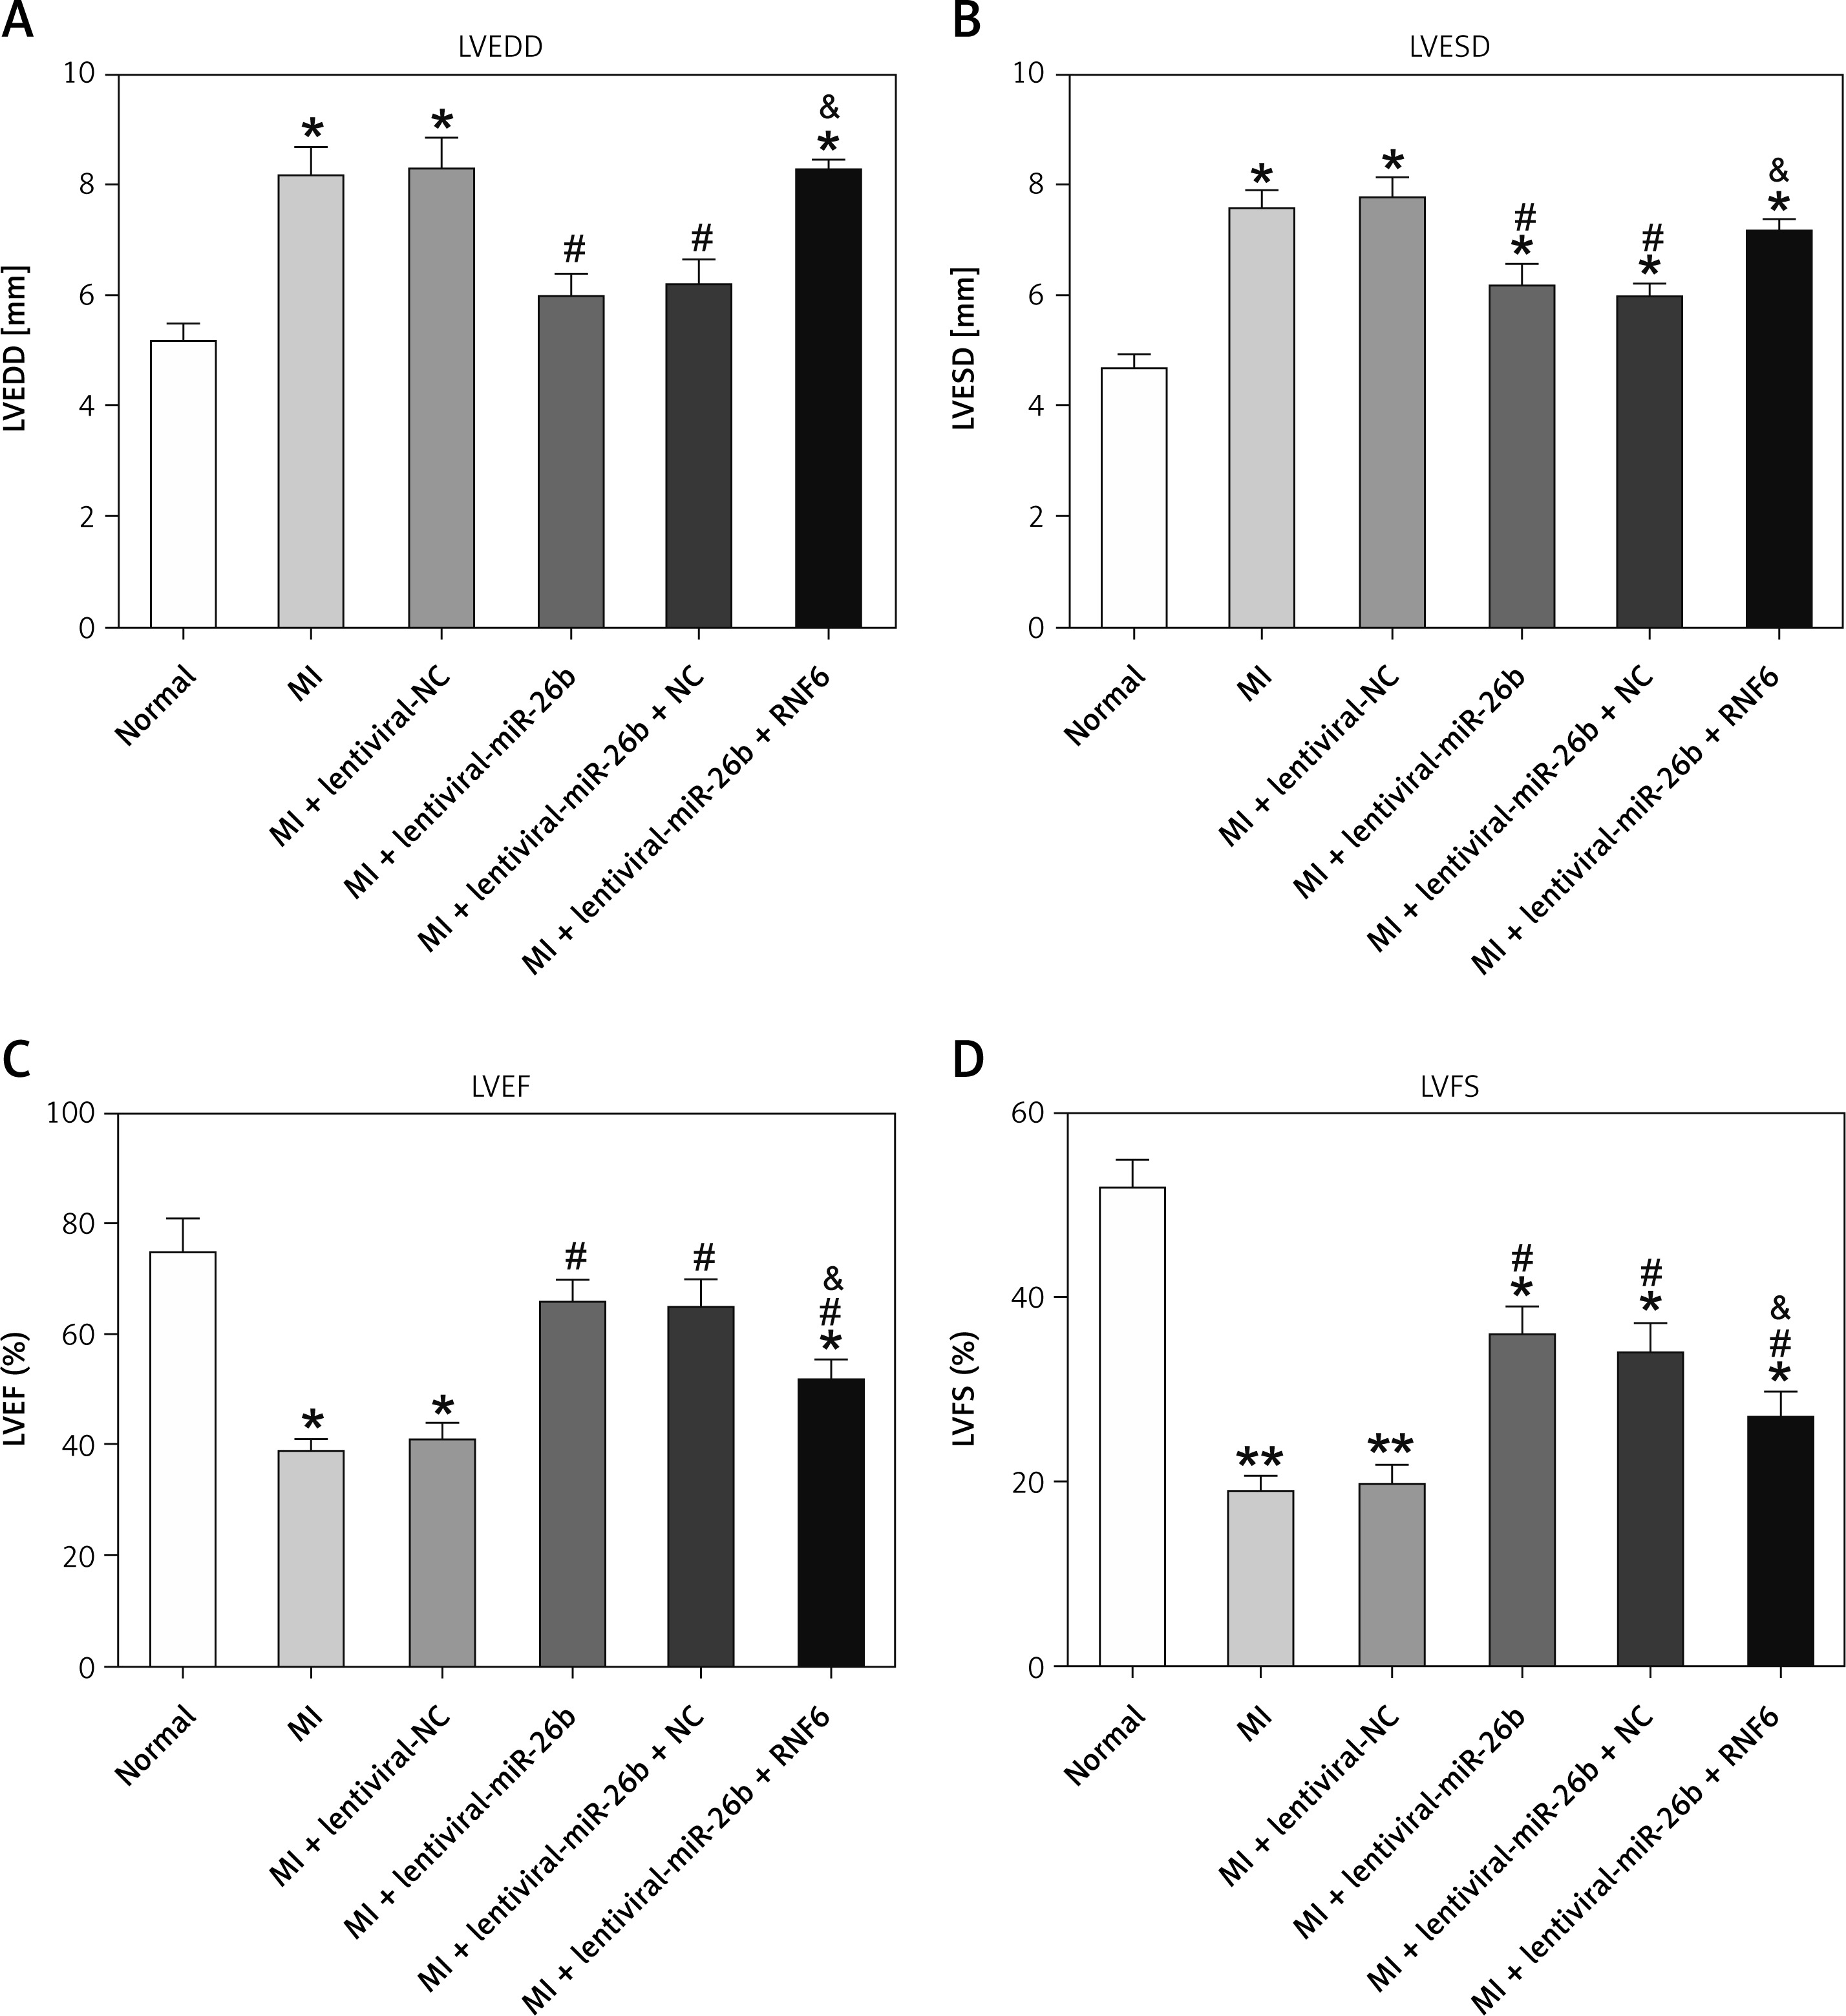
RNF6 was a target gene of miR-101; thus, its effects on MI were explored in the model group injected with lentiviral-miR-26b, lentiviral-miR-NC, lentiviral-miR-26b + lentiviral-NC, or lentiviral-miR-26b + lentiviral-RNF6. Subsequently, the indicators of cardiac function (LVEDD, LVESD, LVFS, and LVEF) were measured, aiming to discover the effects of miR-26b and RNF6 on cardiac function. Echocardiography revealed that LVEDD and LVESD were significantly higher, whereas LVFS and LVEF were markedly lower in the model group compared with the sham-operated group (Figures 3 A–D). Lentiviral-miR-26b administration led to reduced LVEDD and LVESD and elevated LVFS and LVEF in the model group. However, compared with the MI rats injected with lentiviral-miR-26b, those injected with lentiviral-miR-26b + lentiviral-RNF6 displayed high LVEDD and LVESD but low LVFS and LVEF, contradicting the results of miR-26b upregulation. These data suggested that MI-induced cardiac dysfunction can be relieved with miR-101 upregulation and that RNF6 was involved in this process.
Figure 3
MicroRNA-26b (miR-26b) overexpression improved cardiac function in MI rats. The MI rats used were injected with lentiviral vectors expressing miR-NC, miR-26b, miR-26b + NC, and/or miR-26b + RNF6. A – Left ventricular end-diastolic diameter (LVEDD) in control and MI rats. B – Left ventricular end-systolic diameter (LVESD) in control and MI rats. C – Left ventricular ejection fraction (LVEF) in control and MI rats. D – Left ventricular fractional shortening (LVFS) in control and MI rats
*p < 0.05, **p < 0.01 vs. control rats; #p < 0.05 vs. MI rats; &p < 0.05 vs. MI rats subjected to both lentiviral vectors expressing miR-26b.
miR-26b reduces myocardial infarct area in MI rats by targeting RNF6
Triphenyl tetrazolium chloride staining was performed to explore the effects of miR-26b and RNF6 on myocardial infarct size in MI rats. Compared with control rats, MI rats had a larger heart volume, a thinner LV wall, and an obvious white myocardial infarct area. The myocardial infarct area in MI rats significantly decreased after treatment with lentiviral-miR-26b mimic but significantly increased after treatment with lentiviral-miR-26b + lentiviral-RNF6 (Figures 4 A, B). Taken together, the results show that miR-26b overexpression contributed to decreased myocardial infarct size in MI rats, whereas RNF6 overexpression reversed this effect.
Figure 4
Myocardial infarct size in MI rats was reduced in response to elevation of microRNA-26b (miR-26b) expression level. MI rats used were injected with lentiviral vectors expressing miR-NC, miR-26b, miR-26b + NC, and/or miR-26b + RNF6. A – Representative images of myocardial infarct in control and MI rats detected by triphenyl tetrazolium chloride staining. B – Percentage of myocardial infarct area in control and MI rats
**p < 0.01, ***p < 0.001 vs. control rats. #p < 0.05 vs. MI rats. &p < 0.05 vs. MI rats injected with lentiviral vector expressing miR-26b.
miR-26b suppresses cardiomyocyte apoptosis in MI rats by targeting RNF6
The effects of miR-26b and RNF6 on cardiomyocyte apoptosis were determined by testing two typical apoptosis markers, i.e., Bcl-2 and Bax, in miR-26b or RNF6 restoration in cardiomyocytes. As demonstrated by RT-qPCR and WB, MI rats displayed lower Bcl-2 and higher Bax expression levels in both mRNA and protein levels than control rats (Figures 5 A–C). Compared with the MI rats injected with empty vector, the MI rats with miR-26b upregulation had considerably higher Bcl-2 and lower Bax expression levels in cardiomyocytes. Meanwhile, the MI rats injected with lentiviral-miR-26b and RNF6-overexpressing vector presented with markedly lower Bcl-2 and higher Bax expression levels compared with MI rats injected with lentiviral-miR-26b (Figures 5 A–C). Collectively, miR-26b upregulation or RNF6 restoration could contribute to inhibited or promoted cardiomyocyte apoptosis after MI, respectively.
Figure 5
MicroRNA-26b (miR-26b) protects cardiomyocytes against apoptosis in MI rats. The MI rats used were injected with lentiviral vectors expressing miR-NC, miR-26b, miR-26b + NC, and/or miR-26b + RNF6. A, B – RT-qPCR was performed to determine Bcl-2 and Bax mRNA expression levels in myocardial tissues from control and MI rats. C – WB was performed to detect Bcl-2 and Bax protein expression levels in myocardial tissues from control and MI rats
**p < 0.01 vs. control rats, #p < 0.05, ##p < 0.01 vs. MI rats, &p < 0.05 vs. MI rats injected with lentiviral vector expressing miR-26b.
miR-26b upregulation promoted survival and inhibited cell apoptosis of H2O2-treated H9C2 cells
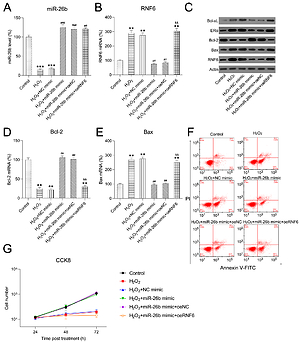
H2O2 has been widely reported to induce injury and apoptosis of cardiomyocytes, and H2O2-treated cardiomyocytes served as a cell model for MI in this study [31]. At first, RT-qPCR and WB showed that miR-26b and RNF6 were downregulated and upregulated in H2O2-treated H9C2 cells, respectively, which is consistent with their performance in the MI rat model (Figures 6 A–C). Thereafter, H2O2-treated H9C2 cells were transfected with miR-26b mimic and/or RNF6-overexpressing vector to induce miR-26b overexpression and RNF6 restoration. Transfection with miR-26b mimic obviously led to an increased miR-26b level in cells (Figure 6 A). Meanwhile, cotransfection of miR-26b mimic and pcDNA3-RNF6 also caused an increase in RNF6 upregulation in H2O2-treated H9C2 cells with a high miR-26b expression level (Figures 6 B, C). Furthermore, WB and RT-qPCR were performed to assess Bcl-2 and Bax expression levels. H2O2 treatment downregulated Bcl-2 expression but upregulated Bax expression. In contrast, transfection with miR-26b mimic resulted in a considerably lower Bax expression level compared with transfection with NC mimic. miR-26b overexpression also promoted Bcl-2 expression (Figures 6 C–E). However, RNF6 restoration contributed to an elevated Bax level and attenuated Bcl-2 level in H2O2-treated H9C2 cells with miR-26b upregulation (Figures 6 C–E). Flow cytometry was also performed to test the apoptosis rate of H9C2 cells subjected to different treatments. H2O2 administration caused significant death of H9C2 cells, whereas miR-26b upregulation significantly reduced the proportion of apoptotic cells to a normal level. Furthermore, RNF6 restoration in H9C2 cells with miR-26b upregulation improved the apoptosis rate again (Figure 6 F), suggesting that miR-26b repressed cell apoptosis of H2O2-treated H9C2 cells by mediating RNF6 expression. In addition, CCK-8 assay was performed to reveal the cell growth rate. Compared with control cells, H2O2 incubation led to a lower growth rate of H2O2-treated H9C2 cells, whereas transfection with miR-26b mimic caused recovery of their proliferation rate. Notably, RNF6 overexpression obviously reduced the growth rate of H2O2-treated H9C2 cells, which was promoted by miR-26b upregulation (Figure 6 G). These data suggested that miR-26b upregulation promoted survival and inhibited apoptosis of H2O2-treated H9C2 cells by targeting RNF6.
Figure 6
MicroRNA-26b (miR-26b) overexpression promoted survival and inhibited apoptosis of H2O2-treated H9C2 cells. Cells were transfected with miR-26b mimic, NC mimic, or miR-26b + pcDNA3-NC or miR-26b + pcDNA3-RNF6 and subsequently treated with 100 μM H2O2 for 48 h. A, B – RT-qPCR revealed miR-26b and RNF6 mRNA expression levels. C – WB detected RNF6, Bcl-2, and Bax protein expression levels. D, E – RT-qPCR detected Bcl-2 and Bax mRNA expression levels. F – Effect of miR-26b on cell apoptosis was assessed by Annexin V/PI FCM. G – Effect of miR-26b on cell growth was assessed via CCK-8 assay
**p < 0.01, ***p < 0.001 vs. control group. ##p < 0.01, ###p < 0.001 vs. H2O2 treatment group, &&p < 0.01 vs. H2O2 + miR-26b mimic group.
Discussion
Myocardial remodeling (MR) is one of the main changes in cardiac structure, which leads to hemodynamic imbalance in the presence of pathological stimuli and biomechanical stress. MR involves alterations in structure, size, mass, shape, and functions. Its main causes include myocardial hypertrophy, cardiomyocyte impairment, angiogenesis, myocardial fibrosis, and inflammation. An obvious cardiomyocyte loss due to diverse insults and slower cardiomyocyte regeneration rate is an indicator of MR in human and animal models [32]. This study profiled miR expression in an MI rat model to recognize abnormally expressed cardiac miRs with latent expression in adverse CR after MI. This study revealed that the change in miR expression after MI is relative to that in normal conditions. Several miRs with different expression were recognized to respond to ischemia-induced impairment, and postischemia remodeling was associated with myocardial ischemia and CR resulting in HF, such as miR-101, miR-126, miR-202, and miR-351 [33]. We observed a significant decrease in miR-26b expression level in myocardial tissues of rats after MI. miR-26 has various roles in modulating key aspects of cell growth, development, and activation. miR-26b is extremely conservative and serves as a modulator of tumor progression [34–36] and other diseases [37–39]. Recent evidence confirms that the miR-26 family performs a vital role in cardiovascular diseases by regulating the main signaling pathways such as BMP/SMAD1 and targets associated with endothelial cell growth, angiogenesis, and LV function after MI [40]. A study reported that miR-26b was dysregulated during myocardial hypertrophy and was involved in cardiomyocyte growth and survival. miR-26b overexpression inhibited endothelin-induced hypertrophy and GATA4-related transcription as well as enhancing cell sensitivity to apoptosis-induced impairment. Moreover, miR-26b acted on PLC-β1, which then suppressed miR-26b expression [21]. Zhang et al. reported that miR-26b inhibited GSK-3β 3′-UTR and decreased β-MHC and ANF expression in CM in vitro, revealing the possible relevance of miR-26b to regulation of myocardial hypertrophy [41]. In the present study, we found that miR-26b upregulation suppressed adverse CR after MI in an MI rat model. miR-26b overexpression in MI maintained systolic and contractile functions in a dose-dependent manner. LVEDD, LVESD, LVEF, and LVFS are global nonintrusive measurement indicators of CR, which can be used for predicting clinical results after MI and applied to a series of cardiovascular system-based anti remodeling treatments [42]. An absolute 20% reduction in LVEDD, 15% reduction in LVESD, and 30% improvement in LVEF and LVFS were observed in miR-26b-upregulated cells in rats 14 days after MI induction, whereas MI rats revealed deterioration in EF, suggesting analogous effects of miR-26b in clinical practice, which are particularly favorable and relevant to a notable increase in survival rate [42].
Furthermore, we inferred that the underlying mechanism of miR-26b in MI was negatively targeting RNF6 and the downstream ERα/Bcl-xL axis. RNF6 serves as a promising promoter in cancers such as hepatocellular carcinoma (HCC) and breast cancer (BC). In HCC, RNF6 knockdown suppressed HCC migratory abilities, EMT, and radioresistance [43]. In BC, an RNF6/ERα/Bcl-xL (hereinafter abbreviated as R/E/B) axis was found to exist that facilitated cell proliferation and survival, and acting upon the R/E/B axis provided a promising treatment choice [44]. However, there is no evidence linking RNF6 to cardiovascular disease. The study showed that miR-26b acted on RNF6 mRNA and suppressed its expression. miR-26b displayed its myocardial protective activity by suppressing RNF6 expression and R/E/B signaling in MI rats and H2O2-treated H9C2 cells. RNF6 restoration reversed the improved cardiac function and reduced myocardial apoptosis induced by miR-26b in vitro and in vivo. In addition, the in vitro study suggested that miR-26b inactivated ERα/Bcl-xL signaling. The study data also suggested the role of the R/E/B axis as an apoptosis inducer in H2O2-treated H9C2 cells, which is in contrast with the findings of a previous study in BC cells, possibly because of the use of different cell lines and treatment.
We found that miR-26b upregulation protected against MI-induced CR by inhibiting RNF6 expression in the MI rat model. Meanwhile, miR-26b disrupts the R/E/B axis, indicating that the miR-26b/RNF6/ERα/Bcl-xL axis could provide deeper knowledge on the mechanism underlying MI. Although the present data revealed promising targets for MI, further efforts are needed to validate the effectiveness of miR-26b-targeted therapies in clinical treatments. Moreover, the effects of overexpressed or silenced miR-26b in HF animal models are expected to be investigated in the future.