Osteoporosis (OP) arises from an imbalance between bone resorption and formation, leading to diminished bone mass and weakened bone structure [1]. It is the most prevalent bone ailment globally, with over 37.5 million individuals affected in the European Union (EU) and the United States of America (USA) alone by 2010 [2]. Particularly prevalent among postmenopausal women, nearly one in three women over the age of 50 are afflicted by this condition. Therefore, it is essential to recognize potential factors that could impact the onset of OP, and further research into the pathogenesis, prevention, and treatment principles of OP holds significant medical and social value.
Menstrual cyclicity serves as a visible indicator of both health and fertility. The length of the menstrual cycle refers to the duration between the initial day of menstrual bleeding in one cycle and the commencement of menses in the subsequent cycle [3]. Typically, the median duration of a menstrual cycle is 28 days, with most cycles between 25 and 30 days [4]. Individuals experiencing menstrual cycles lasting fewer than 21 days are categorized as polymenorrheic, while those with cycles lasting longer than 35 days are termed oligomenorrheic. Studies indicate that the menstrual cycle entails consistent, cyclic variations in estrogen and progesterone levels, and these hormones are pivotal in bone metabolism, remodeling, and BMD [5, 6].
Mendelian randomization (MR) offers a risk-free method for examining causal effects. It functions as an analytical method that uses genetic traits as instrumental variables (IVs) to explore causal relationships between exposure and result [7]. Our aim was to explore the association between menstrual cycle length and BMD, and to substantiate this relationship through a two-sample MR analysis.
Methods
Study design
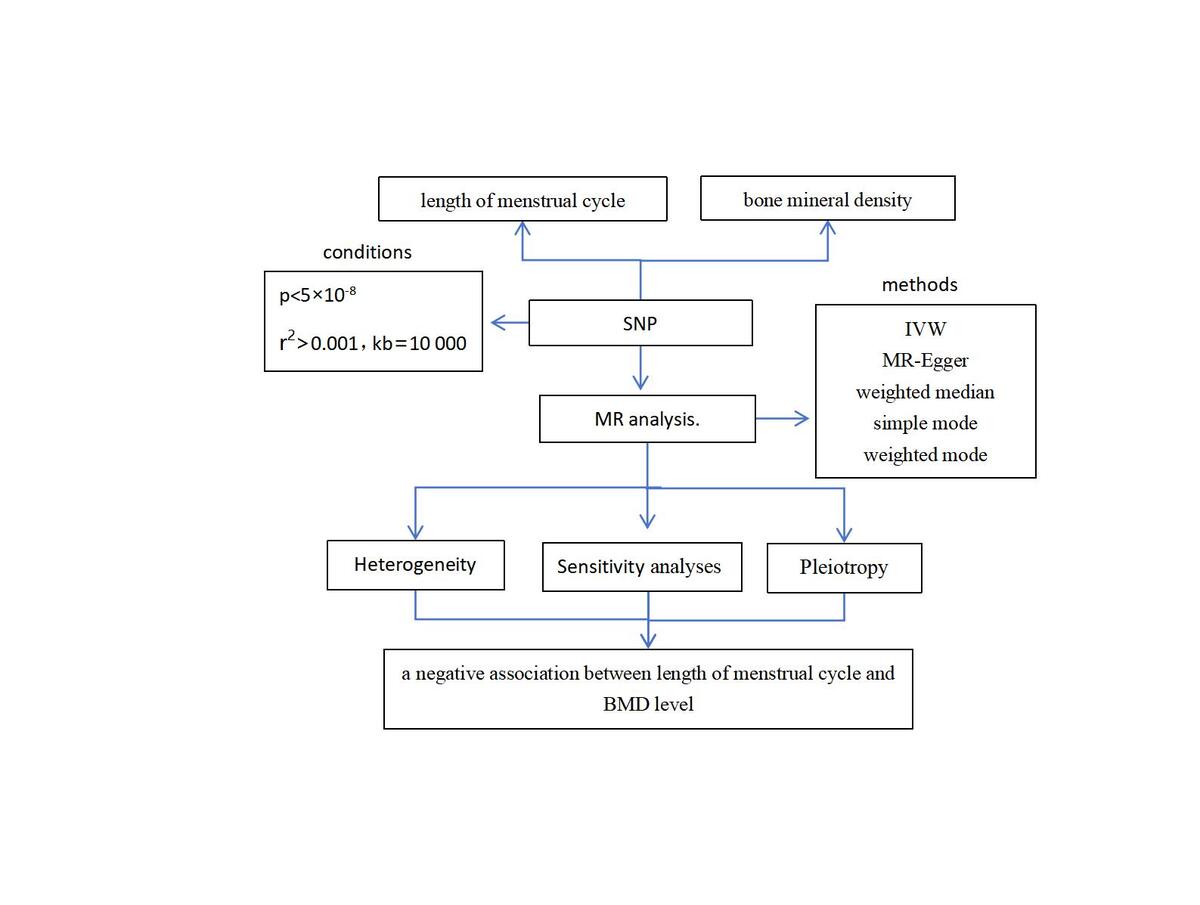
This study strictly adhered to the three assumptions of MR analysis: (1) The selected IVs were related to the exposure. (2) IVs were not associated with any confounding factors. (3) IVs can influence outcomes solely through the exposure. All datasets utilized in this study are openly accessible. Leveraging these premises, we proceeded to estimate the causal association between menstrual cycle length and total body BMD (TB-BMD), lumbar spine BMD (LS-BMD), femoral neck BMD (FN-BMD), and TB-BMD 0–15 years, TB-BMD 15–30 years, TB-BMD 30–45 years, TB-BMD 45–60 years, and TB-BMD over 60 years.
GWAS Summary Data
The UK Biobank provided the GWAS summary statistics for the menstrual cycle length (ukb-b-3278) (http://www.nealelab.is/uk-biobank). The data provide bone density measurements for the total body, lumbar spine and femoral neck with sample sizes of 56,284 (TB-BMD), 28,498 (LS-BMD) and 32,735 (FN-BMD). Furthermore, TB-BMD data across five age groups (0–15 years: n = 11,807 cases; 15–30 years: n = 4,180 cases; 30–45 years: n = 10,062 cases; 45–60 years: n = 18,805 cases; over 60 years: n = 22,504 cases) were also downloaded from MRC-IEU [8] (http://www.bristol.ac.uk/integrative-epidemiology/).
Instrument selection
We established consistent filtering criteria for the tool variables, with statistical significance indicated by p < 5 × 10⁻⁸. Linkage disequilibrium analysis of the corresponding SNPs was conducted for each instrumental variable. We enforced a threshold of r2 < 0.001 and kb = 10000. Additionally, we eliminated SNPs that were directly related to OP as well as those that were connected to confounding variables related to OP. Furthermore, we carried out extra screening of the retrieved SNPs to weed out those with palindromic SNPs displaying unclear strands and non-concordant alleles. These rigorously selected SNPs were designated as IVs for subsequent MR analysis. Lastly, the chosen instrumental SNPs ought to show robust correlations with the exposure variable, in line with the MR analysis’s underlying assumptions. SNPs with inadequate statistical power (F < 10) were excluded. We calculated the F statistic using the formula: (F = R2(n – k – 1)/k(1 – R2).
R2 represents the proportion of exposure variance explained by IVs, where k denotes the number of IVs used in the model, and n represents the sample size [9].
Statistical analysis
The random effects IVW approach was used for the primary study. Additional methodologies such as MR-Egger, weighted median, simple mode, and weighted mode were utilized in order to examine the causal association. For sensitivity analysis, we then utilized the Cochran’s Q test as a heterogeneity test, and the intercept from MR-Egger regression was employed to assess the pleiotropy of MR results. Additionally, leave-one-out tests were performed to determine whether single nucleotide polymorphisms altered MR results. All analyses were performed using the TwoSampleMR R package (version 0.5.5) for Mendelian randomization. A significance level of p < 0.05 was considered statistically significant.
Results
Selection of instrumental variables
A summary of the GWAS data was used to choose qualifying SNPs. Afterward, a cumulative set of 8 SNPs was eventually incorporated into the further analysis, exploring the correlation between menstrual cycle length and TB-BMD, LS-BMD, FN-BMD, as well as TB-BMD across various age intervals (0–15, 15–30, 30–45, 45–60, and over 60). The F statistics > 10, suggesting that weak instrumental bias may not have been substantial in our study.
MR analysis for causal link of menstrual cycle length with BMD
Utilizing Mendelian randomization, we investigated the associations between menstrual cycle length and BMD. The results of these methods are presented in Table I. In the analysis, the IVW method demonstrated that the genetically predicted menstrual cycle length was negatively associated with the level of BMD (TB-BMD: β = –0.207, 95% CI: [–0.323, –0.091], p < 0.001; LS-BMD: β = –0.140, 95% CI = [–0.267, –0.023], p = 0.031; FN-BMD: β = –0.154, 95% CI = [–0.280, –0.027], p = 0.002) in initial practice.
Table I
MR estimates from different methods for assessing the causal effect of menstrual cycle length on BMD by site
In the causal analysis of menstrual cycle length and TB-BMD across five age groups, a significant causal negative relationship was found between menstrual cycle length and TB-BMD in the age groups 45–60 and over 60 years. However, no significant causal relationship was found for TB-BMD in the age groups 0–15 years, 15–30 years, and 30–45 years. The IVW method demonstrated the following results: TB-BMD 0–15 years: β = –0.011, 95% CI: [–0.324, 0.125], p = 0.385; TB-BMD 15–30 years: β = –0.158, 95% CI: [–0.639, 0.323], p = 0.520; TB-BMD 30–45 years: β = –0.311, 95% CI: [–0.660, 0.038], p = 0.080; TB-BMD 45–60 years: β = –0.374, 95% CI = [–0.533, –0.215], p < 0.001; TB-BMD over 60 years: β = –0.134, 95% CI = [–0.273, 0.005], p = 0.053.
Sensitivity analyses for causal link of menstrual cycle length with BMD
Refer to Table II for specifics. With the exception of TB-BMD 15–30 and TB-BMD 30–45, the Cochran’s Q statistic from both MR-Egger and IVW methods revealed no noteworthy heterogeneity among the instrumental variables.
Table II
Sensitivity analysis of the MR results for exposures and outcomes
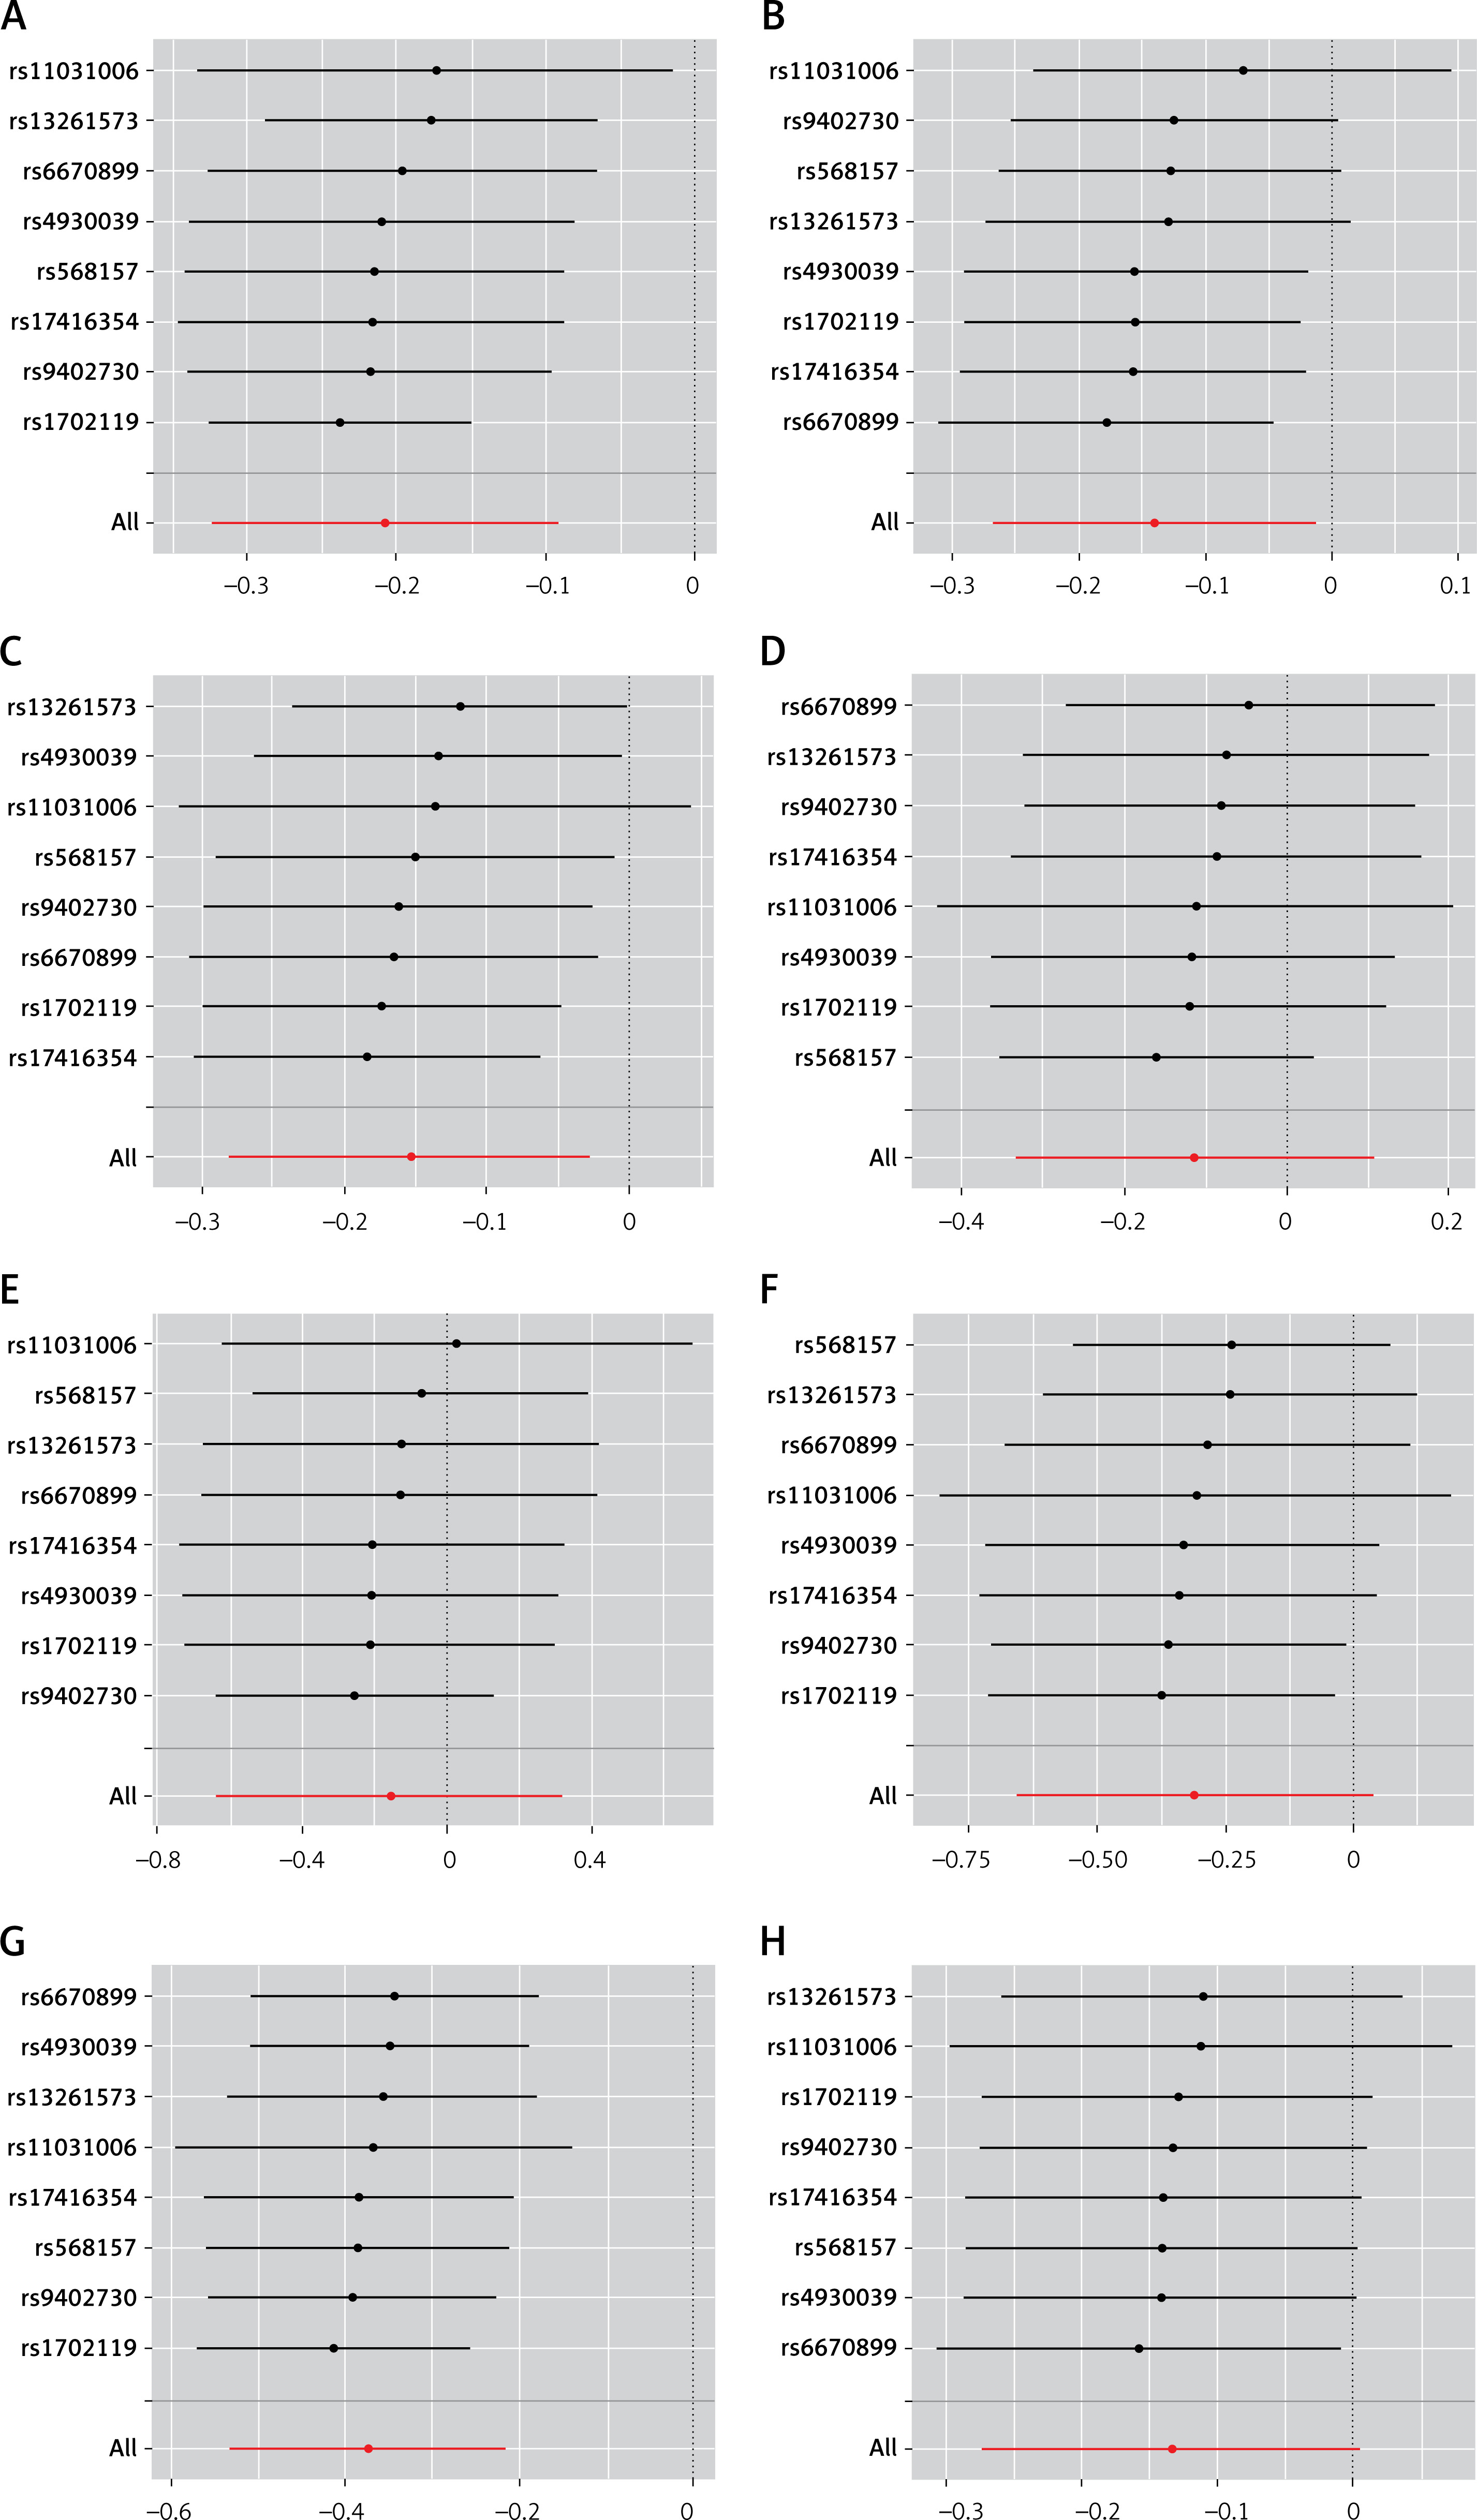
For TB-BMD 15–30 years: IVW, p = 0.034; MR-Egger, p = 0.047; MR-Egger intercept = 0.031, p = 0.331; and TB-BMD 30–45 years: IVW, p = 0.008; MR-Egger, p = 0.004. Despite observing heterogeneity in some of the results tested with Cochran’s Q test, since we used random effects IVW as the main outcome, the level of heterogeneity is acceptable and does not undermine the MR estimates in the present study. Furthermore, the results remain non-significant in leave-one-out sensitivity analyses (Figure 1). Furthermore, no evidence of horizontal pleiotropy was observed in these findings (p > 0.05), suggesting that the results were not influenced by potential confounding pathways, thus affirming their validity and robustness.
Figure 1
Leave-one-out sensitivity analysis plot for SNP effects on the relationship between length of menstrual cycle and BMD. A – Length of menstrual cycle on TB-BMD. B – Length of menstrual cycle on LS-BMD. C – Length of menstrual cycle on FN-BMD. D – Length of menstrual cycle on TB-BMD (0–15). E – Length of menstrual cycle on TB-BMD (15–30). F – Length of menstrual cycle on TB-BMD (35–40). G – Length of menstrual cycle on TB-BMD (45–60). H – Length of menstrual cycle on TB-BMD (over 60).
Discussion
Our research established a causal link between the length of the menstrual cycle and BMD, encompassing TB-BMD, LS-BMD, and FN-BMD across five different age groups. During the analysis, the IVW method revealed a negative association between menstrual cycle length and BMD level in initial practice. In the causal analysis of menstrual cycle length and age-stratified BMD, a notable negative causal relationship was identified between menstrual cycle length and TB-BMD in age groups 45–60 and over 60 years, but no significant causal relationship was found for TB-BMD in the age groups 0–15, 15–30, and 30–45.
Numerous studies have investigated the relationship between the length of the menstrual cycle and BMD or OP [10–12]. Several studies generally align with our study results, where participants reported their usual patterns of menstrual cycle regularity and length. Exclusions were made for periods of pregnancy, lactation, or contraceptive use in these studies. A study has shown that women in perimenopause experience a higher rate of bone loss in the spine and femoral neck compared to those in early menopause and premenopause. Irregular menstrual cycles, characterized by lengthening cycles, contribute to a decline in total body, spine, and femoral neck BMD approximately 2 years before the onset of the last menstrual period [13]. A questionnaire survey conducted in China on women aged 40–80 also discovered a close relationship between menstrual cycle length and the prevalence of OP. The survey demonstrated a negative correlation between the menstrual cycle length and the prevalence of OP [12]. Among individuals aged 35–39, cycle length variability was minimal, but it notably increased in those aged 45–49 and 50 years and older [14]. Specifically, the prevalence of OP is the highest when the menstrual cycle is ≥ 29 days. Recker pointed out that abnormal menstrual cycles can lead to a 0.5% decrease in bone density in the femoral neck and a 0.6% decrease in overall mineral content [6].
Perimenopause, often referred to as the menopausal transition, delineates the several-year phase preceding an individual’s final menstrual period and is typified by escalating variability in menstrual cycle length. Studies by Parker SE and others [15] have shown that bone loss accelerates threefold in the immediate postmenopausal period, with losses observed at all sites during the ages of 50–59. However, our study did not reveal any causal relationships between TB-BMD and age groups 0–15, 15–30, and 30–45 years. Similarly, in a large cross-sectional study involving 963 healthy women aged 19–35 years, no significant association was found between menstrual status and BMD [16]. Li et al. found [14] that the average menstrual cycle length decreases with age across all age groups until reaching age 50, after which it begins to increase for those aged 50 and older.
Irregular and long menstrual cycles, which affect approximately 20% of women, are often attributed to disruptions in the hypothalamic-pituitary-ovarian axis among women of reproductive age. Estrogen has a crucial role in the connection between menstruation and BMD or OP [17]. Research has demonstrated a correlation between decreased bone mass and both extended follicular phases and decreased estrogen production [18]. Reduced plasma estradiol levels have been linked to lower bone density and an increased risk of osteopenia or OP in women with oligomenorrhea, which is characterized by infrequent menstruation, usually defined as cycles occurring 35–40 days apart [19]. Additionally, according to research findings [18], there is a correlation between increased bone production and decreased bone resorption during the preovulatory and luteal periods, when estrogen levels rise. BMD declines significantly during late perimenopause and continues at a comparable rate through the early postmenopausal period [20]. In addition to the impact of decreased estrogen levels, current evidence suggests that bone loss during menopause may also be associated with increased serum follicle-stimulating hormone (FSH). Elevated FSH levels can stimulate osteoclastogenesis, promoting bone resorption through osteoclast activity [21]. Our research revealed that the chance of BMD loss increased with the length of the menstrual cycle. Longer menstrual cycles are frequently associated with prolonged follicular phases, delayed estrogen peaks, and lower mean estrogen levels across the whole cycle [10]. This may also relate to FSH levels, potentially explaining the negative correlation between menstrual cycle length and BMD. An increasing body of evidence demonstrated that female bone metabolism is also significantly influenced by later menarche, a shorter time from menarche to menopause, and a higher number of births [22]. During pregnancy, the developing fetus relies solely on maternal bone minerals for calcium, challenging maternal BMD. To counteract this fetal-induced bone loss, the maternal body adapts by doubling intestinal calcium absorption. Research in this area has primarily concentrated on parity [23]. A cross-sectional study in Korean women revealed that having more children increases the risk of fractures related to osteoporosis [24]. Moreover, comparing data between studies is complicated by inconsistent definitions of normal, short, or long menstrual cycle (e.g., long menstrual cycle being ≥ 32 days [25] vs. > 45 days [26]) and variability in menstrual cycle length. Hence, additional investigation is warranted to elucidate the physiological mechanisms underlying these alterations.
The MR study has a number of advantages. Firstly, in this study, MR analysis was implemented to elucidate the connection, offering fresh insights into both the influence of menstrual cycle length on BMD and the early prevention of OP. To the best of our knowledge, this is the first MR study to evaluate the link between menstrual cycle length and BMD. Secondly, this study signifies a groundbreaking endeavor in exploring the correlation between menstrual cycle length and BMD by employing MR analyses, thereby expanding the horizon beyond conventional observational studies. However, despite these strengths, our study also had some limitations. Firstly, it is important to note that certain participants in the BMD GWAS did not solely represent individuals of European ancestry. This raises concerns regarding the reliability of our findings, as allele frequencies can vary significantly across different populations. Secondly, we acknowledge the limitations regarding demographic details such as childbirth history, occupation, and exposure to stress factors, which are not fully detailed in the current dataset.
In conclusion, this MR study provides valuable insights into the link between prolonged menstrual cycle length and decreased BMD. Our findings hold significance for clinical practice, suggesting that identifying abnormal menstrual patterns could facilitate the early detection of declining bone density. Such detection may enable timely interventions to prevent OP and promote overall bone health. As such, our study has important implications for both clinical management and public health strategies.