Introduction
Brown adipose tissue (BAT) is a type of fat tissue distinctive from white adipose tissue (WAT) in its ability to disperse energy through nonshivering thermogenesis, a process mediated by the presence of uncoupling protein 1 (UCP1) in the inner mitochondrial membrane, which is abundant in BAT [1]. Human active BAT has been found to be located in the extrascapular, cervical, mediastinal, and retroperitoneal regions in adults and in the extrascapular region in infants [2]. Accumulated evidence indicates that BAT activities resist obesity and its metabolic dysregulation. Interestingly, BAT-like cells can be induced throughout WAT through a process called “browning,” which expresses high levels of UCP1 [3]. These inducible BAT-like tissues are called “brite” or “beige” adipose tissues (bAT). Using a range of stimuli, bAT was found to act with high expression of UCP1 and a higher respiration rate [3]. Human bAT is present mainly in the subcutaneous WAT depots [4]. It has been demonstrated in rodents that browning of WAT (bAT) resists obesity and its metabolic complications [5]; however, this has not been verified in humans.
Assessment of BAT activities in the classic BAT areas in obese individuals by radiological images revealed that there is impairment and a decrease in the thermogenesis process in those individuals compared with non-obese individuals [6, 7]. However, whether there is also impairment in the browning process of WAT during obesity is unknown in humans.
Fibroblast growth factor type 21 (FGF21) is an endocrine hormone produced mainly by the liver through regulation of energy hemostasis and controlled adiposity [8]. Administering FGF21 to animal models reduces obesity and insulin resistance [9]. FGF21 has been found to be a powerful inducer of BAT activities and browning of WAT [10–12]. The association of serum FGF21 with bAT has not been confirmed in humans.
In the current study, we assessed whether the expression of BAT/bAT genes in subcutaneous tissues in obese patients is reduced compared with non-obese patients and to assess whether the expression of BAT/bAT genes is correlated with body mass index (BMI), blood lipids and FGF21.
Material and methods
Recruitment of participants
The study included 58 patients undergoing general surgery. Ethical approval of the study protocols was obtained from the Institutional Review Board (IRB) of the College of Medicine, King Saud University (Ref. No. 16/0283/IRB). Ethical and administrative approvals were also received from the research unit at Kingdom Hospital. Informed consent, approved by the IRB, was obtained from each participant after we explained the method, purpose of the study, and the potential risks associated with participation. Patients with acute or chronic current disease conditions, such as renal or cardiac disease or cancers, were excluded from the study. The demographic data (age, sex, etc.) were obtained from patient files. The confidentiality and anonymity of the participants’ obtained data were maintained during the study, including data obtained from all the study analytical protocols. Weight and height were measured using the available medical scales at Kingdom Hospital. The BMI was calculated from the weight and height, as previously described [13].
Sample collection and preservation
About 3 ml of venous blood was drawn by an expert phlebotomist into a gel separator tube from each participant. The tubes were then centrifuged at 4°C for 15 min at 1500 g within 30 min to obtain serum. The obtained serum was allocated and frozen at –80°C until biochemical analysis. A biopsy (1 gm) was obtained by the surgeon from subcutaneous fat tissue in the abdominal area at the same site of surgical incision. After extraction, the biopsies were impeded directly in an RNA stabilization solution (MCLAB, South San Francisco, CA, USA) and frozen at –80°C until analysis.
RNA extraction
A combination of guanidinium thiocyanate-phenol-chloroform extraction and column-based methods was used. In brief, around 1 ml of TRIGent (CAT. No. K5161, Biomatik, Wilmington, DE, USA) was added to 50–100 mg of tissue in a small micro tube. Then, the samples were homogenized using a power homogenizer. After 10 min of incubation at room temperature with intermittent vortexing, 200 μl of chloroform (Sigma-Aldrich, St. Louis, MO, USA) was added to each tube. The tubes were then vortexed for 30 s and incubated at room temperature for 5 min. This was followed by centrifugation for 10–15 min at 12,000 g for phase separation, after which the upper aqueous layer was transferred to a new tube. About 500 μl of isopropanol was added to the aqueous phase. After incubation at room temperature for 10 min, the tube was transferred to a spin column (Jena Bioscience, Jena, Germany) and then centrifuged for 1 min at 8000 g to precipitate RNA. The precipitated RNA in the column was washed twice by adding 0.5 ml of 70% ethanol before additional centrifugation at 11,000 for 2 min. The RNA was eluted by adding 30 to 50 μl of PCR grade water to the column and then incubated at room temperature for 2 min. Following this, the precipitated RNA was centrifuged again at 10,000 for 2 min. The RNA quality and quantity were measured using NanoDrop ND-1000 UV-VIS Spectrophotometer version 3.2.1. The RNA quality was > 1.8 of the A260/280 ratio. Then, the RNA was stored at –80°C until used.
Reverse transcription and real-time PCR
The RNA was transcribed to cDNA using the Script cDNA synthesis kit (Cat. No. PCR-511L, Jena Bioscience) according to the manufacturer’s instructions. In brief, around 1000 ng of RNA was added to the cDNA synthesis reaction mix before incubation using the thermal cycler at 50°C for 60 min. The resulting cDNA was stored at –20°C. The cDNA was used in a real-time PCR reaction using a real-time green master mix (SYPER Green equivalent) with a lowROX kit (Cat. No. PCR-316L, Jena Bioscience), according to the manufacturer’s instructions. To give a brief summary of the process, about 1000 ng of cDNA and the primer set were added to the PCR reaction mix. After brief centrifugation, the reaction was run using the qTOWER³ real-time PCR system (Analytik Jena, Jena, Germany) available at Stem Cells Research Center at College of Medicine at King Saud University. The thermal conditions were 10 min at 94°C for initial denaturation and polymerase activation, followed by 40 cycles of 20 s denaturing (94°C) and 60 s annealing/elongation (62°C). The primer sequences are listed in Table I. All reactions were run in triplicate. The β-actin mRNA expression level was used to normalize the mRNA expression of the other genes. The comparative Ct (2–∆∆ Ct) method was used to calculate the fold change in the expression of the genes of interest.
Table I
Sequences of primers used in this study
Biochemical analysis
Serum FGF21 was assessed using the human serum FGF21 ELISA kit (Catalog No. EF3021-1, Assaypro, St. Charles, MO, USA), according to the manufacturer’s instructions. Blood lipid profile was measured in the obtained sera using the Dimension Vista 1500 System (Siemens Healthcare, Malvern, PA, USA) available at King Khaled University Hospital (KKUH) laboratory department at King Saud University.
Statistical analysis
The GraphPad Prism 7.04 software (GraphPad, San Diego, CA, USA) was used in all the data analyses. The data were presented as mean and standard deviation if normally distributed and as median and range if abnormally distributed (Anderson-Darling normality test). The differences between the groups were assessed using the Kruskal-Wallis (nonparametric) test followed by Dunn’s multiple comparison test if not normally distributed and by an ANOVA test if normally distributed. A Spearman correlation test (nonparametric) was used to assess whether there was a correlation between the study variables. The result was considered significant if p < 0.05.
Results
Characteristics of study participants
The characteristics of the participants of this study are presented in Table II. A total of 58 surgical patients were involved. Twenty-three were undergoing laparoscopic sleeve gastrectomy, 16 were undergoing abdominal hernia repair, and 19 were undergoing laparoscopic cholecystectomy. The mean age was 32 ±7.5 years, and the mean BMI was 33.7 ±8 kg/m2. The male percentage was 25%. To facilitate comparisons, participants were grouped according to their BMI into 4 groups: a normal weight group (BMI 18–25 kg/m2), an overweight group (BMI 25–30 kg/m2), an obese group (BMI 30–35 kg/m2), and a morbidly obese group (BMI > 35 kg/m2). All laparoscopic sleeve gastrectomy patients belonged to the morbidly obese group, while the hernia and cholecystectomy patients belonged to the remaining groups. There was no significant difference in age or sex among the groups. Further, the groups were comparable in blood pressure and blood lipid profile, except for cholesterol, which was lower in patients belonging to the overweight group (p = 0.02).
Table II
Characteristics of the study participants
| Parameter | Normal weight (n = 10) | Overweight (n = 15) | Obese (n = 10) | Morbidly obese (n = 23) | P-value |
|---|---|---|---|---|---|
| Age [years] | 29.9 ±8 | 30.5 ±6.7 | 34.3 ±7.5 | 34.2 ±5.5 | 0.23 |
| Male (%) | 20 | 26 | 20 | 27 | 0.89 |
| BMI [kg/m2] | 24.5 ±0.9 | 27.1 ±1.2 | 33.9 ±1.9 | 42.2 ±5.5 | < 0.00001* |
| Cholesterol [mmol/l] | 3.9 ±0.5 | 2.4 ±0.4 | 4.5 ±0.9 | 4.0 ±0.6 | 0.02* |
| HDL [mmol/l] | 0.9 ±0.3 | 0.7 ±0.1 | 1.0 ±0.1 | 1.0 ±0.2 | 1.2 |
| Triglycerides [mmol/l] | 1.7 ±0.5 | 1.7 ±0.3 | 1.1 ±0.4 | 1.0 ±0.3 | 0.1 |
| LDL [mmol/l] | 3.0 ±0.6 | 3.1 ±0.8 | 3.1 ±0.9 | 3.1 ±0.8 | 0.15 |
| Systolic BP [mm Hg] | 118 ±14 | 120 ±15 | 115 ±12 | 115 ±12 | 0.11 |
| Diastolic BP [mm Hg] | 71 ±12 | 70 ±9 | 71 ±13 | 69 ±10 | 0.8 |
Expression of BAT/bAT genes in abdominal subcutaneous WAT
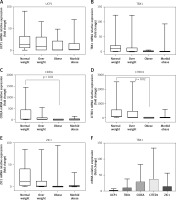
The expression levels of the selected BAT/bAT genes are presented in Figure 1. Although there was higher expression of BAT/bAT genes in the groups with a lower BMI (< 30 kg/m2) compared with the groups with a higher BMI (> 30 kg/m2), the difference was not significant. The mean expression of all the BAT/bAT genes was higher in the normal weight group and overweight groups compared with the obese and morbidly obese group. A statistically significant difference was found only in the expression of CIDEA and CITED1 between the normal weight and the obese group (p = 0.01 and p = 0.02, respectively), while there was no statistically significant difference in the expression of UCP1, TBX1, and ZIC1 among the groups. We found that the CITED1 and CIDEA genes had higher expression (fold change) compared with other BAT/bAT genes, but this was also statistically insignificant (p > 0.05). Also, the correlations between the expression levels of BAT/bAT genes were high (r = 0.6–0.8, p < 0.001), although the data are not shown here. Interestingly, female patients demonstrated higher expression of UCP1 (p = 0.03) and CITED1 (p = 0.06) compared with male patients. In addition, there was no significant effect of age on BAT/bAT gene expression (p = 0.11; data not shown). The medical diagnosis also had no effect on gene expression (p > 0.05).
Figure 1
Relative expression of BAT/bAT genes (fold change) in abdominal subcutaneous WAT of surgical patients. A, B, C, D and E represent the median relative expression of UCP1, TBX1, CIDEA, CITED1 and ZIC1, respectively. Significant differences were found in CIDEA expression, which was significantly higher in the normal weight group than the obese group (p = 0.01), and in CITED1 expression, which was higher in the normal weight group than the obese group (p = 0.02). Other genes (UCP1, TBX1 and ZIC1) did not show a significant difference among the groups. F represents the median fold change relative expression of different BAT genes. The highest expression level was observed for the CITED1 gene followed by the CIDEA gene, and the least expressed gene was UCP1, but this was statistically not significant. *Statistically significant at p < 0.05.

Correlation of BAT genes’ expression with BMI
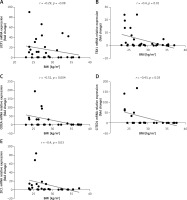
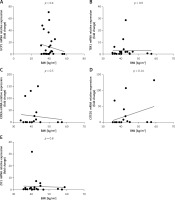
Figure 2 presents the relationship between BAT/bAT genes’ expression (fold change) and BMI (excluding patients with morbid obesity; BMI > 35 kg/m2). We found a significant negative correlation between the expression of BAT genes and BMI. This correlation was not found in morbidly obese patients (BMI > 35 kg/m2). The strongest negative correlation was observed in the expression of CIDEA (r = –0.5, p = 0.004), followed by TBX1 (r = –0.4, p = 0.01), CITED1 and ZIC1 (r = –0.4, p = 0.03). However, the correlation of UCP1 with BMI remained insignificant (r = –0.29, p = 0.08). This is particularly noteworthy when including patients with BMI > 35 kg/m2, since the correlation decreased and became insignificant (p = 0.08) and, in addition, there was no association with BMI in patients with BMI > 35 kg/m2, as shown in Figure 3.
Figure 2
Relationship between BAT genes’ expression (fold change) and BMI, excluding patients with morbid obesity (BMI > 35 kg/m2). A, B, C, D, and E represent the correlation of relative expression of UCP1, TBX1, CIDEA, CITED1 and ZIC1 with BMI, respectively, excluding patients with BMI > 35 kg/m2. A significant negative correlation was found between the expression of BAT/bAT genes and BMI, except for UCP1, which showed an insignificant correlation with BMI (p = 0.08). Note that this correlation was not found in the patients with morbid obesity (BMI > 35 kg/m2). The strongest correlation with BMI was observed in CIDEA expression (p = 0.004). *Statistically significant at p < 0.05

Figure 3
Relationship between BAT/bAT genes’ expression (fold change) and BMI in patients with morbid obesity (BMI > 35 kg/m2). A, B, C, D, and E represent the correlation of relative expression of UCP1, TBX1, CIDEA, CITED1, and ZIC1 with BMI, respectively, in patients with morbid obesity (BMI > 35 kg/m2). No significant correlation was found between the expression of BAT genes and BMI. *Statistically significant at p < 0.05

Correlation between BAT/bAT genes’ expression and blood lipid profiles
Table III presents a summary of the correlation of BAT/bAT genes’ expression with patients’ blood lipid profiles. No significant correlation was found between the expression of BAT/bAT genes and blood lipid profile (p > 0.05).
Serum FGF21 correlation with BAT/bAT genes’ expression
Table IV summarizes the correlations of serum FGF21 with BAT/bAT genes’ expression. We found that serum FGF21 was positively and significantly associated with the expression of UCP1 (r = 0.56, p = 0.02) and TBX1 (r = 0.62, p = 0.01) in patients with BMI < 35 kg/m2. Also, serum FGF21 was positively associated with the expression of CITED1 and ZIC1, but it was not statistically significant (r = 0.5, p = 0.1 and r = 0.4, p = 0.09, respectively). In contrast, among patients with morbid obesity (BMI > 35 kg/m2), there was no significant correlation of FGF21 with BAT/bAT genes’ expression. Further, serum FGF21 was not associated with age, gender or BMI in our study (p > 0.05); however, those data are not shown here. Similarly, there was no significant difference in BMI among patients with low FGF21 (below median, < 0.25 ng/ml) or high FGF21 (above median, > 0.25 ng/ml; p = 0.6).
Table IV
Correlation summary of FGF21 with BAT/bAT genes’ expressions
| Values | UCP1 | TBX1 | CIDEA | CITED1 | ZIC1 | |
|---|---|---|---|---|---|---|
| BMI < 35 kg/m2 | r | 0.56 | 0.62 | 0.09 | 0.5 | 0.4 |
| p | 0.02* | 0.01* | 0.7 | 0.1 | 0.09 | |
| BMI > 35 kg/m2 | r | 0.09 | 0.13 | 0.17 | 0.07 | 0.3 |
| p | 0.7 | 0.5 | 0.5 | 0.7 | 0.8 | |
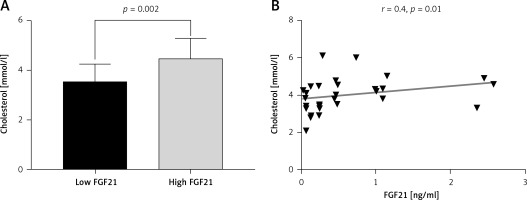
Figure 4 shows the correlation of serum FGF21 with serum cholesterol level. Serum FGF21 was positively associated with serum cholesterol level (r = 0.4, p = 0.01) among all patients (BMI > 35 kg/m2 and < 35 kg/m2), but it was not associated with values of other blood lipids (p > 0.05), although the data are not shown here. In concordance, we found that patients with higher FGF21 (above median, > 0.25 ng/ml) had a significantly higher blood cholesterol level than that of patients with lower FGF21 (below median, < 0.25 ng/ml) (p = 0.002); see Figure 4 B.
Figure 4
Correlation of serum FGF21 with blood cholesterol level. A – shows that serum FGF21 is positively associated with blood cholesterol level, regardless of a patient’s BMI (p = 0.01). B – shows that patients with a lower FGF21 level (< 0.25 ng/ml) had significantly lower blood cholesterol (p = 0.002). Statistically significant at p < 0.05

Discussion
In the current study, we found that the expression of BAT/bAT genes is low and dysregulated in obese compared with non-obese individuals. Also, we found that expression of BAT/bAT genes (TBX1, CIDEA, CITED1 and ZIC1) in the subcutaneous tissues was inversely and significantly correlated with patient BMI. This association was not observed in morbidly obese patients (BMI > 35 kg/m2). However, this indicates an impairment in the browning process of subcutaneous tissues in obese individuals. It also indicates the importance of browning the subcutaneous tissues in maintaining body weight and preventing obesity in humans.
Moreover, the highest correlation with BMI was found in CIDEA expression (r = –0.5, p = 0.004). This finding is consistent with earlier studies among ischemic limb patients and patients with metabolic syndrome [14]. Here, we provide further evidence that the CIDEA expression inversely and strongly correlates with BMI among surgical patients undergoing hernia repair or cholecystectomy. In addition, we found that this correlation becomes insignificant in severely obese patients, indicating dysregulation of CIDEA expression during severe obesity. CIDEA is a common gene expressed in both BAT and bAT. Recently, it has been demonstrated that the expression of CIDEA in WAT is a direct indicator of the browning process [15]. Our finding of lower BMI with higher expression of CIDEA could be explained by an increase in the associated browning process in subcutaneous WAT, leading to a higher metabolic rate and energy expenditure. Although CIDEA is a known negative regulator of the thermogenesis process [15], higher expression of CIDEA in patients with lower BMI could be a negative feedback mechanism to counteract a high metabolic rate in those individuals through suppressing the thermogenesis process.
Further, TBX1 is a transcription factor highly expressed in bAT [16]. It plays an important role in differentiation processes of many tissue types [17]. Nevertheless, there are not enough data available about the role of TBX1 in adipose tissues. We found that TBX1 correlated negatively with BMI in patients without severe obesity. No earlier study had reported this correlation in humans. Similarly, CITED1, a non-DNA binding transcriptional co-regulator [18], was recently found to be a molecular marker that distinguishes bAT from other fat tissues [16]. CITED1 was found to correlate negatively with BMI in patients without severe obesity. This association has not been reported before.
Also, the expression of BAT specific gene (ZIC1) was negatively associated with BMI in patients without severe obesity. Previously, an in vitro study showed that the expression of ZIC1 is not changed between adipocytes derived from obese or lean individuals [19]. In contrast, our direct assessment of ZIC1 expression in WAT samples suggests that ZIC1 expression correlates with BMI inversely and has a role in browning of WAT in humans. Remarkably, the expression of UCP1 was correlated with BMI at insignificant levels (r = –0.29, p = 0.08). This was consistent with the findings of an earlier study among children [20]. However, it was found that UCP1 mRNA level is not an indicator of the thermogenesis process in bAT, and thermogenesis in bAT can occur independently of UCP1 [21]. To determine the role of mRNA of UCP1 (as well as other BAT/bAT genes) in the thermogenesis process, a functional assessment of cell respiration and bioenergetics is required. In addition, we found that the expression bAT-specific genes (TBX1 and CITED1) was highly correlated with the expression of BAT-specific gene (ZIC1; p < 0.0001). This suggests that the browning process requires the recruitment of BAT cells or BAT gene pathways as well. We also found that females have higher UCP1 expression compared with males (p = 0.03); this was consistent with an earlier study [22]. There was no effect of age on bAT/BAT genes’ expression.
Interestingly, BAT activation has been found to be a powerful tool in reducing blood lipids in mice [23, 24]. In contrast, our study demonstrates an insignificant correlation between the expression of BAT/bAT genes and blood lipid profiles. This finding is similar to an earlier study that reported no correlation found between CIDEA gene expression and blood lipid profile [14]. In our study, only the expression of CITED1 was negatively associated with the serum triglyceride level at an insignificant level (r = –0.37, p = 0.08).
Animal and in vitro studies have suggested that FGF21 is a powerful inducer of bAT in WAT, considered a promising anti-obesity agent due to its beneficial effects on body weight and metabolism [25]. In the current study, we found that the serum FGF21 level was positively associated with subcutaneous expression of UCP1 and TBX1, a correlation not found in severely obese patients. This finding was consistent with an earlier study among HIV patients that showed a correlation between FGF21 and UCP1 expression in subcutaneous tissues in the dorsocervical region [26]. Herein, however, we provide further evidence about the importance of FGF21 in inducing in (missing word!!!) human subcutaneous WAT.
The metabolic signaling of FGF21 is found to be impaired in obesity. However, it has been demonstrated that administering FGF21 to obese mice resulted in attenuated expression of FGF21 target genes compared with non-obese mice [27]. This led to the inference that obesity is an FGF21 resistive disorder. In addition, another study reported impairment in FGF21 lipogenic and anti-adipogenic actions in adipocytes isolated from obese type 2 diabetes patients [28]. In concordance with that, our study demonstrated that serum FGF21 was not associated with the expression of UCP1 and TBX1 in individuals with severe obesity (BMI > 35 kg/m2), suggesting impairment of the FGF21 signaling pathway. Another mechanism that could affect the FGF21 function during obesity is epigenetic methylation; however, it has recently been demonstrated that reducing FGF21 methylation in the liver enhances FGF21 expression after activation by peroxisome proliferator-activated receptors (PPAR), suggesting that reducing FGF21 methylation could be a potential mechanism for improving its function in resisting obesity [29].
In conclusion, we provide evidence that the expression of BAT/bAT (beige fat) in subcutaneous tissues is reduced in obese individuals, particularly the expression of CIDEA and CITED1. Our study is the first to demonstrate an association of TBX1, CITED1, and ZIC1 with BMI, while it is also the first to demonstrate an association of serum FGF21 with the expression of TBX1 in subcutaneous tissues in patients with BMI < 35 kg/m2.
Our study has several limitations: a low sample number, only abdominal subcutaneous tissues involved, and no comparison between different fat deposits. Furthermore, this was a descriptive study, unable to explain the underlying mechanisms of bAT regulation of body weight.
In view of the current evidence, we conclude that the dysfunction in the browning process of subcutaneous tissues may contribute to obesity pathogenesis. Finding a mechanism to correct BAT/bAT dysfunction, particularly in subcutaneous WAT, could be an effective way to treat obesity. As a fundamental step, it is important to enhance our understanding of physiological and pathophysiological mechanisms of bAT functions in human subcutaneous tissues. In conclusion, our data suggest that the browning of subcutaneous tissues in humans is reduced and dysregulated in obese individuals. Further studies are needed to enhance our understanding of the role of subcutaneous tissues in regulating body weight and metabolism in humans.


