Introduction
Oral squamous cell carcinoma (OSCC), a type of head and neck squamous cell carcinoma, is one of the most frequent malignant tumors globally [1, 2]. Oral squamous cell carcinoma has been reported to be affected by the context of alcohol abuse, smoking and human papillomavirus [3]. Despite the constant progress in diagnostic and treatment methods, the 5-year overall survival (OS) rate has remained unchanged for a 40-years period, at nearly 50% [4]. The histological grading including tumor, node and metastasis (TNM) classification is a routine standard for predicting the prognosis of OSCC, but the results are still unsatisfactory [5]. Hence, it is necessary to understand the molecular mechanisms of OSCC progression and identify novel biomarkers for OSCC prognosis, diagnosis and treatment.
Long non-coding RNAs (lncRNAs), as transcripts of longer than 200 nucleotides, have no protein-coding function [6]. It is now recognized that lncRNAs are involved in transcriptional control, chromatin remodeling, and protein or RNA molecule regulation [7]. Thus, lncRNAs are critical for diverse fundamental cellular processes (e.g. cell proliferation, invasion and differentiation) [8]. The specific expression of lncRNAs has been found in differentiated tissues or various cancers [9]. Furthermore, lncRNAs are closely implicated in the progression of different malignancies [10]. Particularly, long intergenic non-protein-coding RNA 1296 (LINC01296), a newly identified lncRNA, can function as an oncogenic driver to promote the development of multiple carcinomas such as colorectal cancer [11], bladder cancer [12] and esophageal squamous cell carcinoma [13] through complex molecular mechanisms. Thus, LINC01296 has been considered as a potential biomarker for the prognosis, diagnosis and treatment of cancers. Nonetheless, the effect of LINC01296 on OSCC remains unclear. Thus, the present study firstly measured the expression level of LINC01296 in OSCC tissues and cell lines, and determined the effect of LINC01296 on OSCC cell proliferation, migration, invasion, cycle and apoptosis.
LncRNAs compete with their target miRNAs by complementary sequences, which is the most important regulatory mechanism of lncRNAs [14]. Our primary results showed the potential binding sites between LINC01296 and miR-485-5p. Indeed, microRNA-485-5p (miR-485-5p) has been reported to function as a tumor suppressor in multiple cancers such as breast cancer [15], glioma [16] and gastric cancer [17]. Especially, Lin et al. indicated that miR-485-5p could inhibit the growth and survival of OSCC cells [18]. These results indicated that LINC01296 may be involved in OSCC progression and development through regulating miR-485-5p.
Furthermore, miRNAs mediate protein expression through binding with the 3′ untranslated regions (UTR) of the protein-coding genes, thereby regulating different cellular functions [19]. Our primary results also predicted the potential binding sites between miR-485-5p and p21 (RAC1) activated kinase 4 (PAK4). PAK4 belongs to the group-II p21 protein (Cdc42/Rac)-activated kinase (PAK) family of serine/threonine kinases, and is critical for the progression of many cancers including OSCC [20]. Based on our primary results and previous investigations, we thus speculated that LINC01296 might play significant roles in the progression of OSCC through regulating miR-485-5p and PAK4.
To test this hypotheses, we determined the expression and role of LINC01296 in OSCC tissues and cell lines. The cell viability, migration and invasion were determined by MTT, wound healing assay and transwell assay, respectively. Flow cytometry was used for detecting the cell cycle and apoptosis. Our study showed that LINC01296 acts as an oncogenic gene in OSCC progression and development. The underlying mechanism was then explored in the following analysis.
Material and methods
Clinical samples
Forty cases of OSCC tissues and adjacent normal tissues were collected from patients after surgery at the Affiliated Huaian No. 1 People’s Hospital of Nanjing Medical University. Before surgery, the patients received no treatment. The approval for the use of the samples was obtained from The Affiliated Huaian No. 1 People’s Hospital of Nanjing Medical University Ethical Committee. This study performed the processes following the approved guidelines and regulations. Informed written consent was obtained from all participants.
Cell lines and culture
Human oral mucosal epithelial cell line (NHOK) and OSCC cell lines (SCC-15, CAL-27, HSC-2, Tca8113 and SCC-9) were purchased from Shanghai Guandao Bioengineering Co., Ltd. (Shanghai, China). These cell lines were incubated in DMEM (Gibco, Grand Island, NY) containing 10% fetal bovine serum (FBS), and grown in a humidity incubator at 37°C with 5% CO2.
Cell transfections
siRNAs of LINC01296 (si-LINC01296-#1 and si-LINC01296-#2) and si-control (si-NC) were obtained from Invitrogen (Carlsbad, CA, USA). LINC01296 overexpression plasmid (pcDNA LINC01296) and plasmid control (pcDNA3.1) were synthesized by CoBioer (Nanjing, Jiangsu, China). MiR-485-5p mimics, mimic control (miR-NC), miR-485-5p inhibitor (miR-485-5p-inh) and inhibitor control (NC-inh) were purchased from GenePharma Co., Ltd. (Shanghai, China). For transfection, Lipofectamine 3000 (Invitrogen; Thermo Fisher Scientific, Inc., Carlsbad, CA, USA) was used. After transfection for 48 h, cells were collected for the following analysis.
Real-time quantitative reverse transcription PCR (RT-qPCR)
Total RNA was obtained from tissues and cells using the RNeasy Mini Kit (Qiagen, Valencia, CA). RNA was used to synthesize cDNA by reverse transcription using the QuantiTect Reverse Transcription Kit (Qiagen, Valencia, CA). The procedures were performed using the Applied Biosystems ViiA 7 Real-Time PCR System (Life Technologies, Carlsbad, CA, USA) with the SYBR Green PCR Kit (Life Technologies). Primer sequences are listed in Table I. Relative expression levels were evaluated by the comparative CT method (2–ΔΔCT) and the data were normalized to GAPDH.
Table I
Primer sequences
MTT (3-(4,5-dimethylthiazol-2-yl)-2,5-diphenyltetrazolium bromide) assay
Briefly, 48 h after transfection, OSCC cells were plated in 96-well plates (1 × 10⁴ cells per well, Corning Life Science, Tewksbury, MA, USA), and cultured for 24, 48, 72, 96 and 120 h, respectively. Next, we added MTT solution (5 mg/ml, 20 µl) into each well followed by incubating for 4 h, and then added DMSO to dissolve formazan crystals. The sample optical density was detected with a microplate reader (BioTek, Richmond, USA) at 490 nm.
Wound healing assay
After transfection for 48 h, the cells were seeded onto six-well plates and incubated to 90% confluence. After discarding the culture solution, the cell monolayer was scratched with a 200 µl sterile pipette tip, washed twice with PBS and then incubated in DMEM medium for another 24 h. Next, the samples were recorded under a TH4-200 inverted microscope (Olympus Corporation, Tokyo, Japan).
Transwell invasion assay
The cell invasion assay was performed in 8-µm transwell filters (EMD Millipore, Billerica, MA, USA) with Matrigel matrix gel. Briefly, 48 h after transfection, the cells were collected, re-suspended in serum-free medium and added to the upper chamber. DMEM medium with 10% FBS was added to the lower chamber. Following 24 h of incubation, the cells remaining in the upper chamber were cleaned up. We fixed the invading cells using 4% paraformaldehyde, and stained the cells with 0.05% crystal violet. Finally, the sample was recorded by a TH4-200 inverted microscope (Olympus Corporation, Tokyo, Japan).
Cell cycle and apoptosis detection
For cell cycle detection, OSCC cells were collected after transfection for 48 h, washed twice using PBS and fixed in ethanol overnight at 4°C. Next, the cells were lysed with 0.2% Triton X-100, centrifuged at 1200×g, and resuspended in PBS with RNase (10 mg/ml). Subsequently, the cells were stained with propidium iodide (PI) at 37°C for 30 min and determined by FACSCalibur (BD Biosciences, San Jose, CA, USA), followed by evaluating the ratio of cells in the G0/G1, S or G2/M phases.
For cell apoptosis detection, 48 h after transfection, the cells were harvested, resuspended in binding buffer (100 µl) and stained with Annexin V and PI (BD, Franklin Lakes, NJ, USA) in binding buffer (500 µl) avoiding light at room temperature for 10 min. Then, FACSCalibur (BD Biosciences, San Jose, CA, USA) was used to assess the sample.
Tumor xenograft formation assay
Twenty-four male BALB/c nude mice aged 6 weeks were obtained from the Experimental Animal Center of The Affiliated Huaian No. 1 People’s Hospital of Nanjing Medical University and maintained under pathogen-free conditions at 25°C with relative humidity of 45–55%. The approval for this animal experiment was obtained from the Committee of The Affiliated Huaian No. 1 People’s Hospital of Nanjing Medical University. shRNA LINC01296 and shRNA control (sh-ctrl) were synthesized by CoBioer (Nanjing, Jiangsu, China). HSC-2 cells and CAL-27 cells were stably transfected with control shRNA or sh-LINC01296 plasmid for 48 h. Subsequently, the cells were collected, suspended in serum-free DMEM medium (200 µl) and subcutaneously injected into the posterior flank of the mice. We randomly divided the mice into four groups (6 mice per group): HSC-2 cells transfected with sh-LINC01296, HSC-2 cells transfected with control shRNA, CAL-27 cells transfected with sh-LINC01296 and CAL-27 cells transfected with control shRNA. Tumor diameter was measured using a Vernier caliper every week. The following formula was applied to calculate the volume of the tumors: tumor volume (mm3) = (length × width2)/2. After 5 weeks of feeding, the mice were sacrificed using the cervical dislocation method, and the weight of the tumor was evaluated.
Luciferase activity assay
The sequences of LINC01296 or PAK4 containing the predicted miR-485-5p binding sites and mutated sequences were amplified by qRT-PCR. The PCR fragment was cloned into the pmirGLO vector (Promega, Madison, WI) to construct luciferase reporter vectors, designated as LINC01296 WT, LINC01296 Mut, PAK4 WT and PAK4 Mut. These luciferase reporter vectors were respectively co-transfected with miR-485-5p mimics or controls into OSCC cells with Lipofectamine 3000 (Invitrogen, California, USA) according to the manufacturer’s protocol. After transfection, the cells were incubated for 48 h, and collected for detection of luciferase activity by the Dual-Luciferase Reporter Assay System (Promega, CA, USA). Renilla luciferase was applied to normalize the luciferase intensity.
Western blot
Total protein from OSCC cells was extracted using RIPA lysis buffer (KeyGEN, Nanjing, China), centrifuged at 2.0 × 10⁴ g for 10 min and quantified by a BCA protein kit (Thermo, Waltham, MA, USA). Next, we equally separated the protein lysates on 10% SDS-PAGE gels, and then transferred the protein into PVDF membranes. After blocking with 5% skim milk powder, the membranes were incubated with primary antibodies against PAK4, cyclin D1, CDK2, CDK4, CDK6, cyclin E1, cleaved caspase 3, cleaved caspase 9, E-cadherin, N-cadherin, p-MEK, MEK, p-ERK, ERK and GAPDH overnight at 4°C. After washing twice with PBS, the membranes were cultured for 1 h with HRP-labeled IgG goat anti-rabbit secondary antibody at 37°C, and determined using an ECL Western blot kit (Thermo Fisher Scientific, USA). GAPDH was used as an internal reference.
RNA immunoprecipitation (RIP) assay
OSCC cell lysates were incubated with RIP buffer with magnetic beads conjugated with normal rabbit IgG (negative control) or human Ago2 antibody (Millipore, Bedford, MA). To isolate the immunoprecipitated RNA, the protein was digested by proteinase K. Finally, purified RNAs were analyzed by qRT-PCR.
Statistical analysis
Each experiment was carried out at least three times. All data were defined as means ± standard deviation (SD) and analyzed by SPSS 17.0 software. Student’s t-test was used to assess the significant difference between two groups, and the one-way analysis of variance (ANOVA) with Bonferroni post hoc test was used to evaluate the significant difference among multiple groups. Statistical significance was determined by a p-value less than 0.05.
Results
LINC01296 is up-regulated in OSCC tissues and cell lines
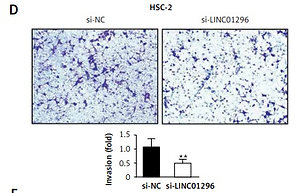
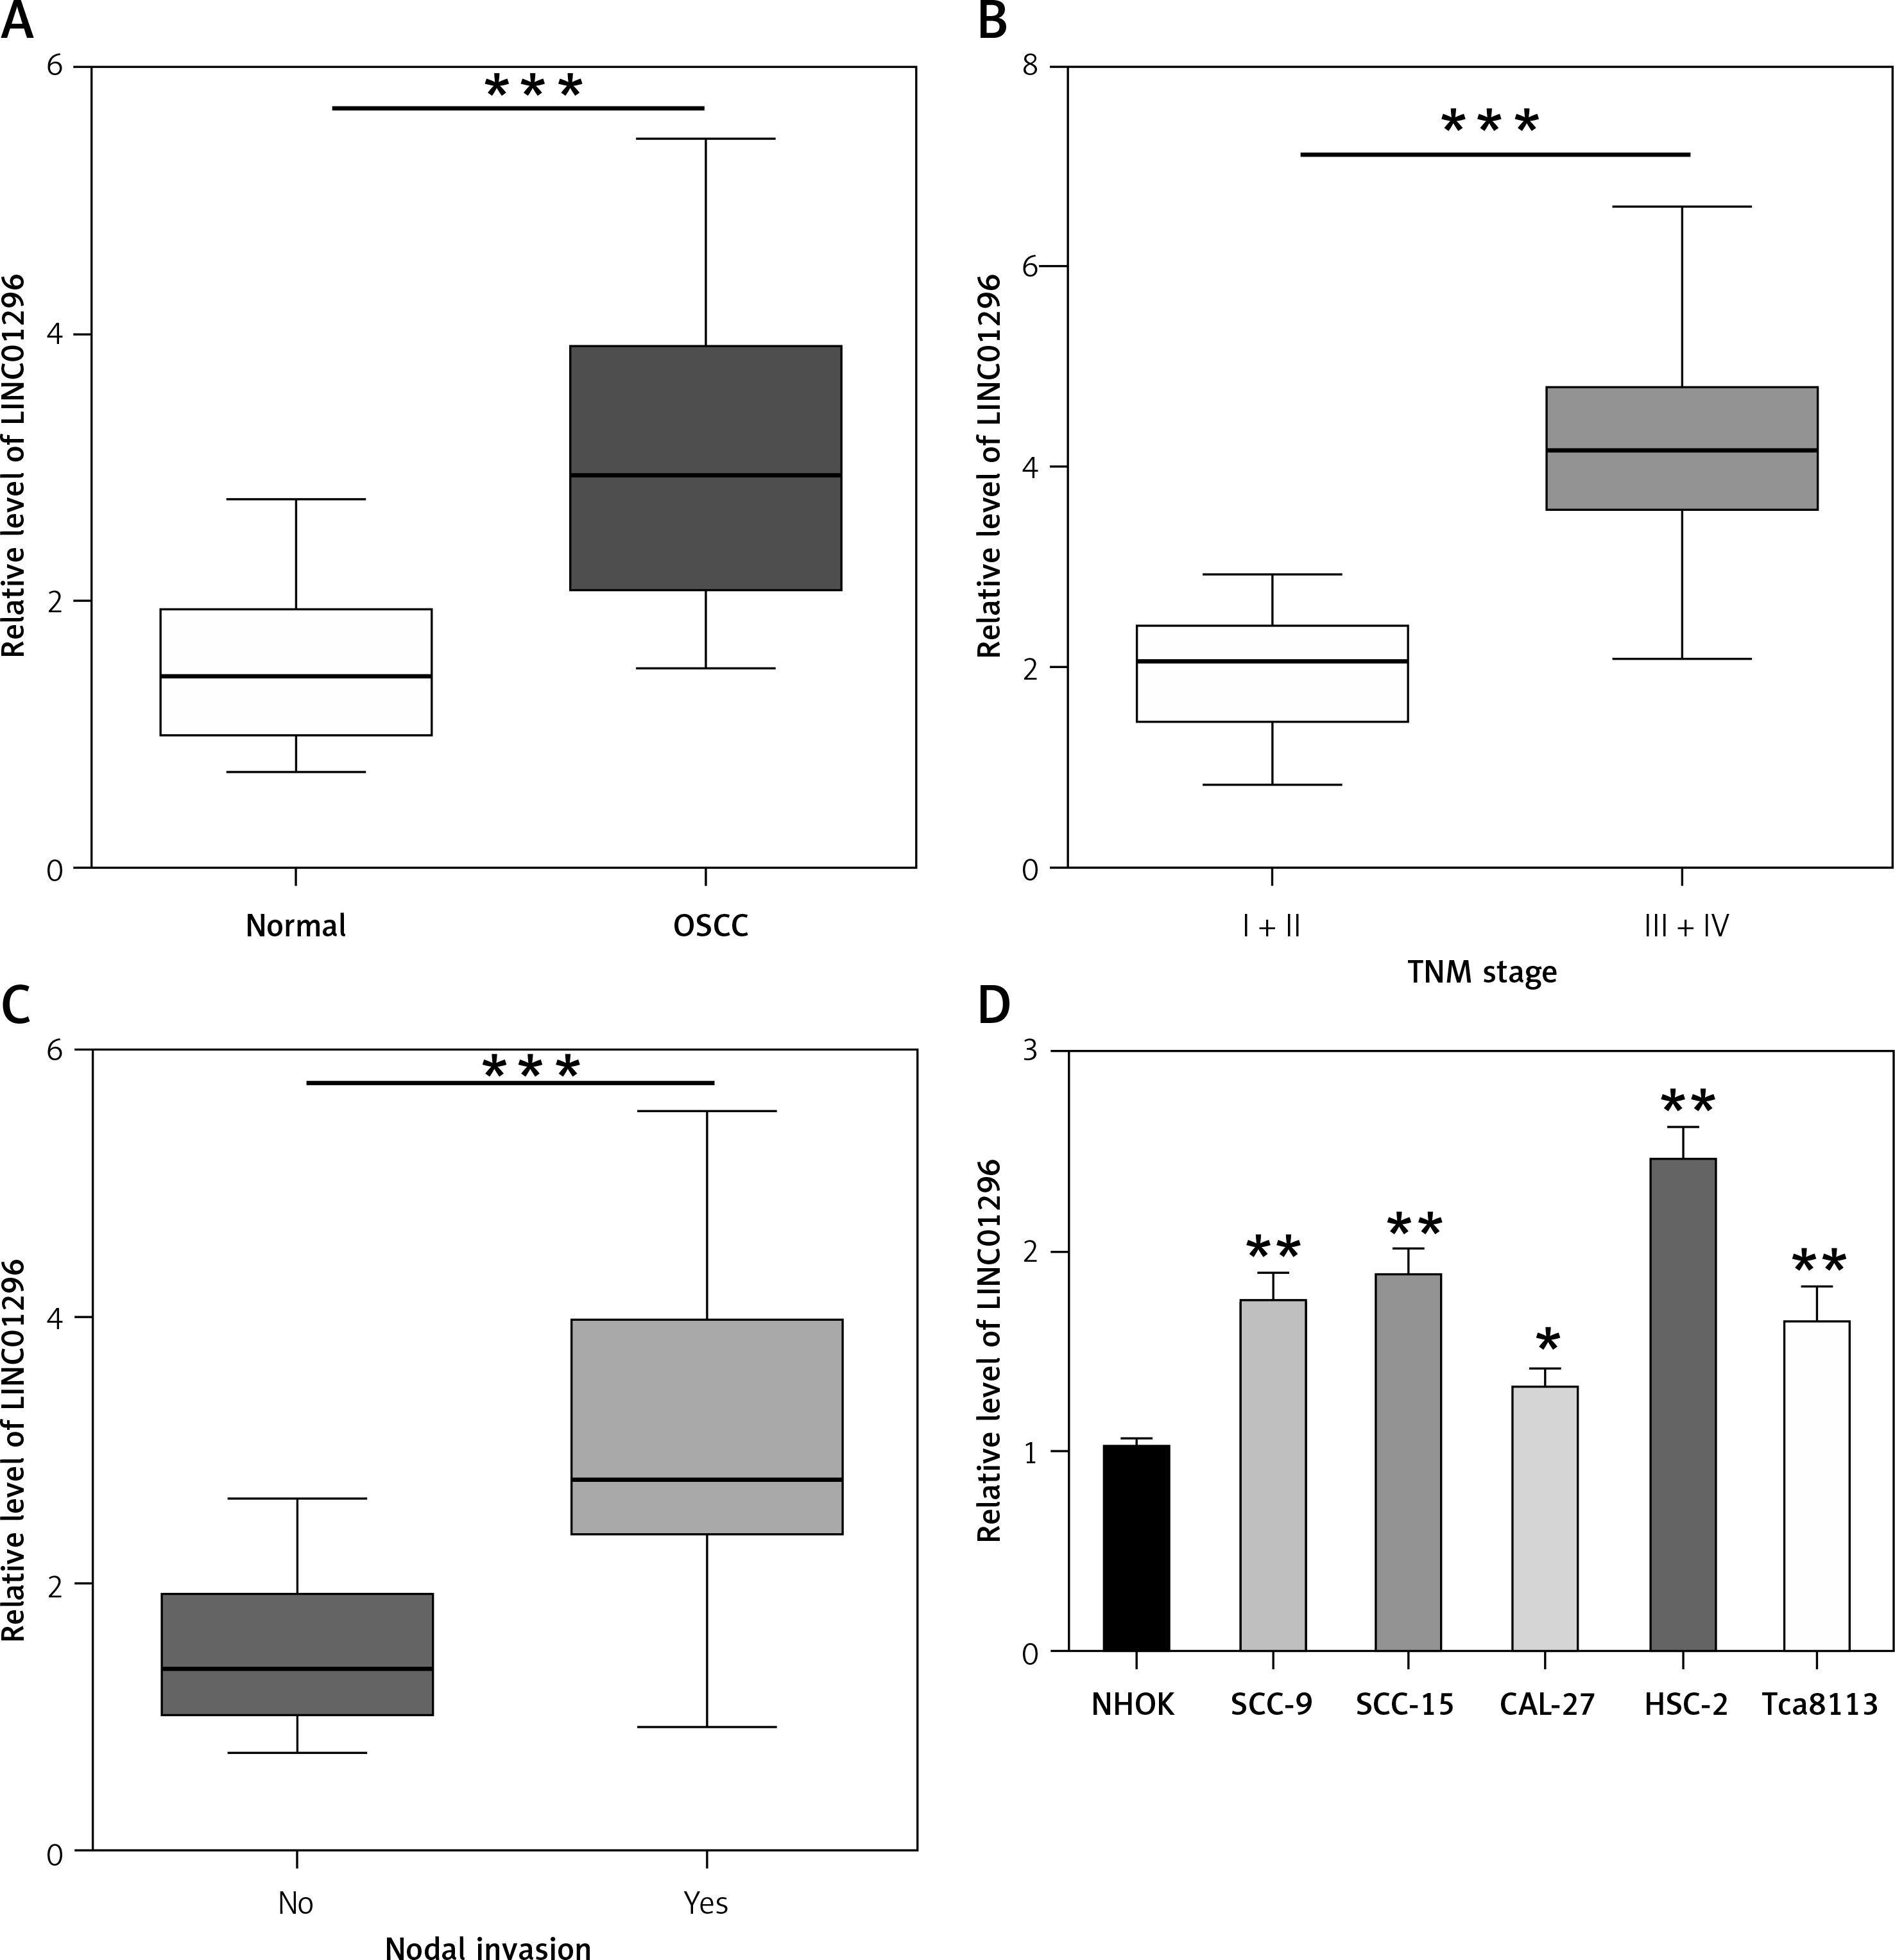
In this study, qRT-PCR was performed to detect the mRNA expression of LINC01296 in OSCC tissues and the adjacent normal tissues. As compared to the normal tissues, LINC01296 was highly expressed in OSCC tissues (Figure 1 A). Further investigation suggested that the level of LINC01296 was positively correlated with the patient’s tumor node metastasis (TNM) stage and nodal invasion (Figures 1 B, C). Additionally, LINC01296 was overexpressed in OSCC cell lines (SCC-9, SCC-15, CAL-27, HSC-2 and Tca8113) in comparison to human oral mucosal epithelial cell line NHOK (Figure 1 D). Given the ranking of the significant difference, typical cell lines HSC-2 and CAL-27 were selected for the following experiments. Collectively, LINC01296 was over-expressed in OSCC tissues and cell lines.
Figure 1
Expression level of LINC01296 in oral squamous cell carcinoma (OSCC). A – qRT-PCR was performed to determine the level of LINC01296 in OSCC tissues. The level of LINC01296 was positively correlated with the patient’s tumor node metastasis (TNM) stage (B) and nodal invasion (C). D – Expression of LINC01296 in OSCC cell lines was detected by qRT-PCR
***p < 0.001, **p < 0.01, *p < 0.05 versus control groups.
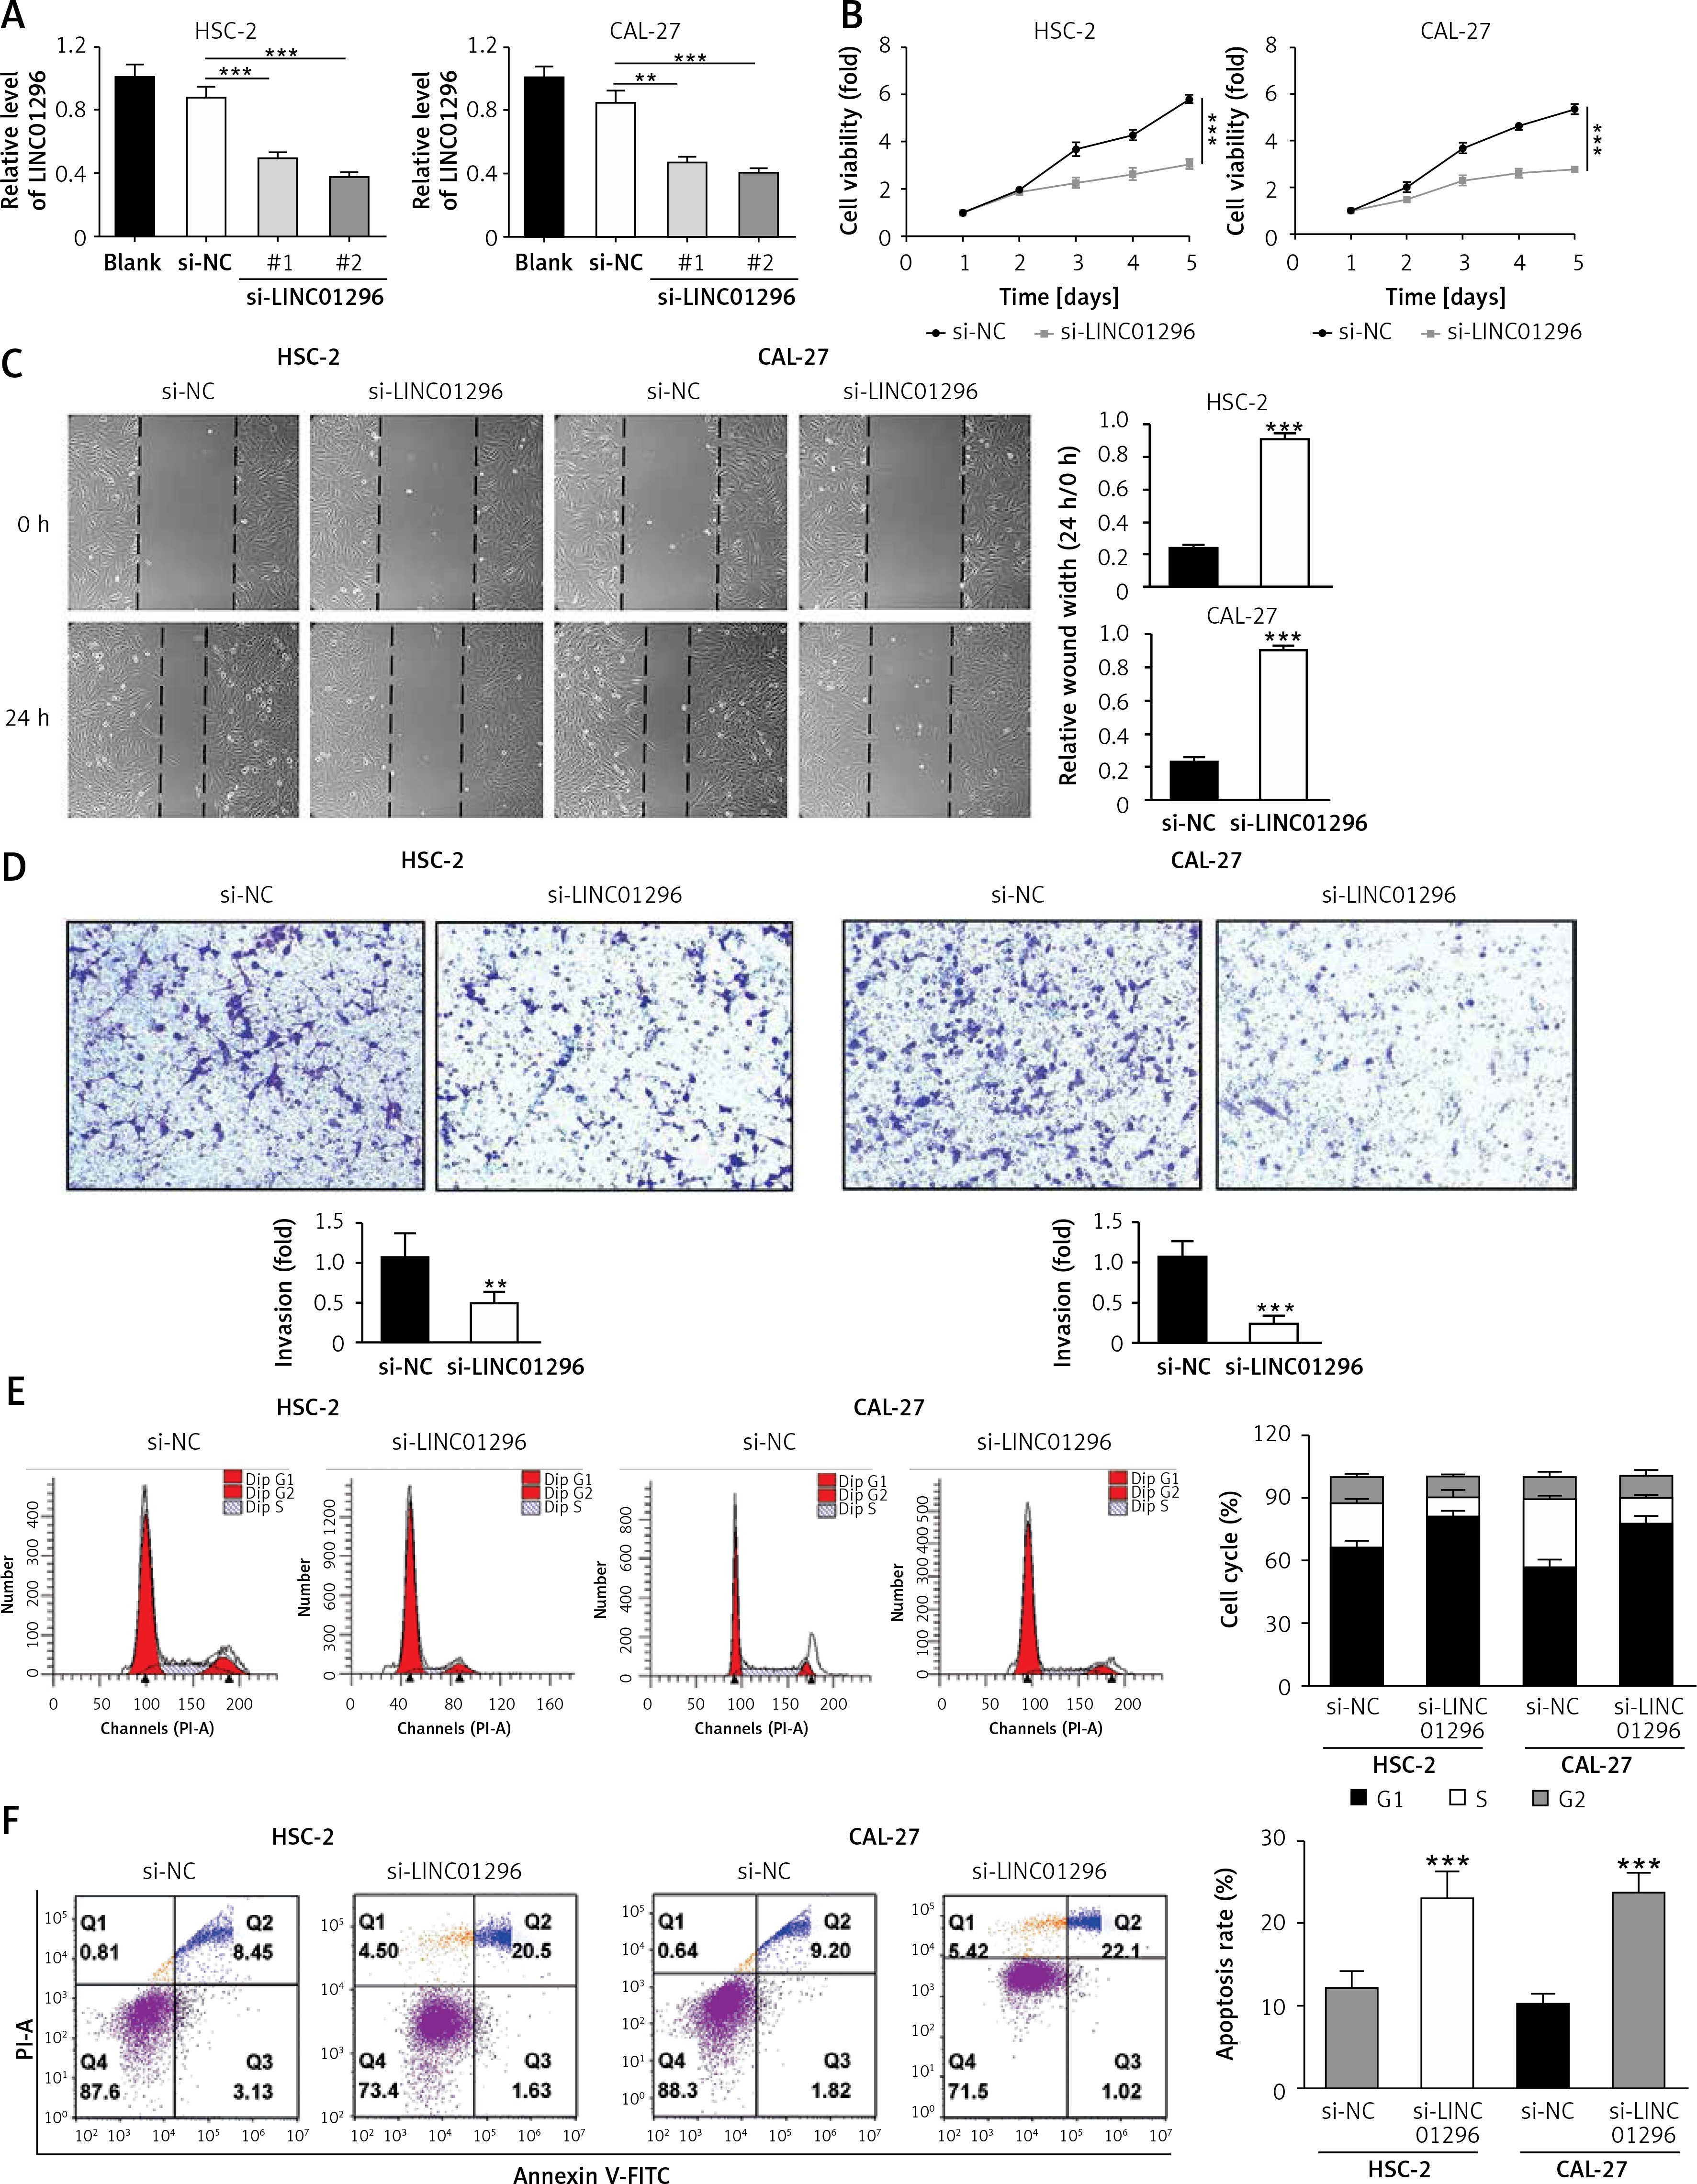
LINC01296 knockdown inhibits OSCC cell viability, migration and invasion but promotes OSCC cell apoptosis To explore the role of LINC01296 in OSCC cells, we examined the cell proliferation, migration, invasion, cycle and apoptosis, respectively. After HSC-2 and CAL-27 cell lines were transfected with siRNAs of LINC01296 (si-LINC01296-#1 and si-LINC01296-#2), si-control (si-NC) or blank for 48 h, LINC01296 siRNAs effectively inhibited the expression of LINC01296, especially si-LINC01296-#2 (Figure 2 A), which was chosen for the further experiments. MTT assay suggested that knockdown of LINC01296 considerably inhibited the viability of OSCC cells (Figure 2 B). Next, the effects of LINC01296 on OSCC cell migration and invasion, which are critical for cancer progression and metastasis, were examined using the wound healing assay and transwell invasion assay, respectively. Our study showed that knockdown of LINC01296 obviously suppressed OSCC cell migration and invasion (Figures 2 C, D). Furthermore, the cell cycle and apoptosis were determined using flow cytometry. As shown in Figure 2 E, the number of cells in G1 phase was markedly enhanced, whereas the number in S and G2 phases was obviously reduced in OSCC cells transfected with si-LINC01296 in comparison to the control group. Annexin V/PI double staining suggested that LINC01296 knockdown remarkably promoted the apoptosis of OSCC cells (Figure 2 F). Taken together, down-regulation of LINC01296 greatly inhibited OSCC cell proliferation, migration and invasion, and induced apoptosis.
Figure 2
The role of LINC01296 in OSCC cells. After HSC-2 and CAL-27 were transfected with siRNAs of LINC01296 (si-LINC01296-#1 and si-LINC01296-#2), si-control (si-NC) or blank, (A) the expression of LINC01296 was assessed by qRT-PCR; (B) cell viability was examined by MTT assay; (C) migration and (D) invasion of the cell lines were detected by wound healing assay and transwell assay, respectively; (E) cell cycle progression and (F) apoptosis were separately determined by flow cytometry
***p < 0.001, **p < 0.01 versus control group.
LINC01296 knockdown inhibits tumor growth in OSCC mice
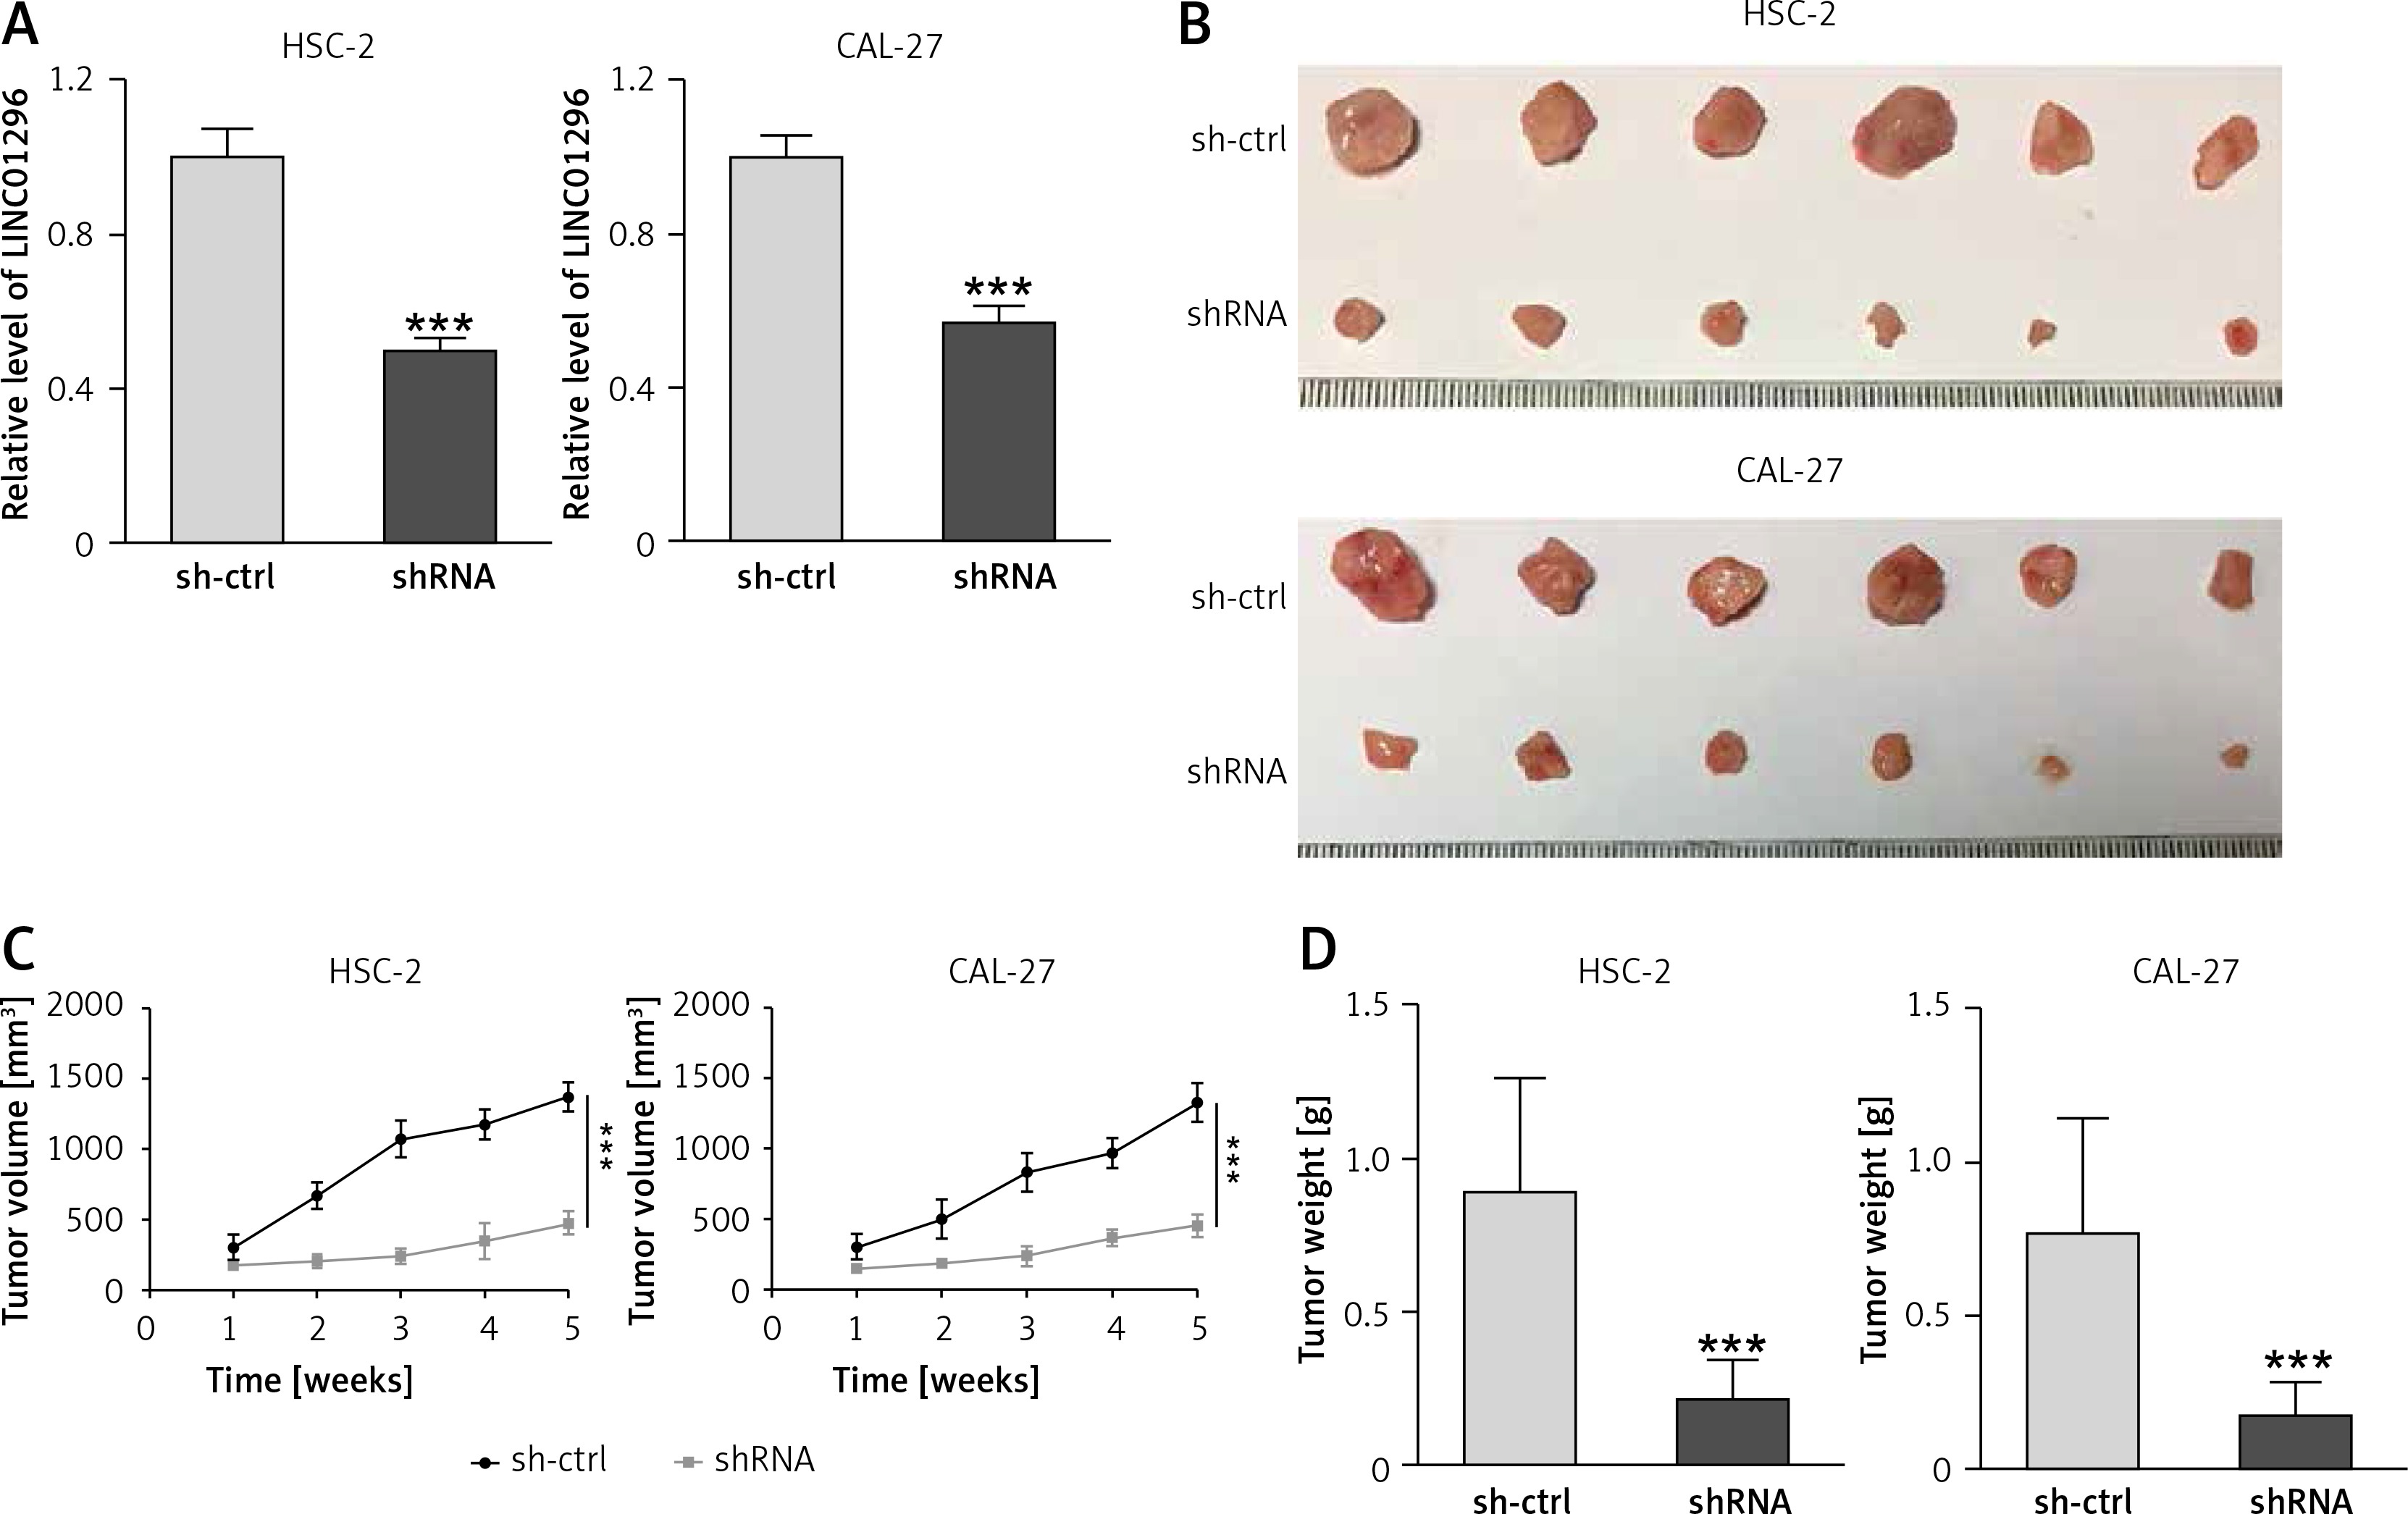
To examine the effect of LINC01296 on the growth of OSCC, HSC-2 and CAL-27 cell lines transfected with shRNA LINC01296 or shRNA control (sh-ctrl) were subcutaneously injected into the posterior flank of the mice. As shown in Figure 3 A, LINC01296 knockdown greatly decreased the expression of LINC01296, proving the effective transfection of shRNA LINC01296. After 5 weeks, a smaller size of the tumor was observed in shRNA LINC01296 group in comparison to the shRNA control group (Figure 3 B). Also, the tumor volume and weight in the shRNA LINC01296 group were considerably decreased as compared to the control group (Figures 3 C, D). Therefore, knockdown of LINC01296 inhibited the tumor growth in OSCC mice.
Figure 3
The effect of LINC01296 on tumor growth in OSCC mice. A – Relative expression of LINC01296 in HSC-2 and CAL-27 cell lines transfected with shRNA LINC01296 or shRNA control (sh-ctrl) was detected by qRT-PCR. B – Images of tumors obtaining from xenograft mice. C – Changes of tumor volume were recorded during the feeding period. D – Weight of OSCC tumors after treatment with shRNA LINC01296 or sh-ctrl
***p < 0.001, **p < 0.01 versus control group.
lncRNA LINC01296 acts as a competing endogenous RNA (ceRNA) for miR-485-5p
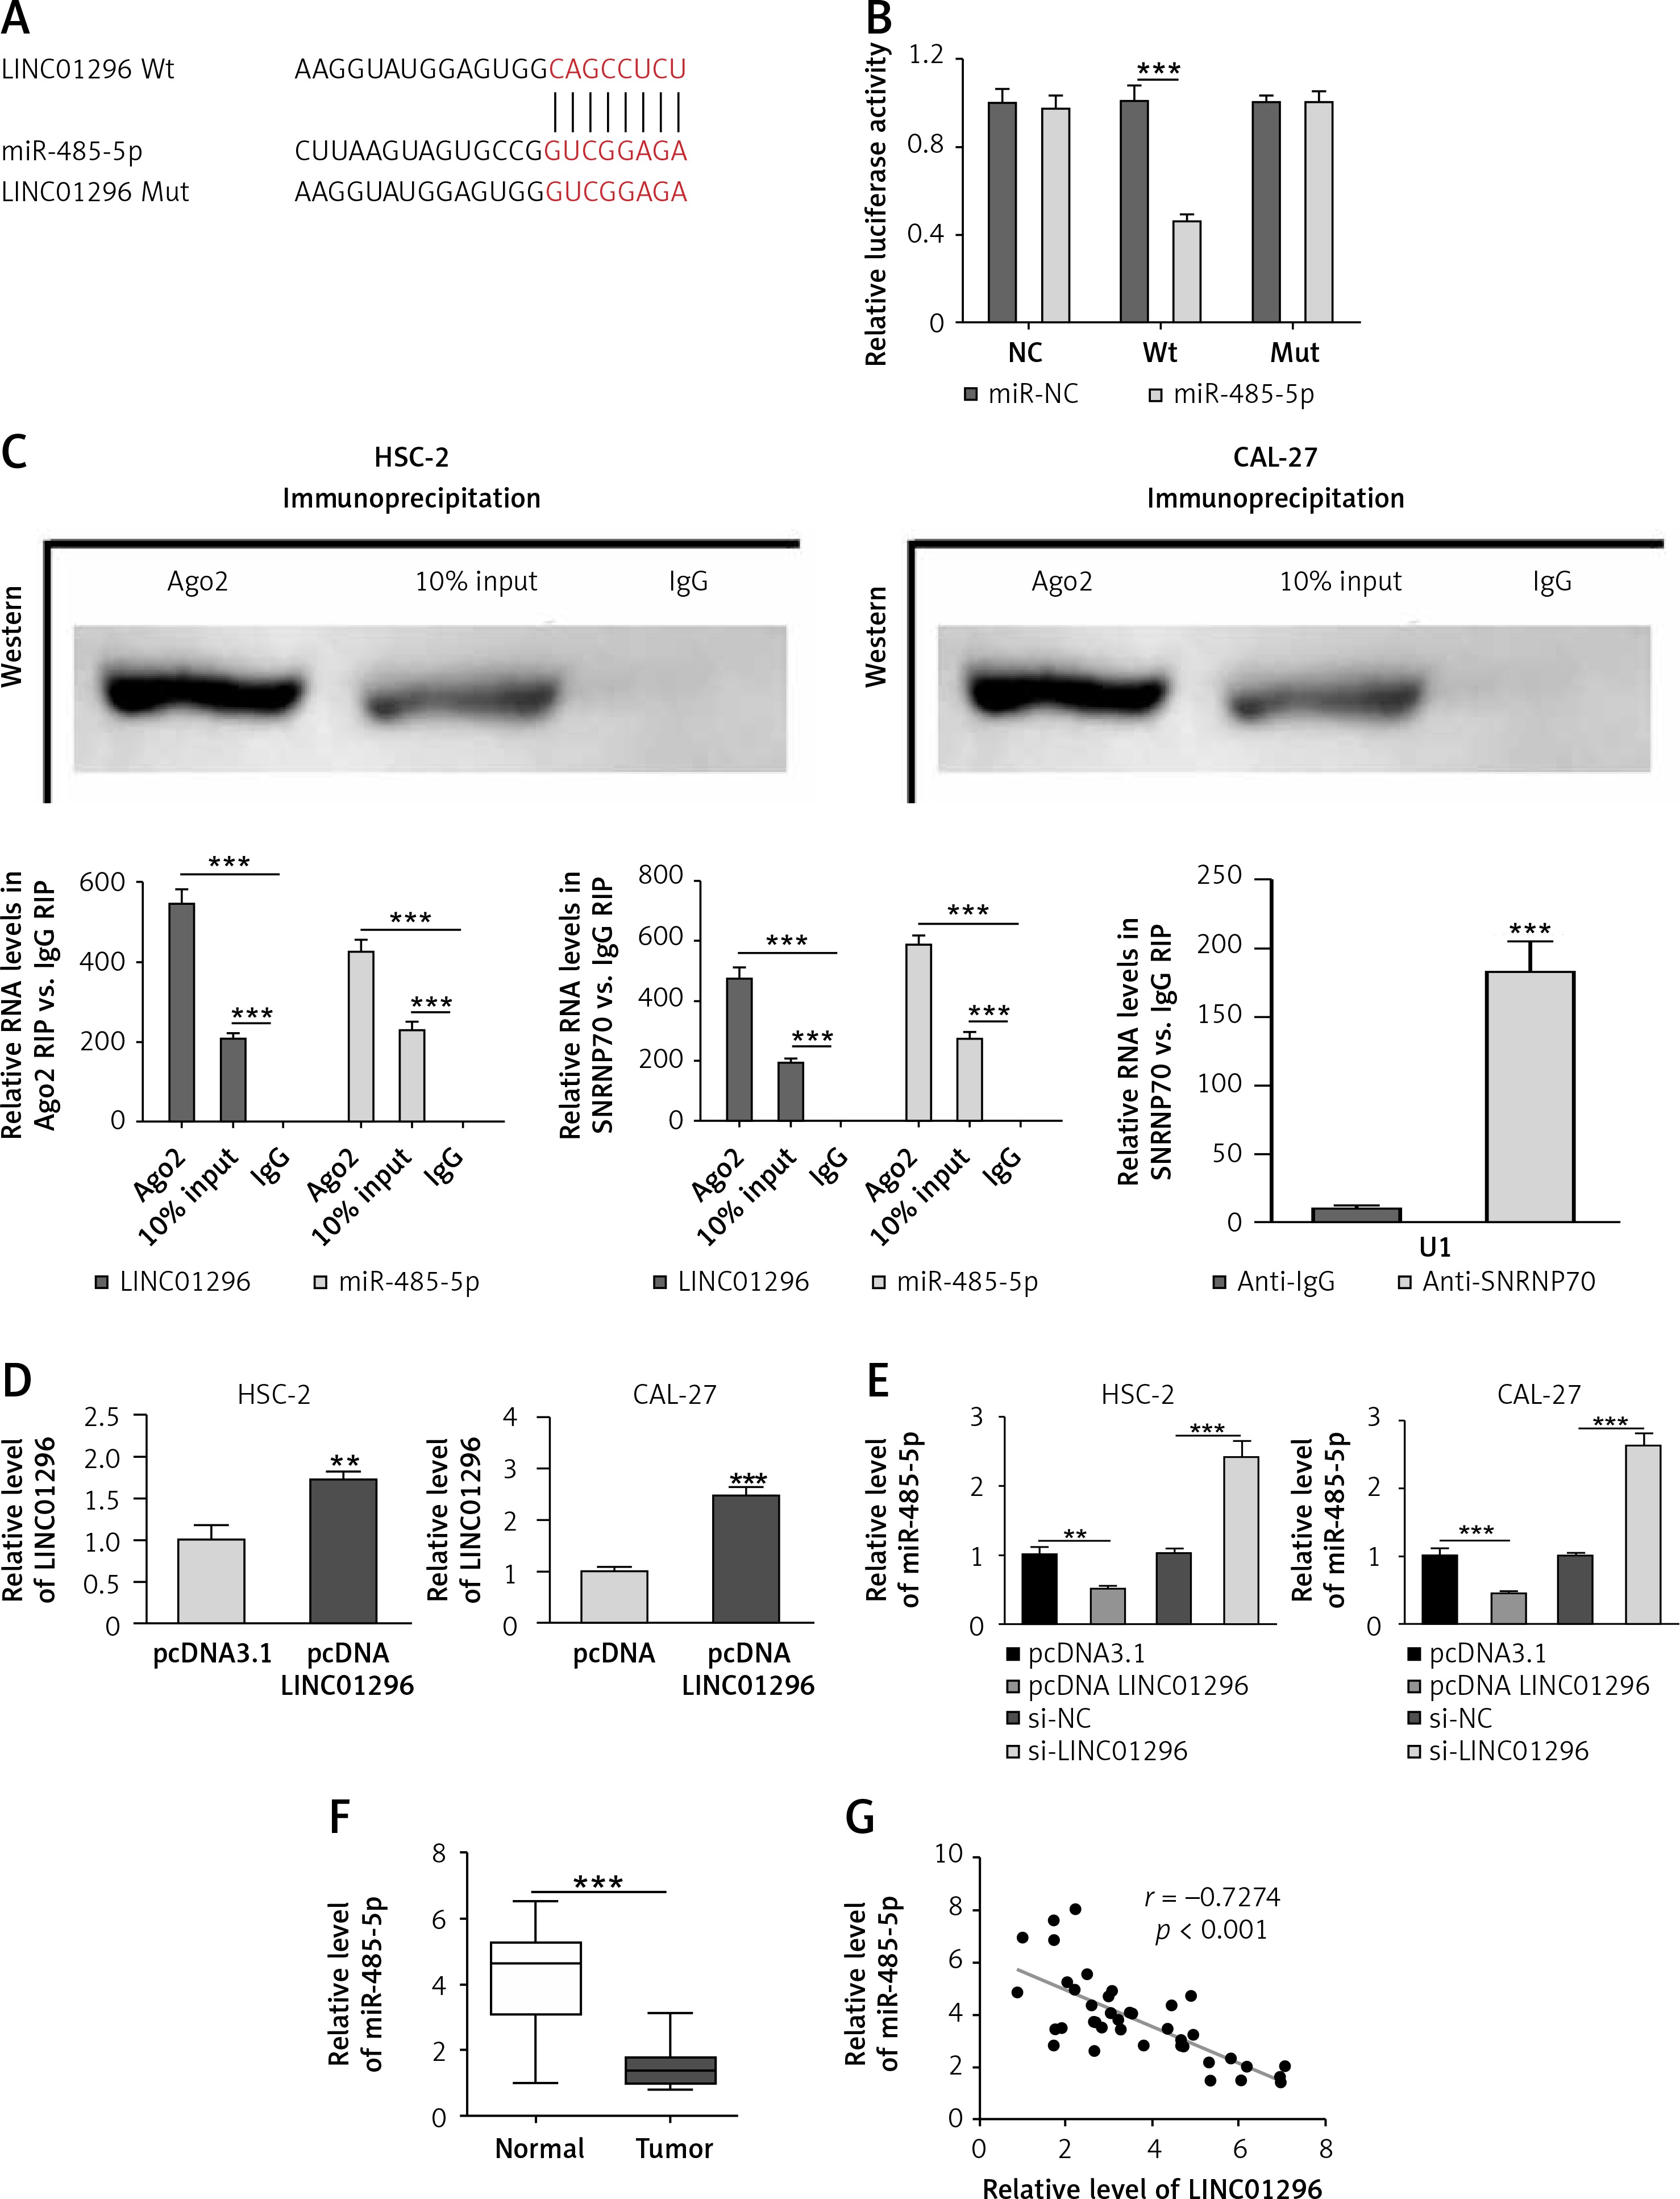
lncRNAs have been reported to act as ceRNAs for miRNAs to regulate the progression of various cancers [14]. To investigate whether LINC01296 can competitively sponge miRNAs to mediate OSCC progression, we used the miRDB website (http://mirdb.org/) to identify potential binding sites of LINC01296. Figure 4 A revealed the binding sites between miR-485-5p and LINC01296. To verify it, the luciferase reporter assay was performed. Figure 4 B shows that miR-485-5p mimics decreased the luciferase activity of the reporter with LINC01296 wild type (Wt), but showed no effect on the reporter containing LINC01296 mutant type (Mut). Further, the RIP assay was performed to confirm the relationship between LINC01296 and miR-485-5p. As Ago2 antibody could bind lncRNA and miRNA, the enrichment values of LINC01296 and miR-485-5p in the Ago2 antibody group were higher than those in the normal input antibody group (Figure 4 C). Subsequently, correlation analysis between LINC01296 and miR-485-5p was performed. Compared with the control plasmid (pcDNA3.1), the transfection of pcDNA LINC01296 significantly increased the level of LINC01296 in HSC-2 and CAL-27 cell lines (Figure 4 D). Then, qRT-PCR revealed that miR-485-5p level was remarkably decreased in OSCC cells transfected with pcDNA LINC01296 compared with pcDNA3.1, whereas the miR-485-5p level was obviously enhanced by the transfection of si-LINC01296 in comparison to si-control (Figure 4 E). Additionally, the expression of miR-485-5p was down-regulated in OSCC tissues in comparison with the normal tissues (Figure 4 F). The Pearson correlation analysis confirmed the negative correlation between LINC01296 and miR-485-5p (Figure 4 G). Therefore, LINC01296 could function as a ceRNA for miR-485-5p.
Figure 4
LINC01296 acts as a ceRNA for miR-485-5p. A – miRDB website was used to predict possible binding sites of LINC01296. B – Luciferase reporter assay and C – RIP assay were carried out to confirm the interaction between LINC01296 and miR-485-5p. D – Transfection of pcDNA LINC01296 was measured using qRT-PCR. Expression levels of miR-485-5p in (E) HSC-2 and CAL-27 cell lines with pcDNA LINC01296, pcDNA3.1, si-LINC01296 or si-NC transfection and in (F) OSCC tissues were determined by qRT-PCR. G – The correlation between LINC01296 and miR-485-5P was assessed by Pearson correlation analysis
***p < 0.001, **p < 0.01 versus control group.
PAK4 is identified to be a target of miR-485-5p
TargetScan was performed to predict the potential targets of miR-485-5p and PAK4 was predicted to be a candidate (Figure 5 A), and the luciferase reporter assay was first determined. The luciferase activity was greatly reduced after the transfection of miR-485-5p mimics in the PAK4 Wt group, whereas the transfection of miR-485-5p mimics in OSCC cells had no significant effect in PAK4 Mut and control groups (Figure 5 B). Hence, miR-485-5p could directly target PAK4.
Figure 5
PAK4 is identified as a target of miR-485-5p. A – Images of the potential binding sites between miR-485-5p and PAK4. B – The interaction between PAK4 and miR-485-5p was firstly determined via luciferase reporter assay. C – Transfection efficiency of miR-485-5p mimics or miR-485-5p inhibitor was evaluated by qRT-PCR. PAK4 expression level was measured by (D) qRT-PCR and (E) western blot, respectively. F – The level of PAK4 in OSCC tissues was assessed by qRT-PCR. Pearson correlation analysis suggested (G) a negative correlation between PAK4 and miR-485-5p and (H) a positive correlation with LINC01296
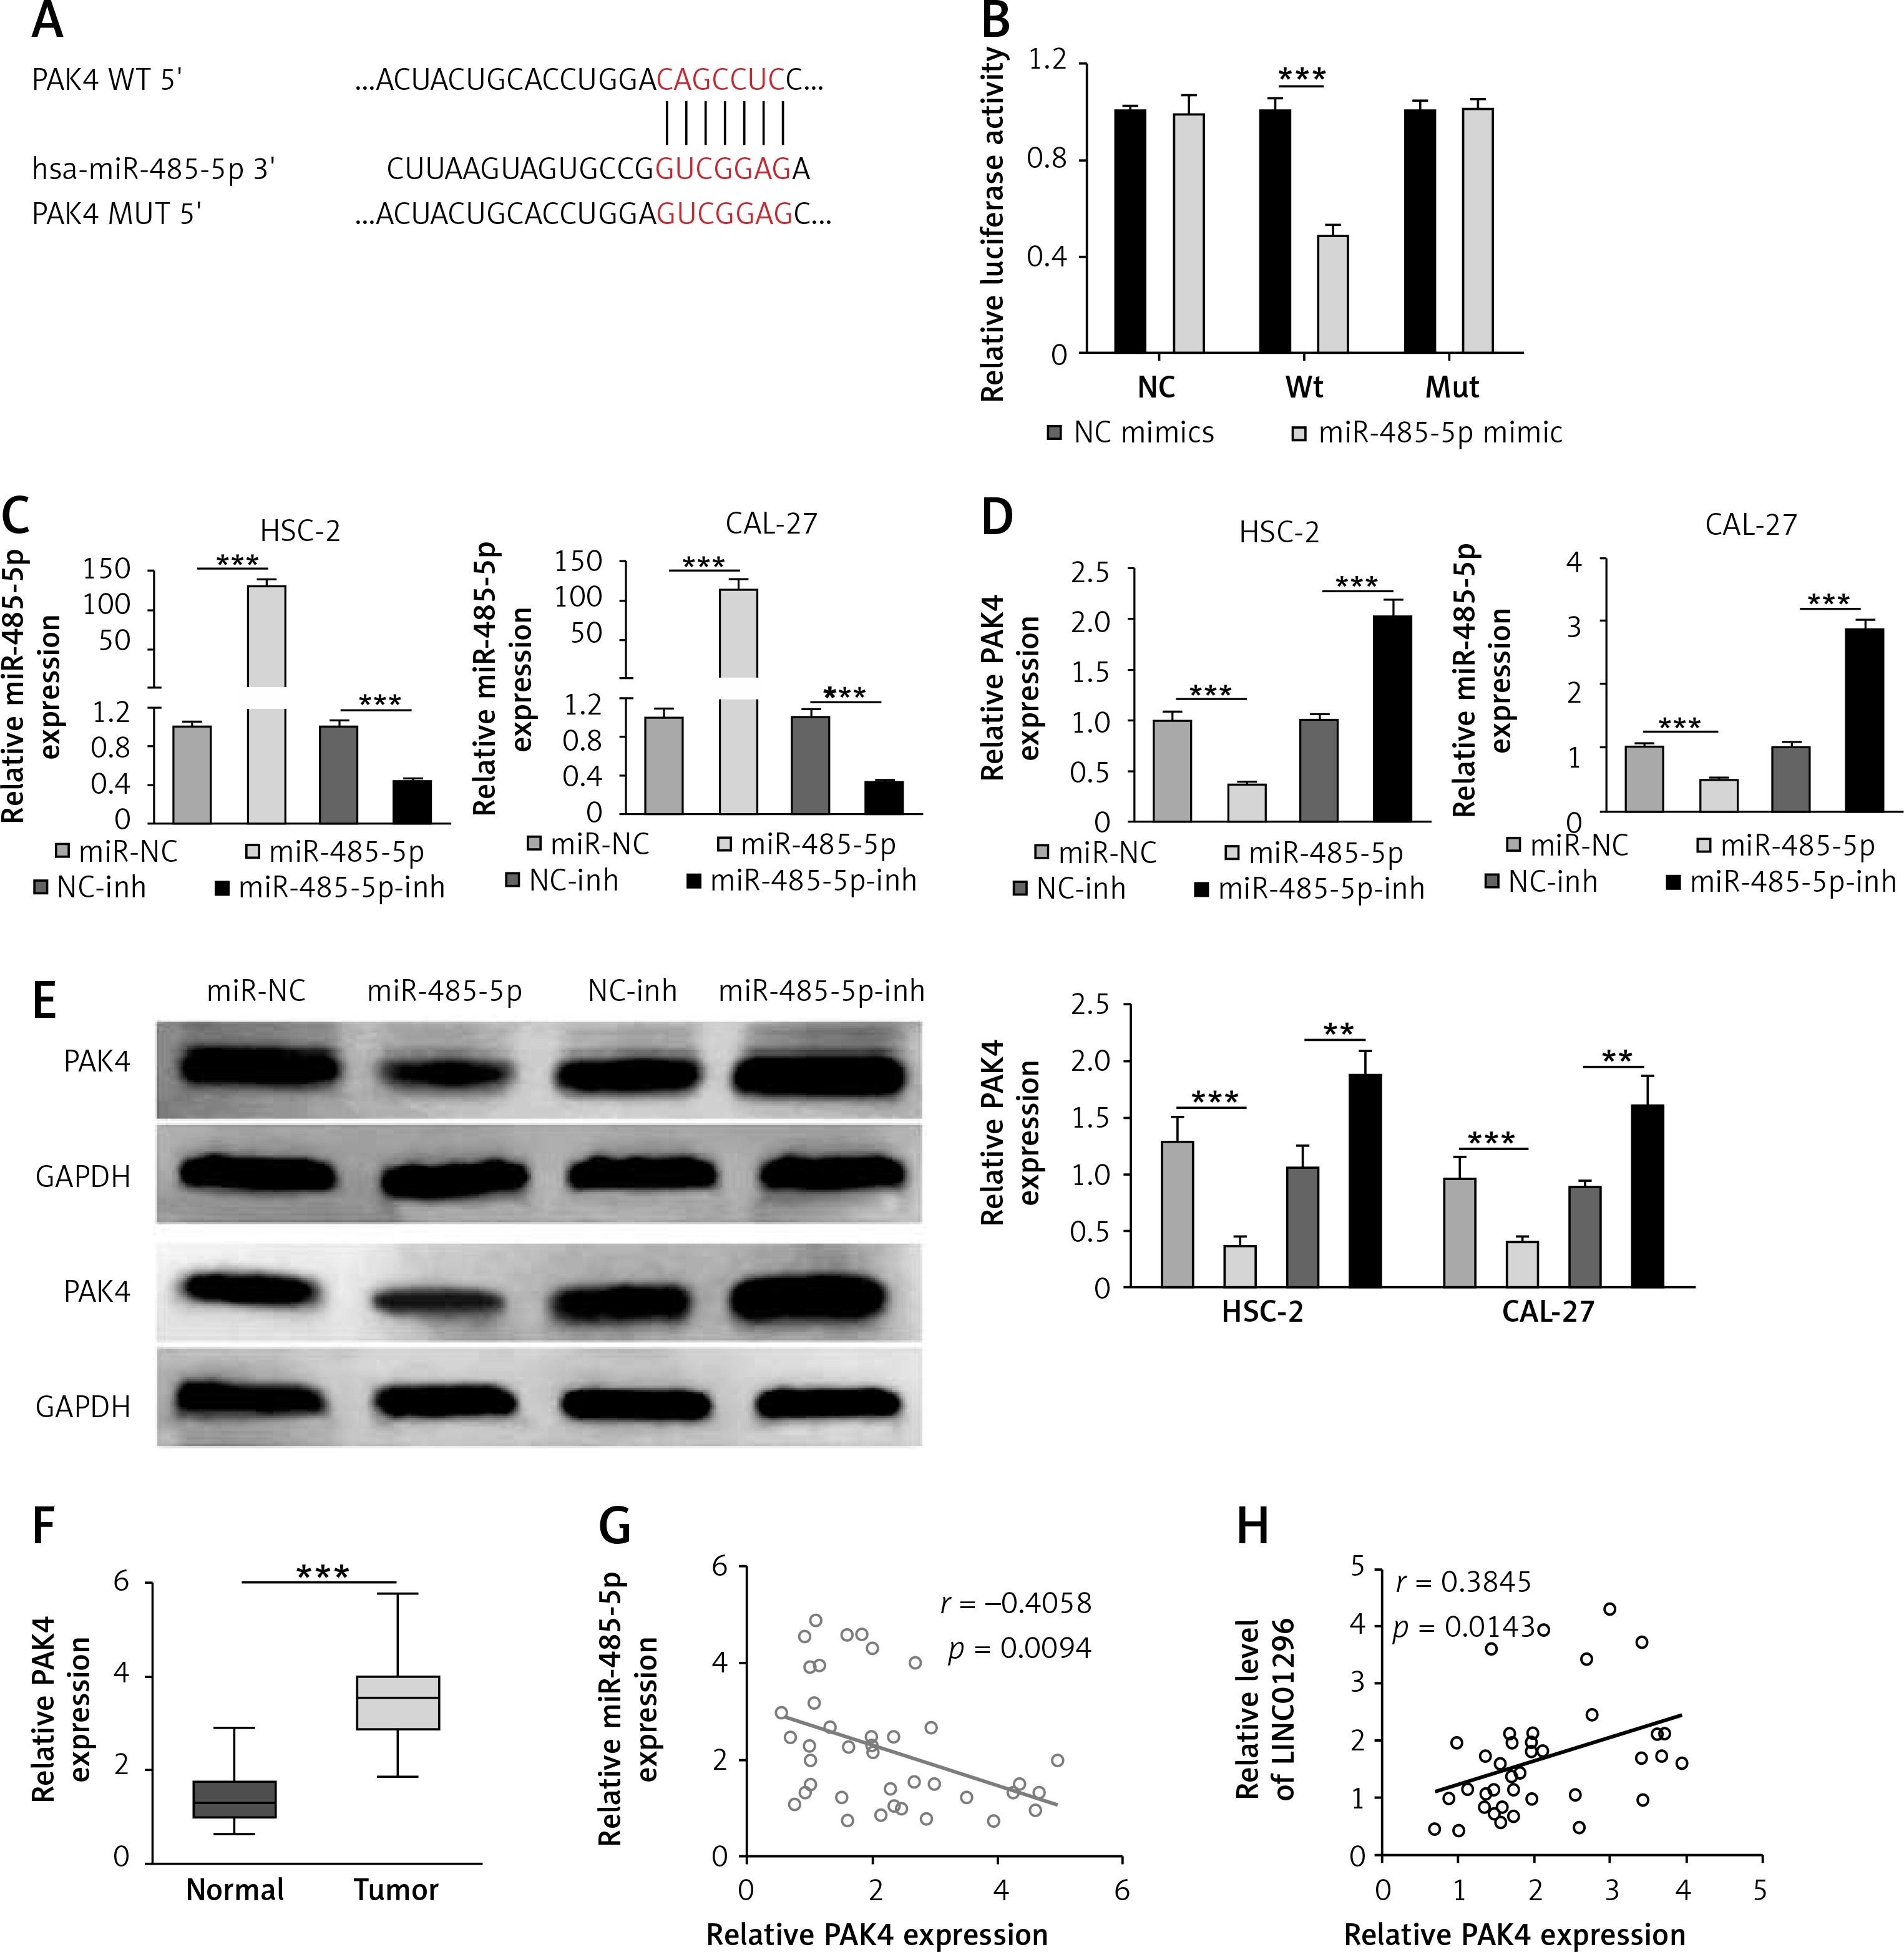
The correlation between miR-485-5p and PAK4 was further validated by qRT-PCR and western blot. Figure 5 C shows the effective transfection of miR-485-5p mimics or miR-485-5p inhibitor. After transfection, PAK4 expression was decreased by miR-485-5p mimic transfection, and increased by the transfection of miR-485-5p inhibitor (Figure 5 D). The western blot produced consistent results, as shown in Figure 5 E. Indeed, PAK4 was over-expressed in OSCC tissues in comparison to the normal tissues (Figure 5 F). Moreover, the negative correlation between PAK4 and miR-485-5p and the positive correlation between LINC01296 and PAK4 were confirmed by the Pearson correlation analysis, respectively (Figures 5 G, H).
The oncogenic effect of LINC01296 on OSCC cells was through mediating the miR-485-5p/ PAK4 axis
To validate whether miR-485-5p and PAK4 were involved in the oncogenic role of LINC01296 in the progression of OSCC, HSC-2 and CAL-27 cell lines were separately transfected with inhibitor control (NC-inh) + siRNA control (si-NC), NC-inh + si-LINC01296, miR-485-5p inhibitor + si-NC, or si-LINC01296 + miR-485-5p inhibitor, respectively. MTT assay revealed that the inhibitive cell viability induced by si-LINC01296 was obviously reversed by miR-485-5p inhibitor (Figure 6 A). Similarly, the suppressed migration and invasion capacity observed in OSCC cells transfected with si-LINC01296 were significantly up-regulated by miR-485-5p inhibitor co-transfection (HSC-2 cells, ANOVA, Figure 6 B, F(3,8) = 148.041, p < 0.001, and Figure 6 C, F(3,8) = 70.855, p < 0.001; CAL-27 cells, ANOVA, Figure 6 B, F(3,8) = 51.984, p < 0.001, and Figure 6 C, F(3,8) = 66.853, p < 0.001). In addition, cells transfected with si-LINC01296 showed a greater number of cells in G1 than the cells co-transfected with si-LINC01296 and miR-485-5p inhibitor (Figure 6 D). Moreover, the promotion of OSCC cell apoptosis by si-LINC01296 was also changed by miR-485-5p inhibitor (Figure 6 E, HSC-2 cells, ANOVA, F(3,8) = 45.595, p < 0.001; CAL-27 cells, ANOVA, F(3,8) = 38.486, p < 0.001). E-cadherin is known as a tumor suppressor and N-cadherin is known as a tumor promoter, which are critical for cancer metastasis [21]. Higher expression of E-cadherin and lower expression of N-cadherin were found in the si-LINC01296 group, which were considerably changed by miR-485-5p inhibitor (Figure 6 F, E-cadherin, ANOVA, HSC-2 cells, F(3,8) = 255.811, p < 0.001, and CAL-27 cells, F(3,8) = 38.503, p < 0.001; N-cadherin, ANOVA, HSC-2 cells, F(3,8) = 20.725, p < 0.001, and CAL-27 cells, F(3,8) = 18.821, p = 0.001).
Figure 6
The oncogenic effect of LINC01296 on OSCC cells was through mediating the miR-485-5p/PAK4 axis. After HSC-2 and CAL-27 cell lines were separately transfected with inhibitor control (NC-inh) + siRNA control (si-NC), NC-inh + si-LINC01296, miR-485-5p inhibitor + si-NC, or si-LINC01296 + miR-485-5p inhibitor, (A) cell viability, (B) migration and (C) invasion were determined by MTT, wound healing assay and transwell assay, respectively. Flow cytometry detected the (D) cell cycle and (E) apoptosis. F – Protein level of PAK4, cyclin D1, CDK2, CDK4, CDK6, cyclin E1, cleaved caspase 3, cleaved caspase 9, E-cadherin, N-cadherin, p-MEK, MEK, p-ERK, ERK and GAPDH
***p < 0.001, **p < 0.01 versus control group.
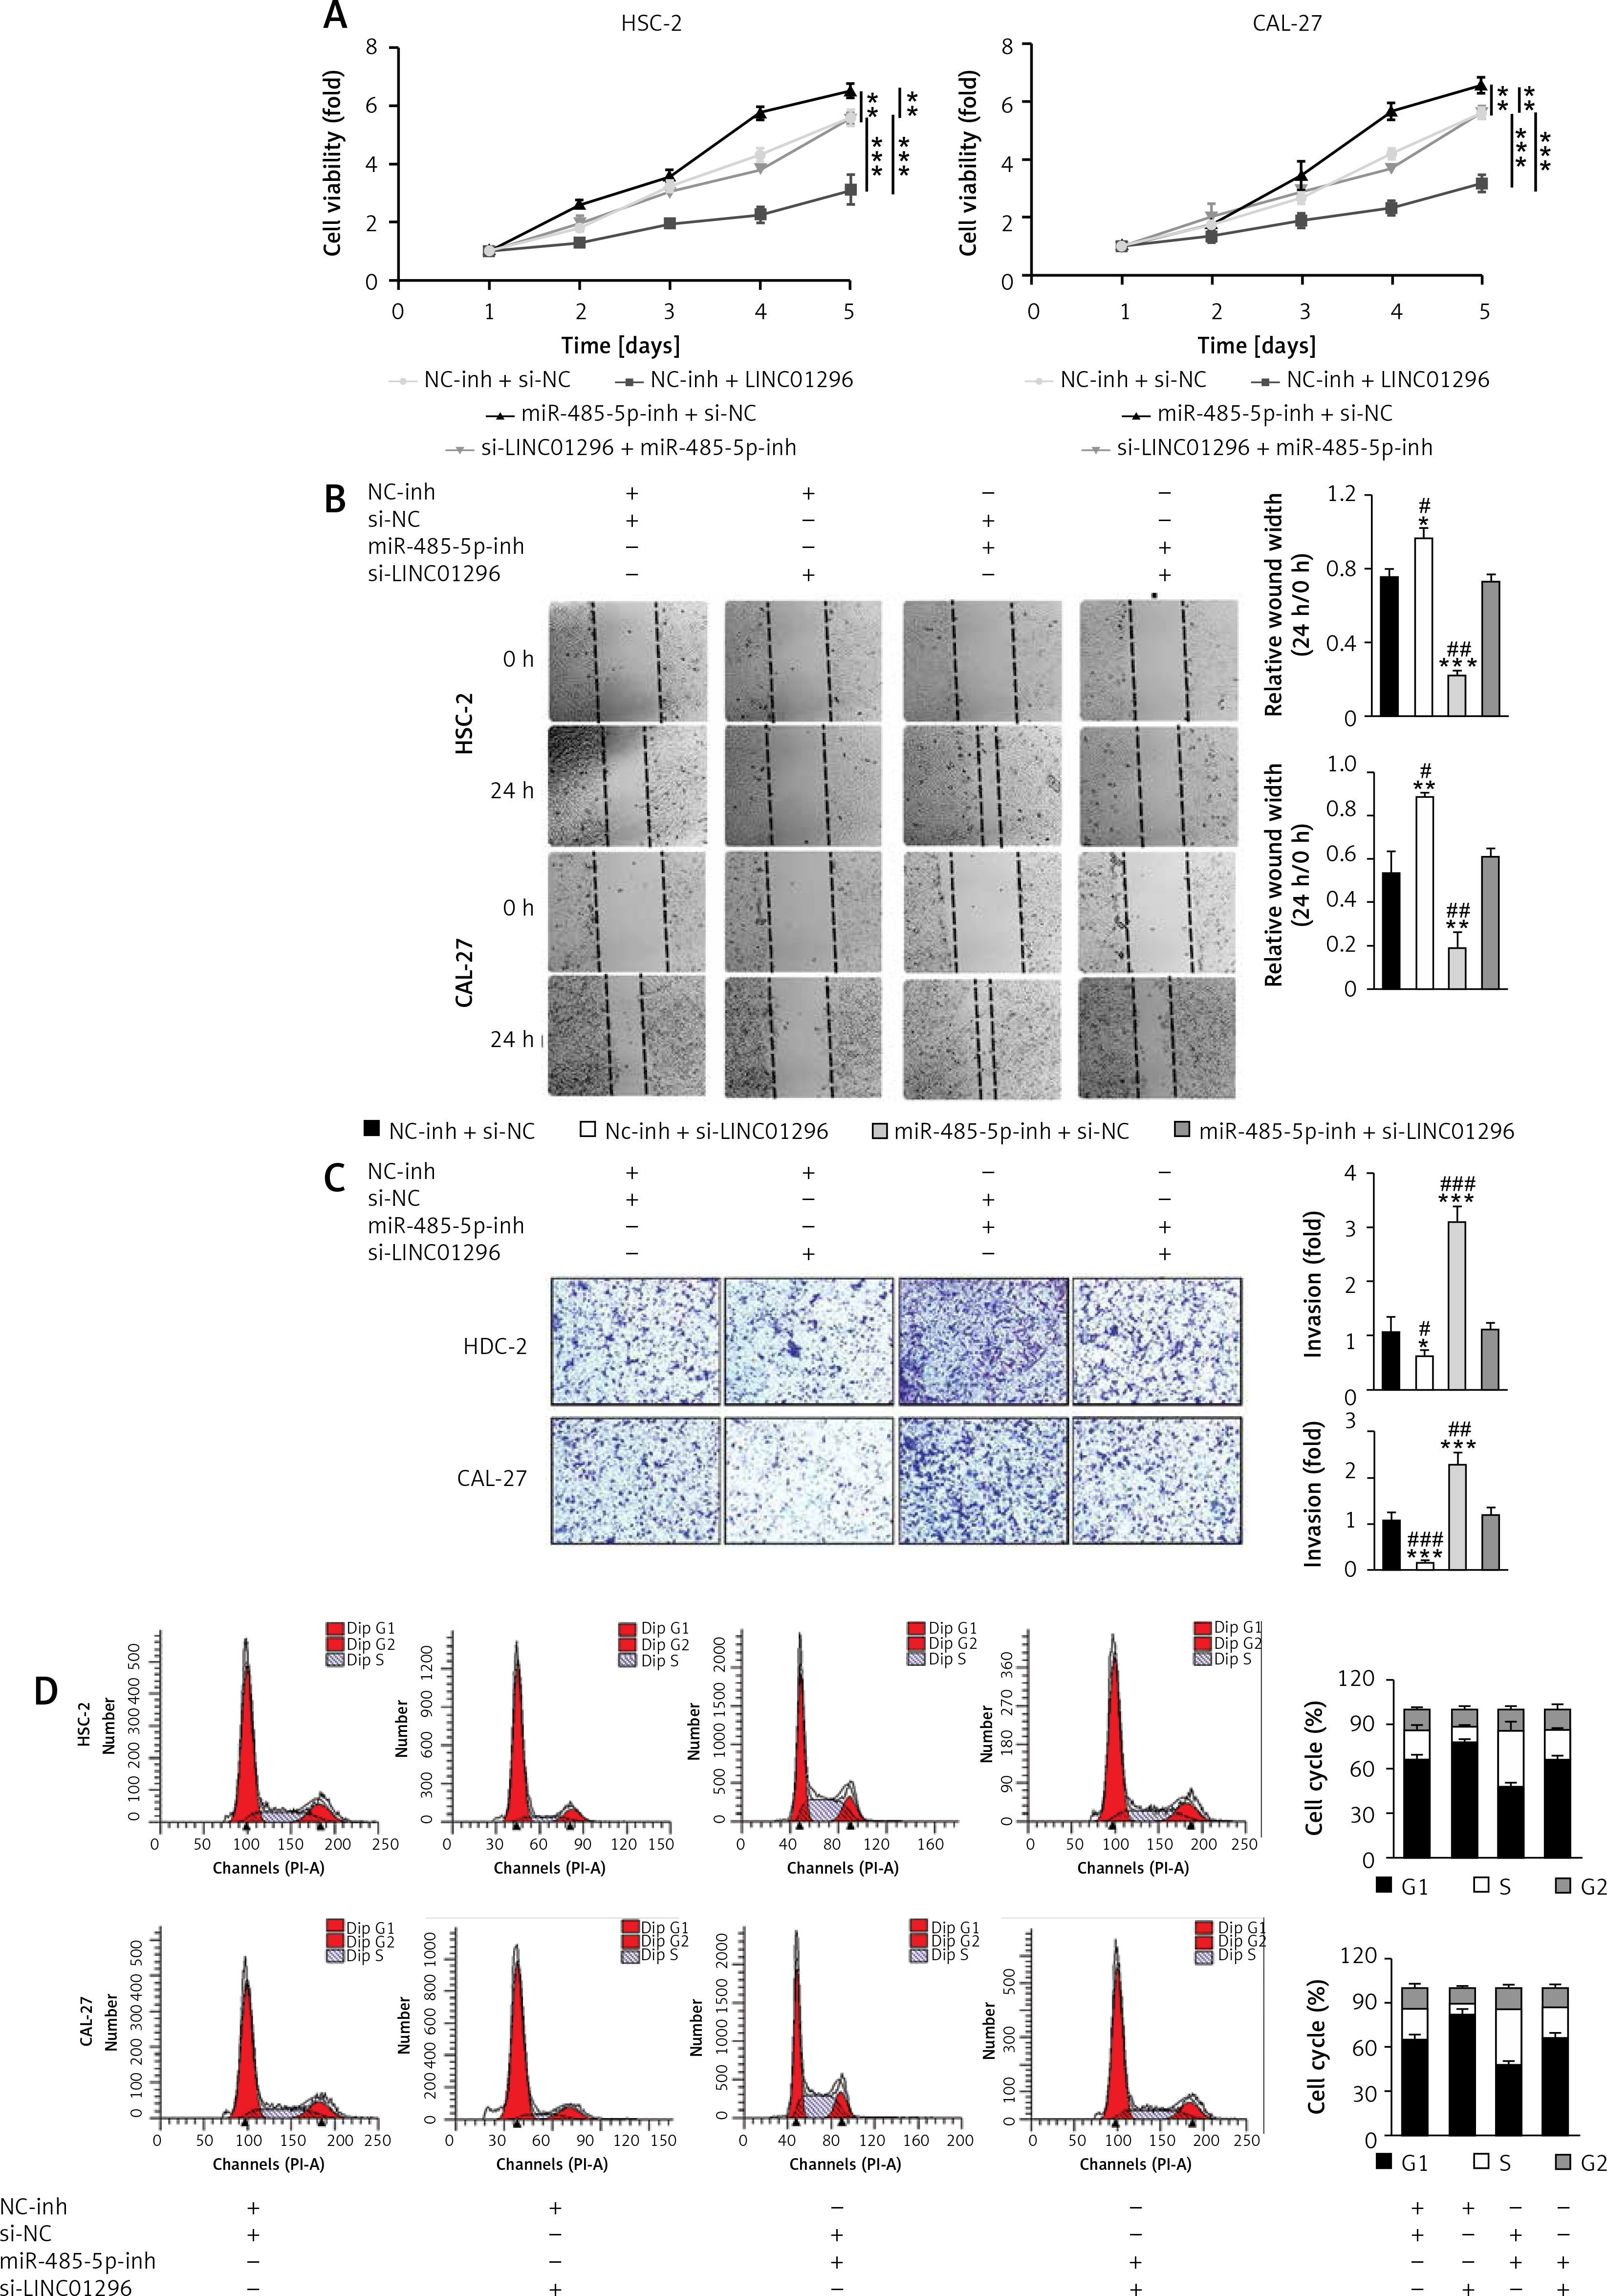
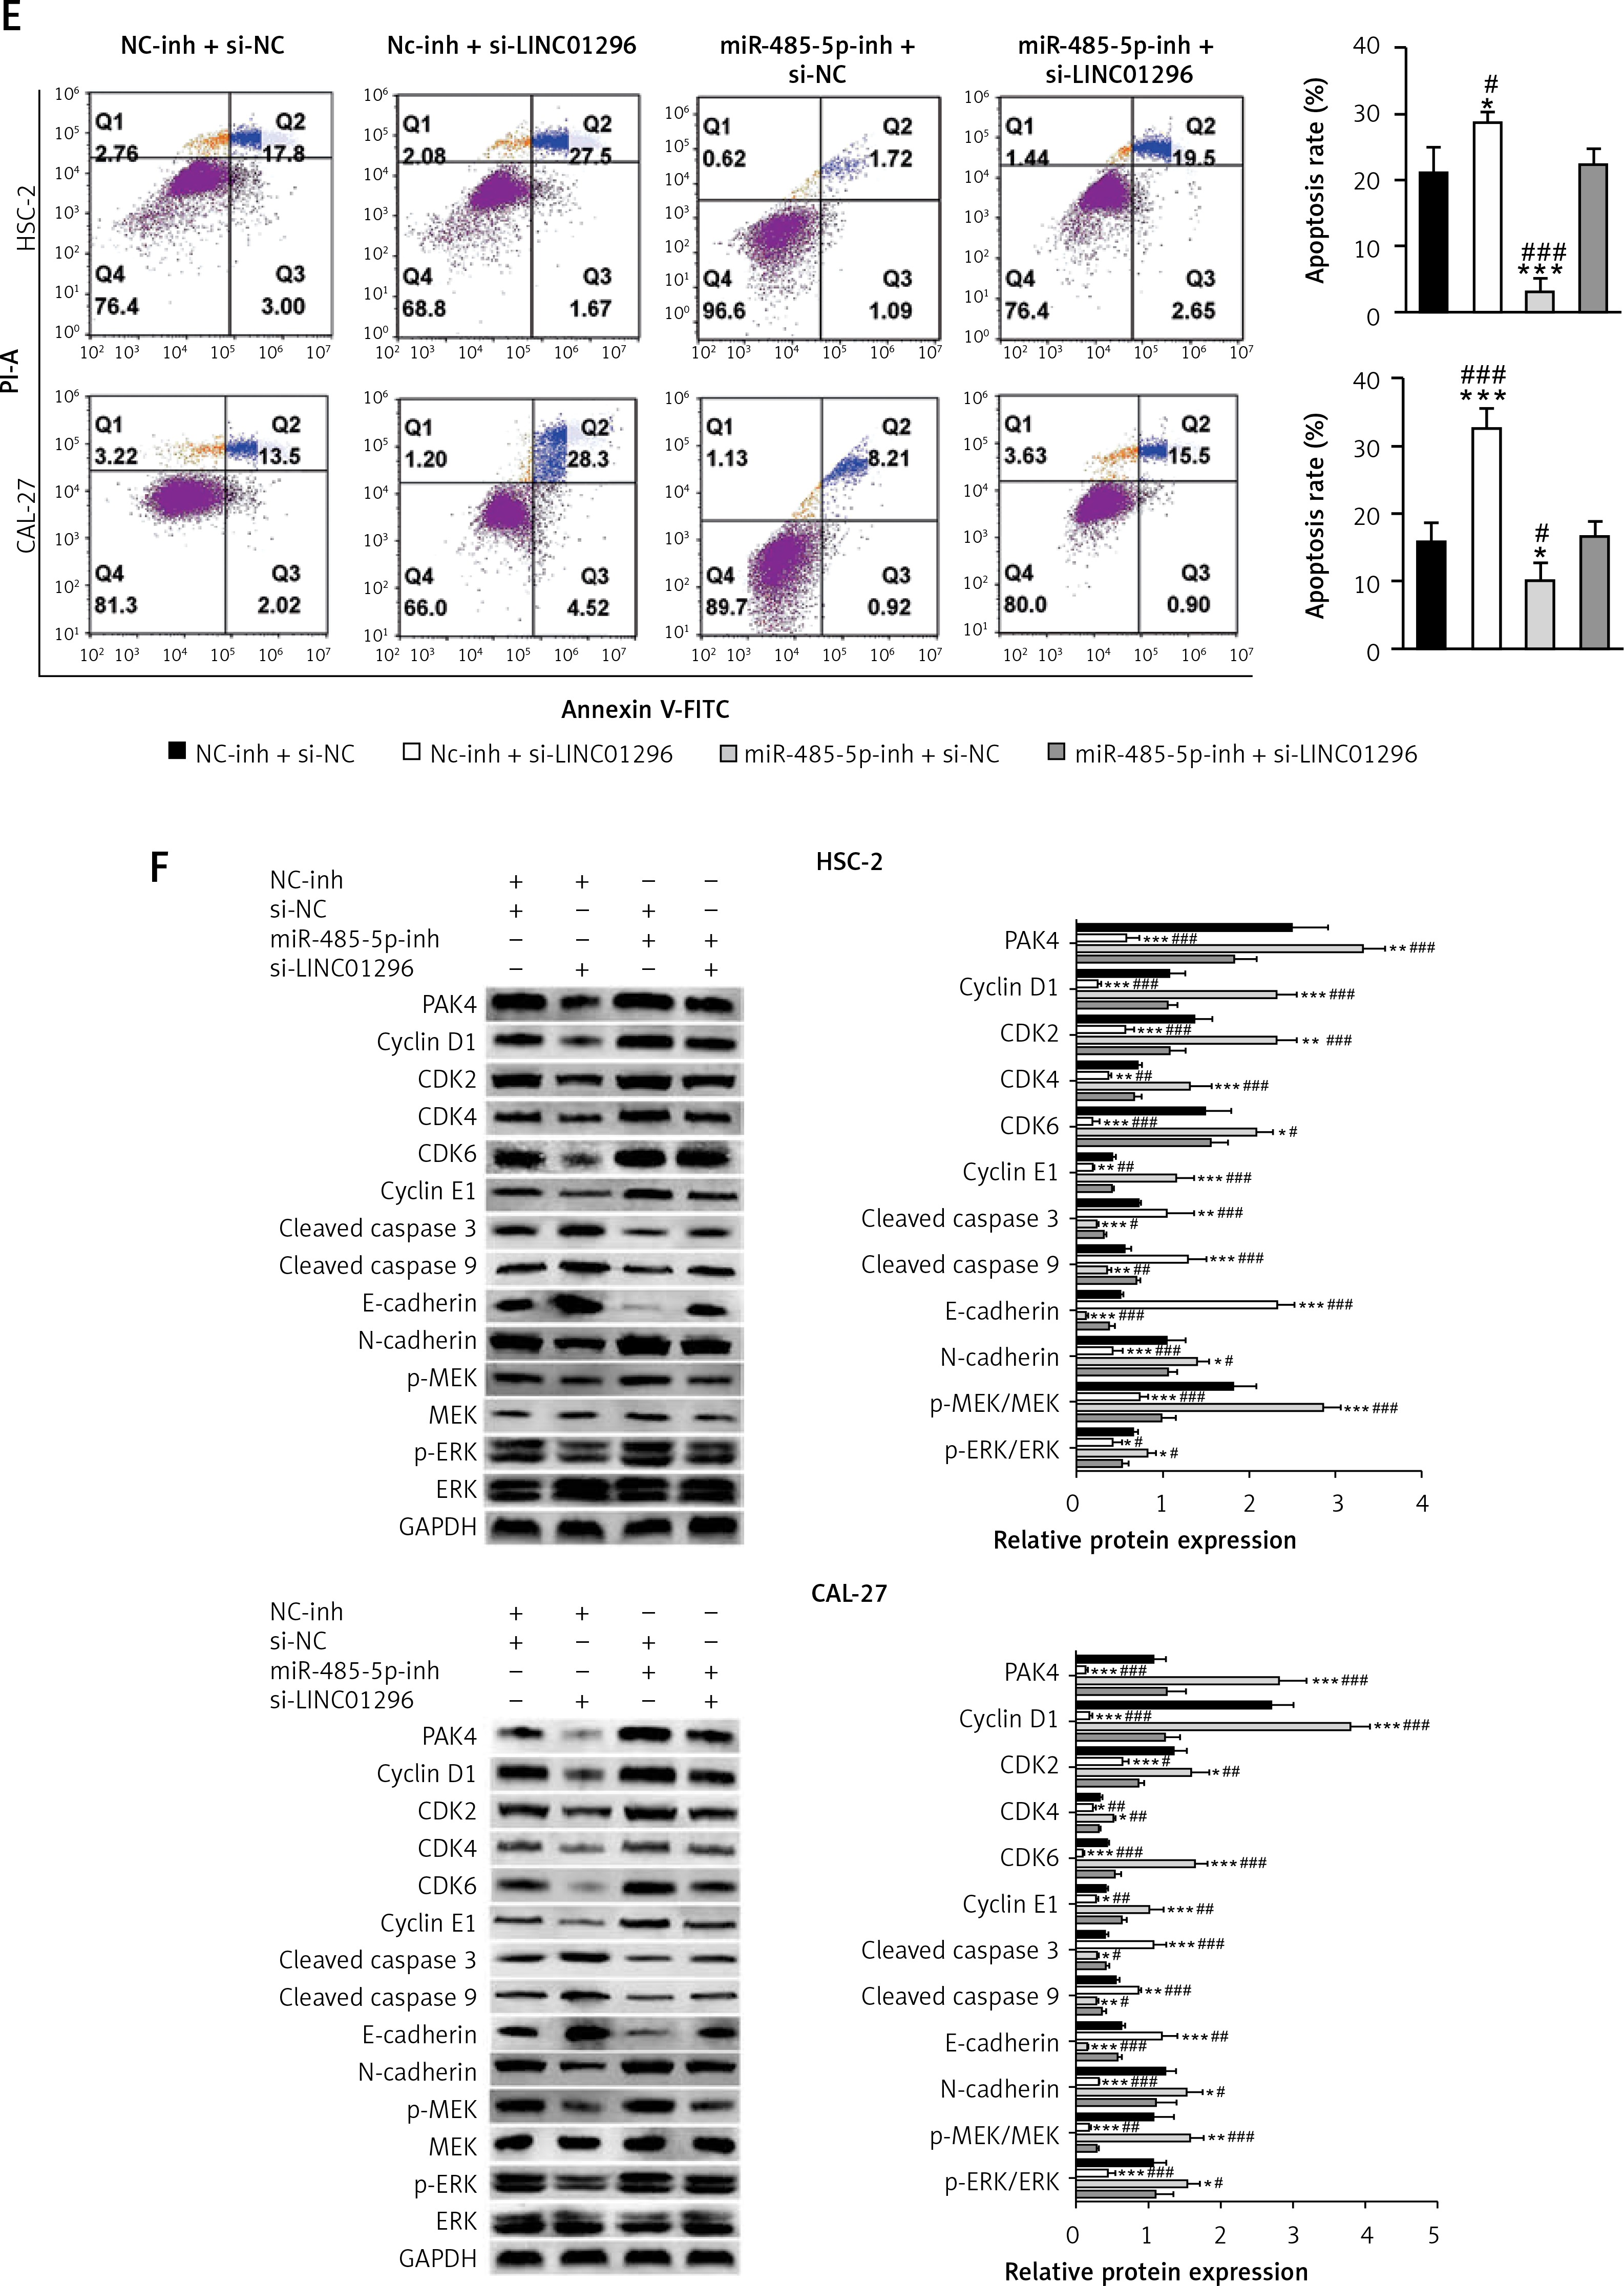
The activities of cyclin D1, CDK2, CDK4, CDK6 and cyclin E1 are required for cell cycle G1/S transition [22, 23]. Lower expression of these proteins was observed in OSCC cells transfected with si-LINC01296, which were up-regulated after co-transfecting with si-LINC01296 and miR-485-5p inhibitor (Figure 6 F, cyclin D1, ANOVA, HSC-2 cells, F(3,8) = 86.306, p < 0.001, and CAL-27 cells, F(3,8) = 140.917, p < 0.001; CDK2, ANOVA, HSC-2 cells, F(3,8) = 48.771, p < 0.001, and CAL-27 cells, F(3,8) = 19.618, p < 0.001; CDK4, ANOVA, HSC-2 cells, F(3,8) = 25.293, p < 0.001, and CAL-27 cells, F(3,8) = 62.073, p < 0.001; CDK6, ANOVA, HSC-2 cells, F(3,8) = 43.158, p < 0.001, and CAL-27 cells, F(3,8) = 129.898, p < 0.001; cyclin E1, ANOVA, HSC-2 cells, F(3,8) = 45.395, p < 0.001, and CAL-27 cells, F(3,8) = 24.025, p < 0.001). Also, the expression of the pro-apoptotic proteins caspase 3 and caspase 9 was enhanced by si-LINC01296 transfection, whereas the expression level was decreased by the introduction of miR-485-5p inhibitor (caspase 3, ANOVA, HSC-2 cells, F(3,8) = 16.855, p = 0.001, and CAL-27 cells, F(3,8) = 34.716, p < 0.001; caspase 9, ANOVA, HSC-2 cells, F(3,8) = 33.442, p < 0.001, and CAL-27 cells, F(3,8) = 85.583, p < 0.001).
The MAPK/ERK (mitogen-activated protein kinases/extracellular signal regulated kinase) signaling pathway is critical for cell proliferation, migration, invasion and apoptosis [24]. Thus, the expression levels of key proteins MEK and ERK in the MAPK/ERK signaling pathway were determined by western blot. Figure 6 F shows that the phosphorylation of MEK and ERK was decreased by si-LINC01296, whereas the introduction of miR-485-5p inhibitor increased the expression of p-MEK and p-ERK (p-ERK, ANOVA, HSC-2 cells, F(3,8) = 11.081, p < 0.001, and CAL-27 cells, F(3,8) = 17.481, p = 0.001; p-MEK, ANOVA, HSC-2 cells, F(3,8) = 71.856, p < 0.001, and CAL-27 cells, F(3,8) = 39.991, p < 0.001).
Additionally, PAK4 expression was down-regulated by si-LINC01296, but up-regulated by miR-485-5p inhibitor. However, this alteration was reversed by si-LINC01296 and miR-485-5p inhibitor co-transfection (Figure 6 F, PAK4, ANOVA, HSC-2 cells, F(3,8) = 46.929, p < 0.001, and CAL-27 cells, F(3,8) = 56.659, p < 0.001).
Discussion
Owing to the lack of effective diagnostic and treatment methods, the overall survival in patients with OSCC has not been improved significantly [4]. Identifying novel biomarkers has become a major research direction in OSCC prognosis, diagnosis and treatment [1]. As lncRNAs are key regulators for various cellular processes, lncRNAs have been regarded as potential biomarkers for cancer treatment [9]. lncRNA LINC01296 has been reported to be associated with diverse cancers. LINC01296 overexpression promoted the proliferation, metastasis and cycle progression of bladder cancer cells [25]. High expression of LINC01296 was also observed in gastric cancer, which promoted the progression of gastric cancer through sponging miR-122 to mediate MMP-9 expression [26]. In agreement with the previous studies, we found that LINC01296 was highly expressed in OSCC tissues and cells. LINC01296 level was positively correlated with the patient’s TNM stage and nodal invasion. Additionally, knockdown of LINC01296 effectively inhibited the OSCC cell cycle progression, proliferation and metastasis, and induced cell apoptosis. Moreover, knockdown of LINC01296 significantly suppressed the growth of OSCC tumor. Therefore, our study indicated that LINC01296 might be a potential biomarker for the diagnosis and therapy of OSCC.
Based on the ceRNA hypothesis, lncRNAs can function as sponges of miRNAs through competing with mRNAs [14], and thereby affect the development and progression of many diseases [27]. For instance, lncRNA GAS5 inhibits the growth and metastasis of OSCC through sponging miR-21 to regulate PTEN expression [28]. Our study suggested that LINC01296 could bind to miR-485-5p by using luciferase reporter and RIP assays. A negative correlation between miR-485-5p and LINC01296 was also observed. Thus, LINC01296 could be considered as a ceRNA for miR-485-5p in OSCC. Importantly, the effects of LINC01296 knockdown on OSCC cell viability, migration, invasion and cell apoptosis were significantly reversed by miR-485-5p inhibitor. These results indicated the involvement of miR-485-5p in the oncogenic role of LINC01296 in OSCC progression and development.
miRNAs mediate the progression of tumors through regulating the expression of target genes [29]. Duan et al. suggested that miR-485-5p can negatively mediate its target molecule NUDT1 to regulate cell proliferation and metastasis in gastric cancer [18]. In the present study, the results indicated that PAK4 was identified as a target of miR-485-5p in OSCC. Consistently, PAK4 is highly expressed in diverse cancers and promotes cancer cell growth [30, 31]. Moreover, an immunohistochemical analysis of primary tumors from 105 cases of head and neck SCC including 50 cases of OSCC demonstrated the overexpression of PAK4 to be significantly associated with a poorer prognosis [20]. These findings suggested that LINC01296 participated in OSCC progression and development through regulating PAK4 expression via LINC01296. The MAPK/ERK signaling pathway communicates extracellular signals to the DNA in the cell nucleus, and regulates many cellular processes such as cell cycle, progression, metastasis, differentiation and apoptosis [24, 32]. Dysregulation of the MAPK/ERK signaling pathway is observed in many types of cancers including OSCC [33–36]. In the present work, the expression levels of the key proteins p-MEK and p-ERK in the MAPK/ERK signaling pathway and PAK4 were increased by miR-485-5p inhibitor, and were decreased by the introduction of si-LINC01296. Thus, LINC01296 could medicate the expression of p-MEK and p-ERK via sponging miR-485-5p to regulate PAK4 expression.
Overall, these findings indicated that LINC01296 promotes the cell cycle, proliferation, migration and invasion, and inhibit cell apoptosis in OSCC cells through activating the MAPK/ERK signaling pathway via sponging miR-485-5p to regulate PAK4 expression. This is the first evidence demonstrating the role of the LINC01296/miR-485-5p/PAK4 axis in the progression of OSCC, which provides new insight for understanding the pathogenesis of OSCC. Of course, this is just a preliminary study about the functional role of LINC01296 in OSCC, and these findings need to be further validated and elucidated by animal experiments in vivo and clinical trials.
In conclusion, our study revealed that LINC01296 promotes cell proliferation, migration, invasion and cycle progression, and inhibits cell apoptosis through mediating the miR-485-5p/ PAK4 axis. Our study provides new insight into the molecular pathogenesis of OSCC, and may supply novel biomarkers for diagnosis and therapy of OSCC.