Introduction
Lung cancer, the most lethal cancer, consists of non-small cell lung cancer (NSCLC) and small cell lung cancer (SCLC) [1–3]. Lung adenocarcinoma (LUAD) is categorised as the most common subtype of NSCLC, accounting for approximately 40% of all lung cancers [4]. Younger people (under 46 years old) and women are more likely to have LUAD than other lung cancers [5]. Smoking is a major cause for most lung cancers; however, LUAD is frequently found in people who have never smoked [6]. The symptoms of LUAD that are more generalised such as subtle shortness of breath and fatigue in the early stages may be ignored or considered to have other causes [7]. Thus, LUAD is usually diagnosed at the advanced stage, and therapeutic strategies are only palliative [8]. The prognosis of LUAD is very poor [9]. In particular, over 50% of LUAD cases are found to be advanced metastatic disease with a 5-year survival rate of 4% [10]. Therefore, studying the molecular mechanism of the pathogenesis of LUAD is necessary to find potential diagnostic approaches and novel treatments.
The occurrence and development of cancer are closely associated with abnormal expression of both non-coding and protein-coding RNAs [11, 12]. In recent years, competitive endogenous RNA (ceRNA) hypothesis has been identified as a novel and important regulatory mechanism [13]. Long non-coding RNAs (lncRNAs) can function as ceRNAs to regulate mRNA expression by competing for shared miRNAs [14]. LncRNAs have received much attention because of their critical roles in various cellular processes [15]. For instance, lncRNA RHPN1-AS1 (RHPN1 antisense RNA 1) can sponge miR-596 to regulate LETM1 (leucine zipper and EF-hand containing transmembrane protein 1) expression, thereby promoting the proliferation of ovarian cancer cells [16]. Furthermore, lncRNA HMMR-AS1 (HMMR antisense RNA 1) promotes the growth and metastasis of LUAD by sponging miR-318 to regulate sirt6 expression [17]. To better understand the roles of lncRNAs in cancer, many lncRNA-miRNA-mRNA networks have been constructed based on the ceRNA hypothesis [18]. Li et al. analysed the lncRNA profiles from 570 LUAD cases in the TCGA database and established 3 ceRNA (lncRNA-miRNA-mRNA) networks [19]. Although some reports have constructed ceRNA networks using different bioinformatics methods to understand the pathogenesis of LUAD, studies of lncRNA-miRNA-mRNA networks related to prognosis are few in LUAD.
The present study identified differentially expressed lncRNAs (DELs), differentially expressed miRNAs (DEMs), and differentially expressed genes (DEGs) between metastasis and non-metastasis LUAD patients from the TCGA database. Based on these molecules, we constructed lncRNA-miRNA-mRNA networks and validated a lncRNA-miRNA-mRNA network using biological experiments. Our study contributes to understanding the molecular pathogenesis of LUAD and finding appropriate, targeted therapeutic biomarkers.
Material and methods
Data sources
LUAD RNA sequencing (RNA-Seq) data, miRNA-Seq data, and corresponding clinical information were obtained from The Cancer Genome Atlas (TCGA) database (https://www.cancer.gov/about-nci/organization/ccg/research/structural-genomics/tcga). Based on the patients’ clinical information, they were divided into metastasis and non-metastasis groups: patients at the N0 and M0 stages were classified as the non-metastasis group; patients at the N1-N3 or M1 stage were classified as the metastasis group; and patients with no information of the N and M stages were excluded. Thus, the non-metastasis group contained 222 cases, and the metastasis group included 189 cases. We used transcriptome annotation files from the GENCODE database to identify mRNAs and lncRNAs and excluded genes that had a mean expression of less than 0.1. The clinical characteristics of LUAD patients are listed in Table I.
Data preprocessing and differential expression analysis
Data in the raw count format from TCGA were normalised with the transcripts per million (TPM) method and underwent a log2 transformation using the DESeq2 package in R language (version 3.4.1; https://www.r-project.org/). The differentially expressed lncRNAs (DELs), miRNAs (DEMs), and genes (DEGs) between metastasis and non-metastasis LUAD patients were identified using the Linear Models for Microarray Data (Limma, version 3.34.0; http://www.bioconductor.org/packages/release/bioc/html/limma.html) package in R. A p-value < 0.01 was designated as the threshold. The information of all obtained DELs, DEMs, and DEGs is listed in Supplementary Table SI.
ceRNA network construction
Firstly, miRcode (http://www.mircode.org/) was utilised to find potential lncRNAs that sponge the DEMs. LncRNAs that met the following two criteria were retained: overlapped with the DELs and a negative correlation with DEMs. Secondly, the target genes of DEMs were identified using miRTarBase (http://mirtarbase.mbc.nctu.edu.tw/php/index.php), miRDB (http://mirdb.org/), and TargetScan (http://www.targetscan.org/vert_71/). Target genes that met the following 3 criteria were retained: predicted by at least 2 websites, overlapped with the DEGs, and a negative correlation with DEMs. Finally, we integrated the interactions of lncRNA-miRNA and miRNA-mRNA to construct the ceRNA network using Cytoscape software (version 3.4).
Functional enrichment analysis
To study the function of mRNAs in the ceRNA network, we used the clusterProfiler package to perform GO (Gene Ontology) and KEGG (Kyoto encyclopaedia of genes and genomes) pathway enrichment analyses. GO terms contain BP (biological process), MF (molecular function), and CC (cellular component) categories. A p-value < 0.05 was designated as the cut-off criterion.
Prognosis-related ceRNA network
To further screen the ceRNA networks, we downloaded the expression data and clinical information of lncRNAs, miRNAs, and mRNAs in the ceRNA network from the TCGA database and performed a univariate cox regression analysis to identify prognosis-related lncRNAs, miRNAs, and mRNAs using the survival package (version 2.43-3). The median expression level of each lncRNA, miRNA, and mRNA in the ceRNA network was set as the cut-off value and the samples were divided into a low-expression group and a high-expression group. The Kaplan-Meier method was used to draw overall survival (OS) curves, and the log-rank test was used to assess the difference of OS between the low-expression and high-expression groups. A p-value of < 0.05 was considered statistically significant. The prognosis-related lncRNAs, miRNAs, and mRNAs were used to construct the prognosis-related ceRNA network using Cytoscape software (version 3.4).
Cell culture and transfection
Human normal lung epithelial cells (BEAS-2B) and LUAD cell lines (NCI-H1299, A549, NCI-H1975) were purchased from the Cell Bank of the Chinese Academy of Sciences (Shanghai, China). LUAD cell lines were incubated in RPMI-1640 medium (Gibco) supplemented with 10% foetal bovine serum (Gibco) and 1% penicillin/streptomycin (Gibco) and maintained in a humidified incubator with 5% CO2 at 37°C. BEAS-2B cells were cultured using a BEGM kit (Lonza, Basel, Switzerland) and maintained in a humidified incubator with 5% CO2 at 37°C.
The MIR155HG plasmid and scramble plasmid were synthesised from FITGENE (Guangzhou, China). The siRNA MIR155HG (si-MIR155HG) and siRNA-negative control (si-NC) were purchased from Invitrogen. These vectors were transfected into LUAD cells using Lipofectamine 3000 transfection reagent (Invitrogen, Carlsbad, CA, USA).
Real-time quantitative PCR (RT-qPCR)
Total RNA from LUAD cells was extracted with TRIzol reagent (Invitrogen). The synthesis of cDNA was performed using the QuantiTect Reverse Transcription Kit (Qiagen, USA). Next, RT-qPCR was carried out by the SYBRTM Green PCR Kit (Life Technologies) under Applied Biosystems ViiAt 7 Real-Time PCR System (Life Technologies). The relative expression of target genes was assessed using the 2–ΔΔCt method with β-actin or U6 as internal controls. Table II shows the primers used for RT-qPCR.
Table II
RT-qPCR primer sequences
Cell counting kit 8 (CCK-8) assay
At 48 h post-transfection, cells were harvested and seeded in 96-well plates at a density of 1 × 10⁴ cells per well. The CCK-8 reagent (10 µl, Engreen Biosystem) was added to cells after 24, 48, 72, and 96 h of incubation. Next, the cells were cultured for another 4 h and the optical density was measured using a microplate reader at 450 nm.
Wound healing assay
At 48 h post-transfection, cells were incubated to 90% confluence using RPMI-1640 medium supplemented with 10% foetal bovine serum and 1% penicillin/streptomycin in 6-well plates. A sterile 100 µl pipette tip was used to make straight lines through the cell monolayer. Next, the cells were washed with phosphate-buffered saline (PBS) and cultured with serum-free RPMI-1640 medium for 24 h. An Olympus BX51 light microscope (Olympus Corporation) was used to image the cells.
Transwell invasion assay
The transfected cells were collected, suspended in serum-free RPMI-1640 medium, and seeded in the upper Transwell chamber of 24-well plates at a density of 1 × 10⁵ cells per chamber. The lower chamber was filled with RPMI-1640 medium and 10% FBS as a chemoattractant. After incubation for 24 h, the invaded cells were fixed using 4% paraformaldehyde for 30 min at room temperature and stained in 0.1% crystal violet for 20 min. After washing with PBS, the cells were imaged using an Olympus BX51 light microscope (Olympus Corporation; magnification 200×).
Dual luciferase reporter assay
The putative binding sites of miR-212-3p with MIR155HG and CD226 were identified using miRcode (http://www.mircode.org/) and miRTarBase (http://mirtarbase.mbc.nctu.edu.tw/php/index.php). The 3’-untranslated region (UTR) fragments of MIR155HG and CD226 containing miR-212-3p wild-type (WT) or mutant (MUT) binding sites were amplified using PCR and cloned into pMIR-REPORTM Luciferase vectors (Promega) based on standard protocols to form MIR155HG-WT, MIR155HG-MUT, CD226-WT, and CD226-MUT luciferase reporter vectors. These reporter vectors with miR-212-3p mimic or miRNA control were co-transfected into LUAD cells using Lipofectamine 3000 reagent (Invitrogen) and cells were incubated for 48 h at 37°C. After transfection, the cells were collected using a lysis buffer, and luminescence was measured according to the protocol of the dual luciferase reporter assay kit (Dual-Luciferase® 1000 Assay kit, Promega). The firefly luciferase activity was normalised to Renilla luciferase activity.
Western blot
Total protein was lysed from LUAD cells with RIPA lysis buffer (Beyotime Institute of Biotechnology) on ice. Protein concentration was measured using a BCA Protein Assay Kit (ThermoFisher Scientific, USA). Proteins (20 µg) were equally separated on a 10% SDS-PAGE gel and electro-transferred onto PVDF membranes. Membranes, after being blocked using 5% non-fat milk for 1 h at room temperature, were incubated with primary antibodies against CD226 (Cat. No. #66631, dilution 1 : 1000) and β-actin (Cat. No. #4970, dilution 1 : 1000) at 4℃ overnight. The membranes were washed using TBS buffer with 0.05% Tween-20 and incubated with a secondary antibody (anti-rabbit IgG, HRP-linked antibody, Cat. No. #7074, dilution 1 : 1000) for 1 h at room temperature. The primary and secondary antibodies were purchased from Cell Signaling Technology. A chemiluminescence detection kit (Aidlab Biotechnology, Beijing, China) was utilised to perform the colour rendering of protein bands. The protein density was calculated by ImageJ software.
Statistical analysis
All experiments in the present study were carried out in triplicate. The data are presented as the mean ± standard deviation (SD). GraphPad 7 software was used to perform statistical analysis. Student’s t-test was applied to test for differences between two groups, and a one-way ANOVA with Tukey’s test evaluated the differences among multiple groups. A p-value of < 0.05 was considered significant.
Results
Differential expression analysis
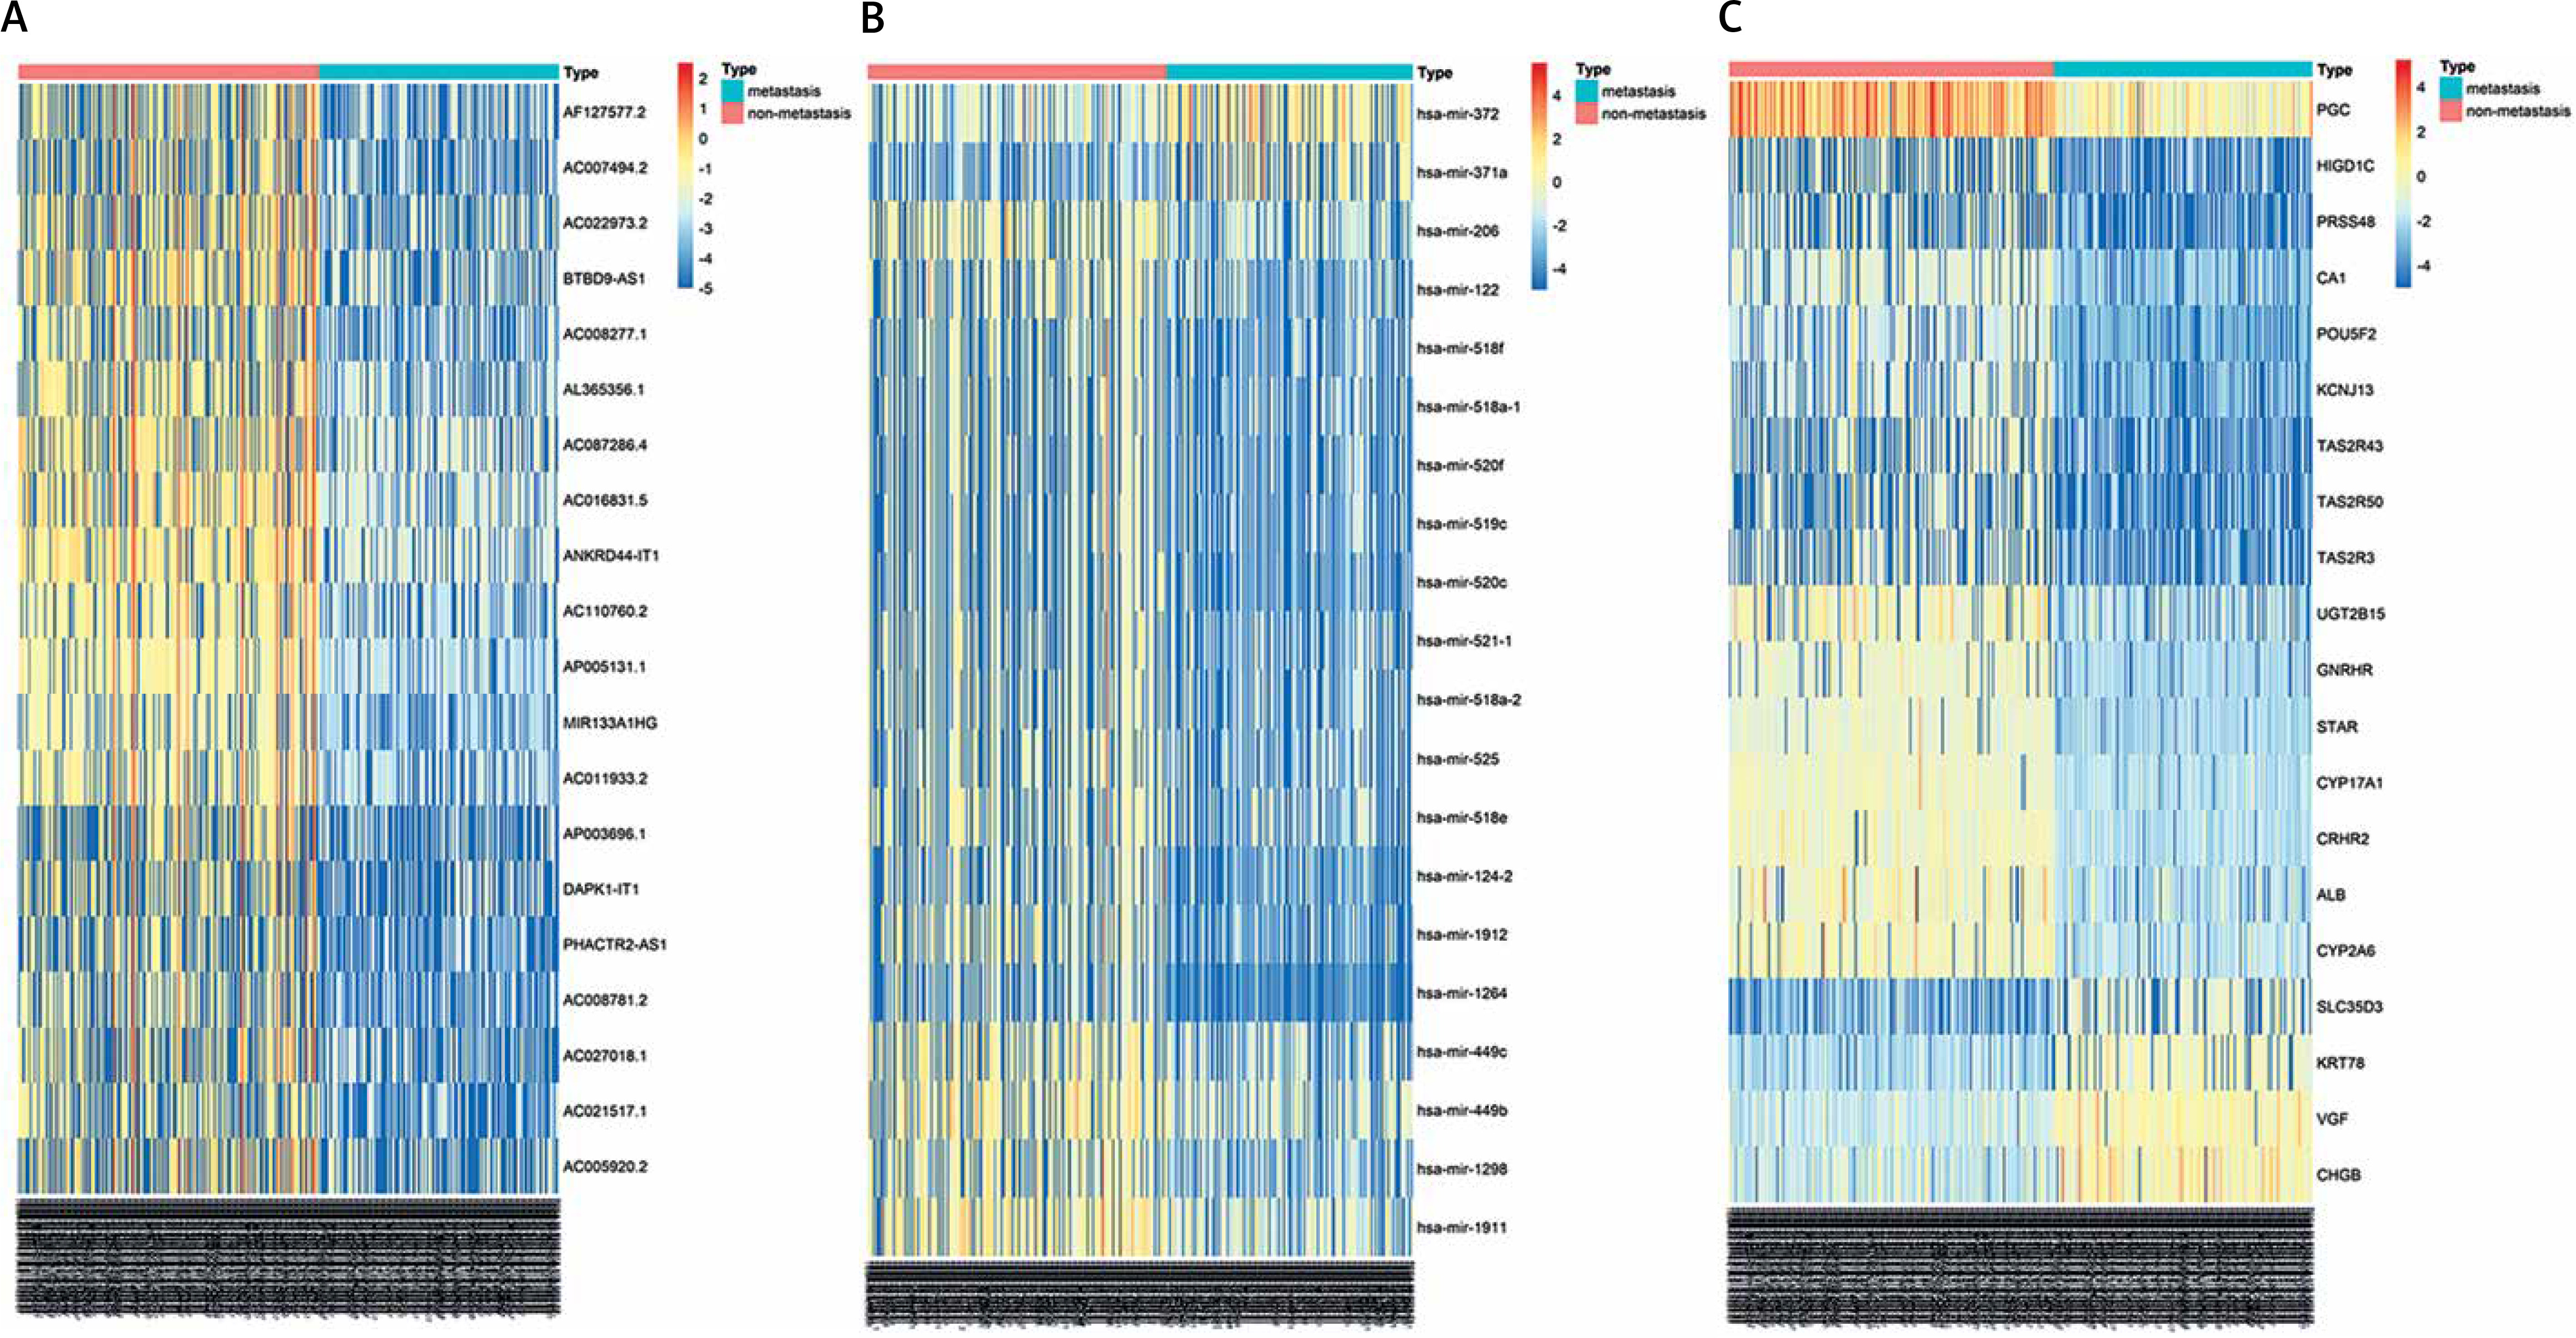
After LUAD datasets were preprocessed by the DESeq2 package, 854 DELs (785 downregulated and 69 upregulated), 150 DEMs (64 downregulated and 86 upregulated), and 2211 DEGs (1246 downregulated and 965 upregulated) between metastasis and non-metastasis LUAD patients were obtained using the Limma package (Supplementary Table SI). The expression levels of the top 20 DELs, DEMs, and DEGs are shown in a heatmap (Figure 1).
ceRNA network construction
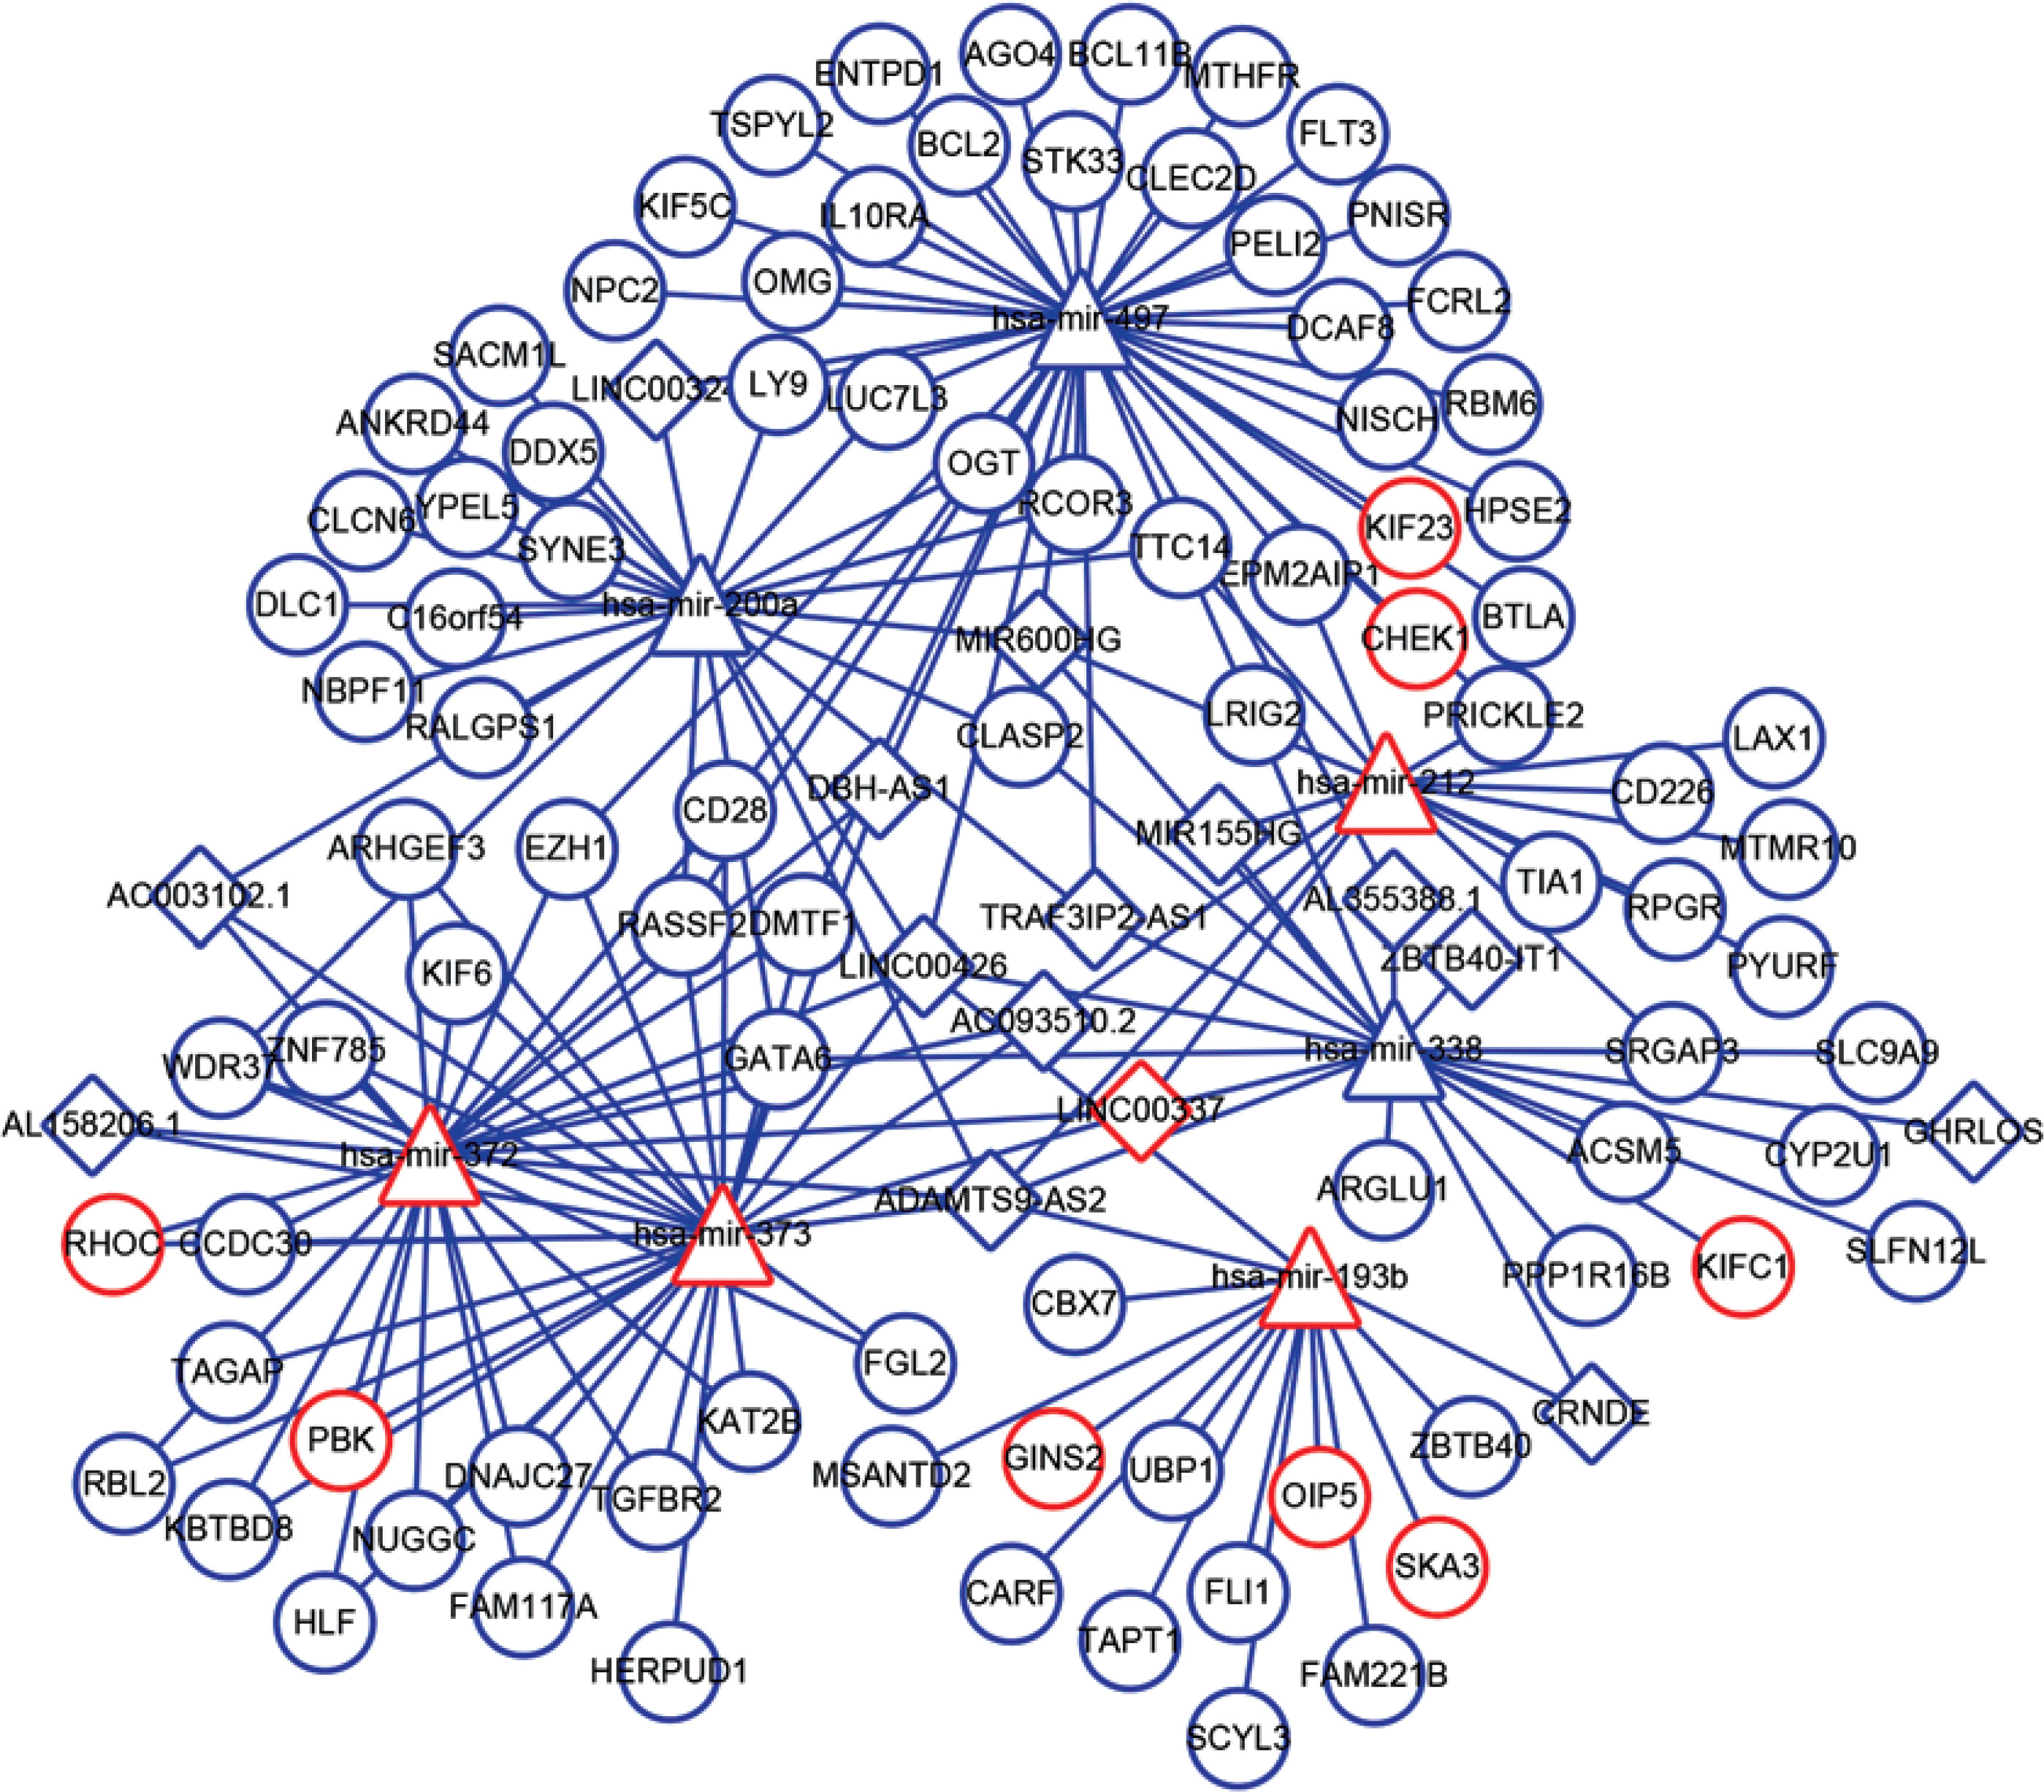
Interaction of lncRNA with miRNA was predicted by miRcode, and the interaction between miRNA and mRNA was identified using miRTarBase, miRDB, and TargetScan. Furthermore, the data of DELs, DEMs, and DEGs were combined with the interactions among lncRNA, miRNA, and mRNA to obtain 44 lncRNA-miRNA interaction pairs and 132 miRNA-mRNA interaction pairs, including 15 lncRNAs (e.g. MIR155HG, LINC00324, LINC00337), 7 miRNAs (e.g. hsa-mir-200a, hsa-mir-212, hsa-mir-193b), and 91 mRNAs (e.g. RHOC, CBX7, CD226). Then, the ceRNA network was constructed by Cytoscape software (Figure 2), which indicated the potential interaction relationships among lncRNA, miRNA, and mRNA.
Functional enrichment analysis
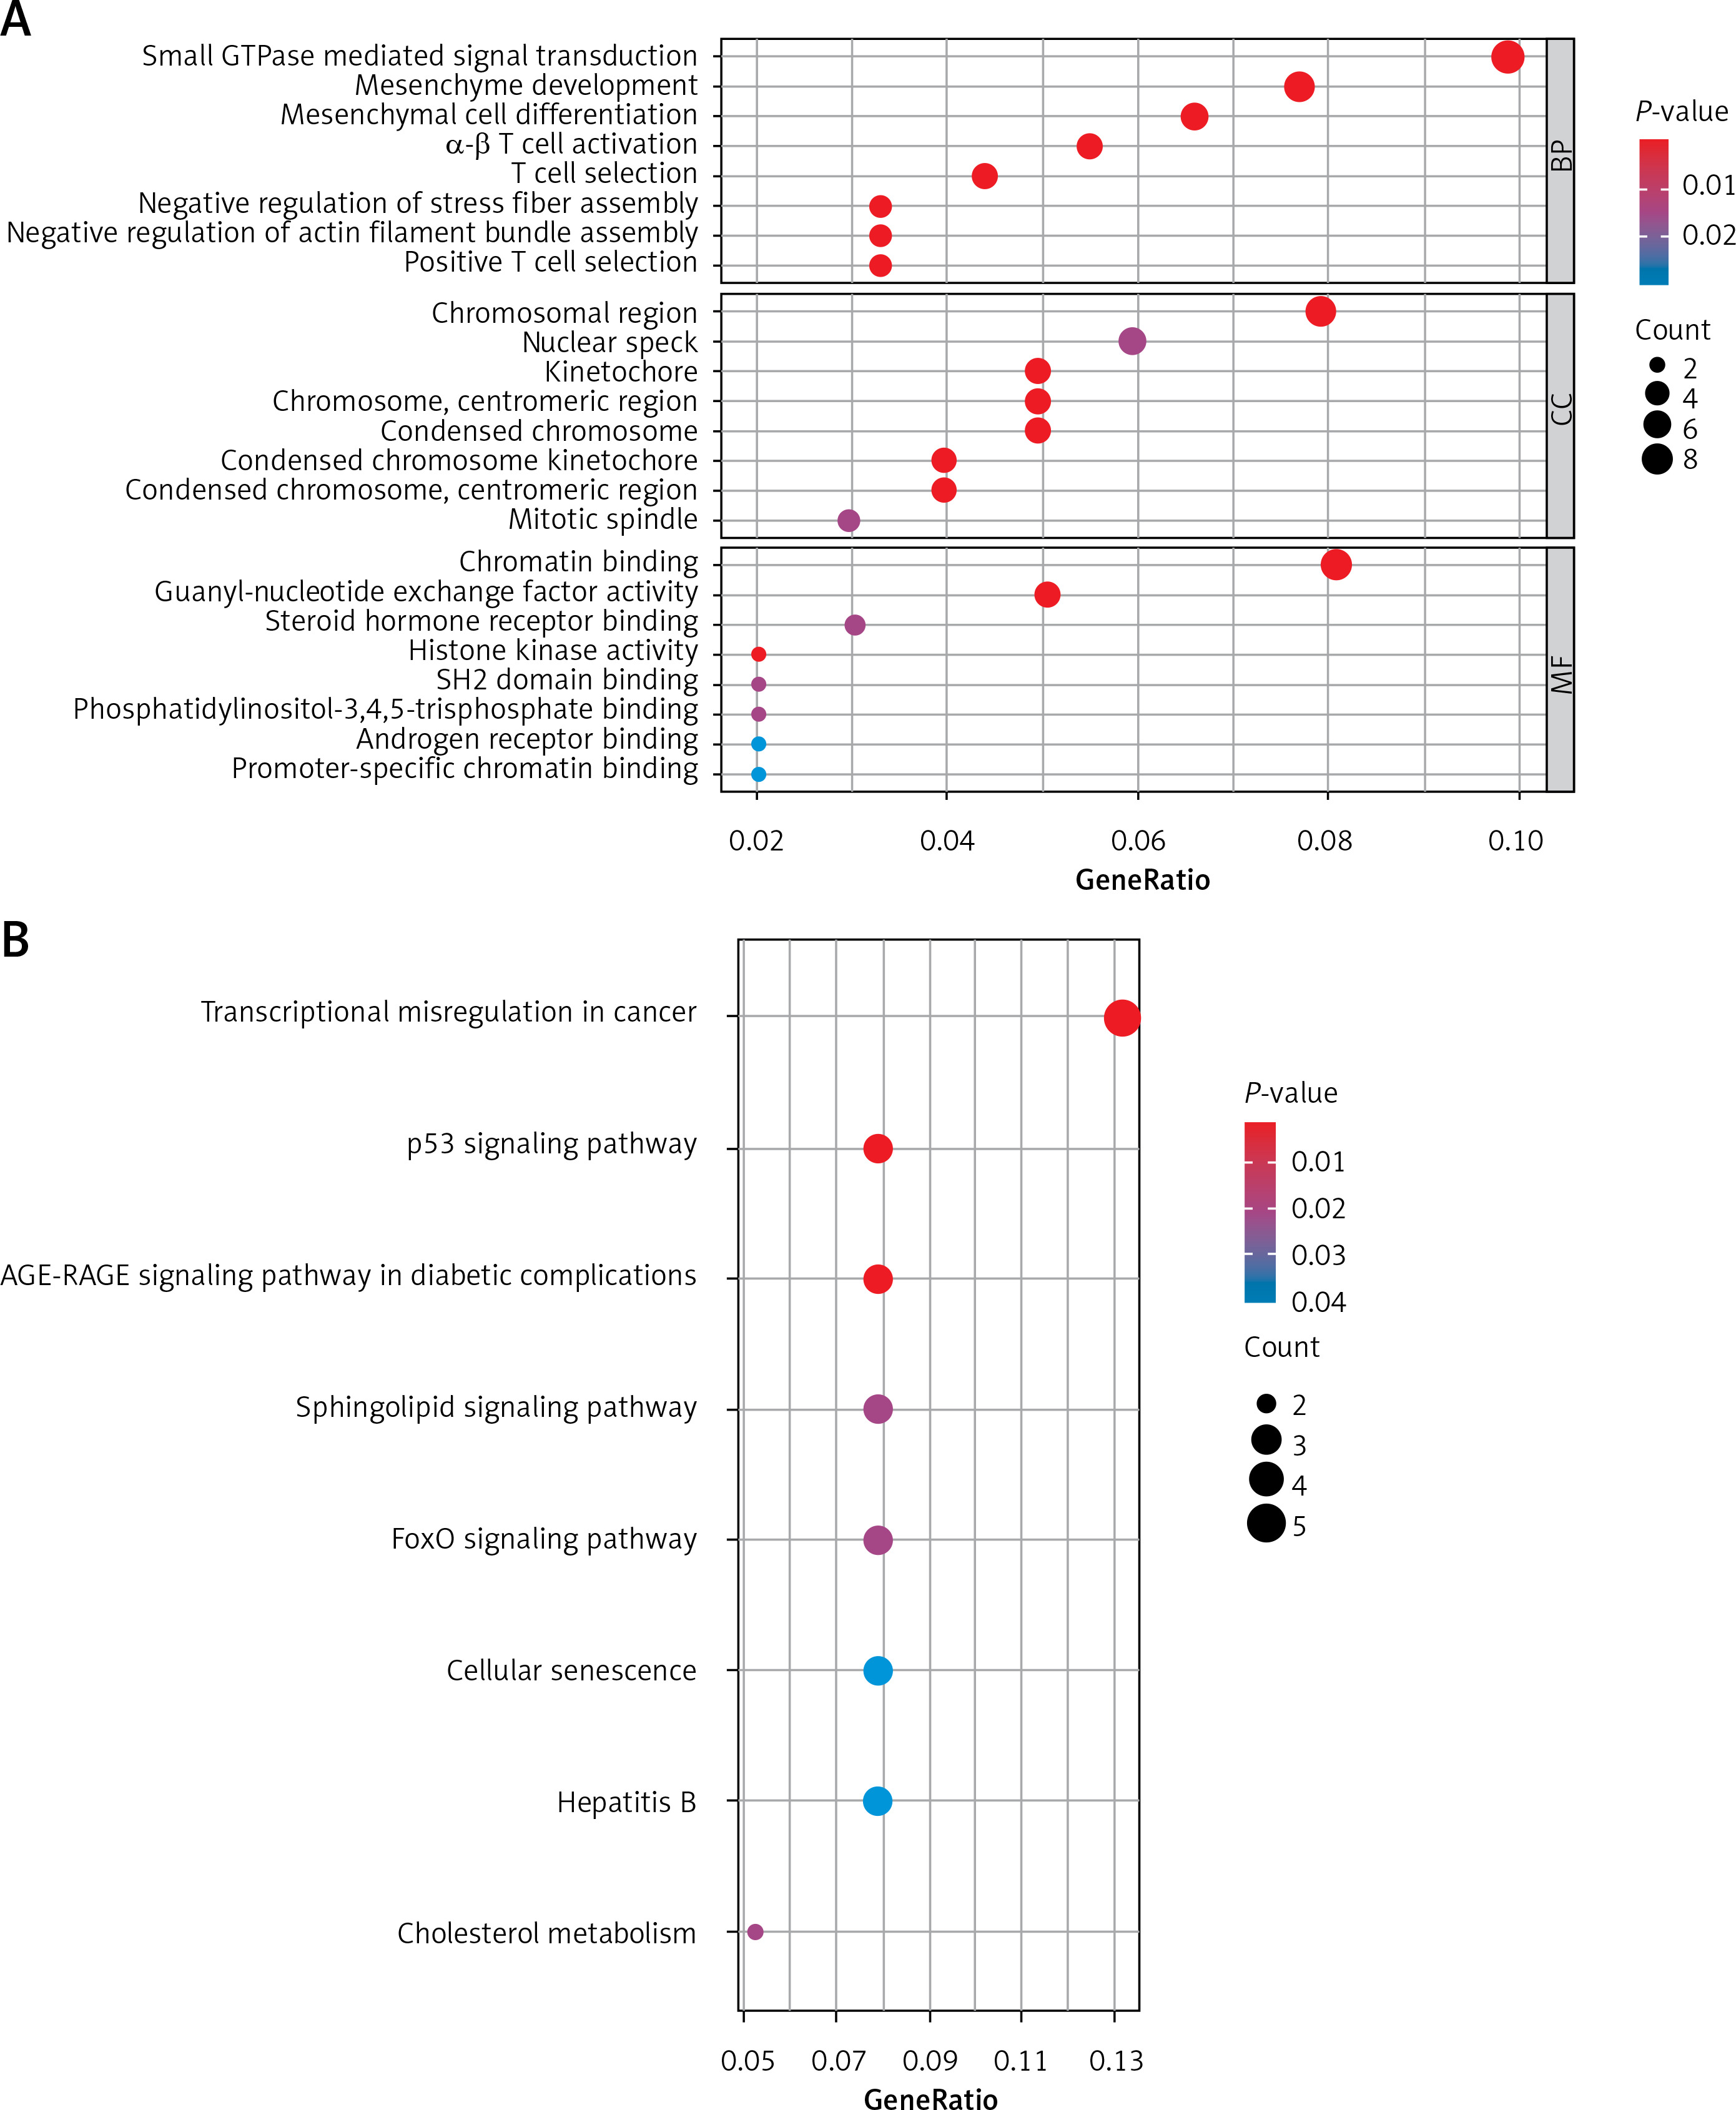
mRNAs in the ceRNA network were analysed using the clusterProfiler package to find their underlying functions in LUAD. The results of the GO analysis are shown in Figure 3 A. For BP, mRNAs in the ceRNA network were primarily enriched in small GTPase mediated signal transduction. For CC, mRNAs were mainly enriched in chromosomal region. For MF, mRNAs were chiefly enriched in chromatin binding. In addition, mRNAs in the ceRNA network were assessed by KEGG pathway analysis. The top 10 pathways significantly correlated with LUAD metastasis are listed in Figure 3 B. For example, transcriptional misregulation in cancer and the p53 signalling pathway are closely associated with the progression of LUAD.
Prognosis-related ceRNA network
To further screen the ceRNA networks, we downloaded the corresponding overall survival information in the ceRNA network from TCGA and performed a univariate cox regression analysis using the survival package. The results found, prognosis-related, 4 lncRNAs, 1 miRNA, and 49 mRNAs (Supplementary Table SII). Then, the data were combined with the interactions among lncRNA, miRNA, and mRNA to obtain 2 lncRNA-miRNA interaction pairs and 4 miRNA-mRNA interaction pairs, which consisted of 1 miRNA, 2 lncRNAs, and 4 mRNAs. OS curves of these molecules were drawn using Kaplan-Meier method with log-rank test (Figure 4 A). For instance, the high expression of MIR155HG had higher OS values, indicating better prognosis, as compared to low expression of MIR155HG. The high expression of miR-212 showed poor prognosis compared with the low expression of miR-212. As shown in Figure 4 B, the prognosis-related ceRNA network was established using Cytoscape software. In this network, MIR155HG and ADAMTS9-AS2 can function as ceRNAs of miR-212 to regulate EPM2AIP1, LAX1, PRICKLE2, and CD226.
Figure 4
Prognosis-related ceRNA network. A – Overall survival curves of the lncRNA, miRNA, and mRNA of crucial ceRNA axis in which all lncRNAs, miRNAs, and mRNAs were related to prognosis B – The image of the prognosis-related ceRNA network; Square nodes represent lncRNAs; triangle nodes represent miRNAs; round nodes represent mRNAs. Edges represent the possible associations between lncRNAs, miRNAs, and mRNAs. Red, upregulated; Blue, downregulated
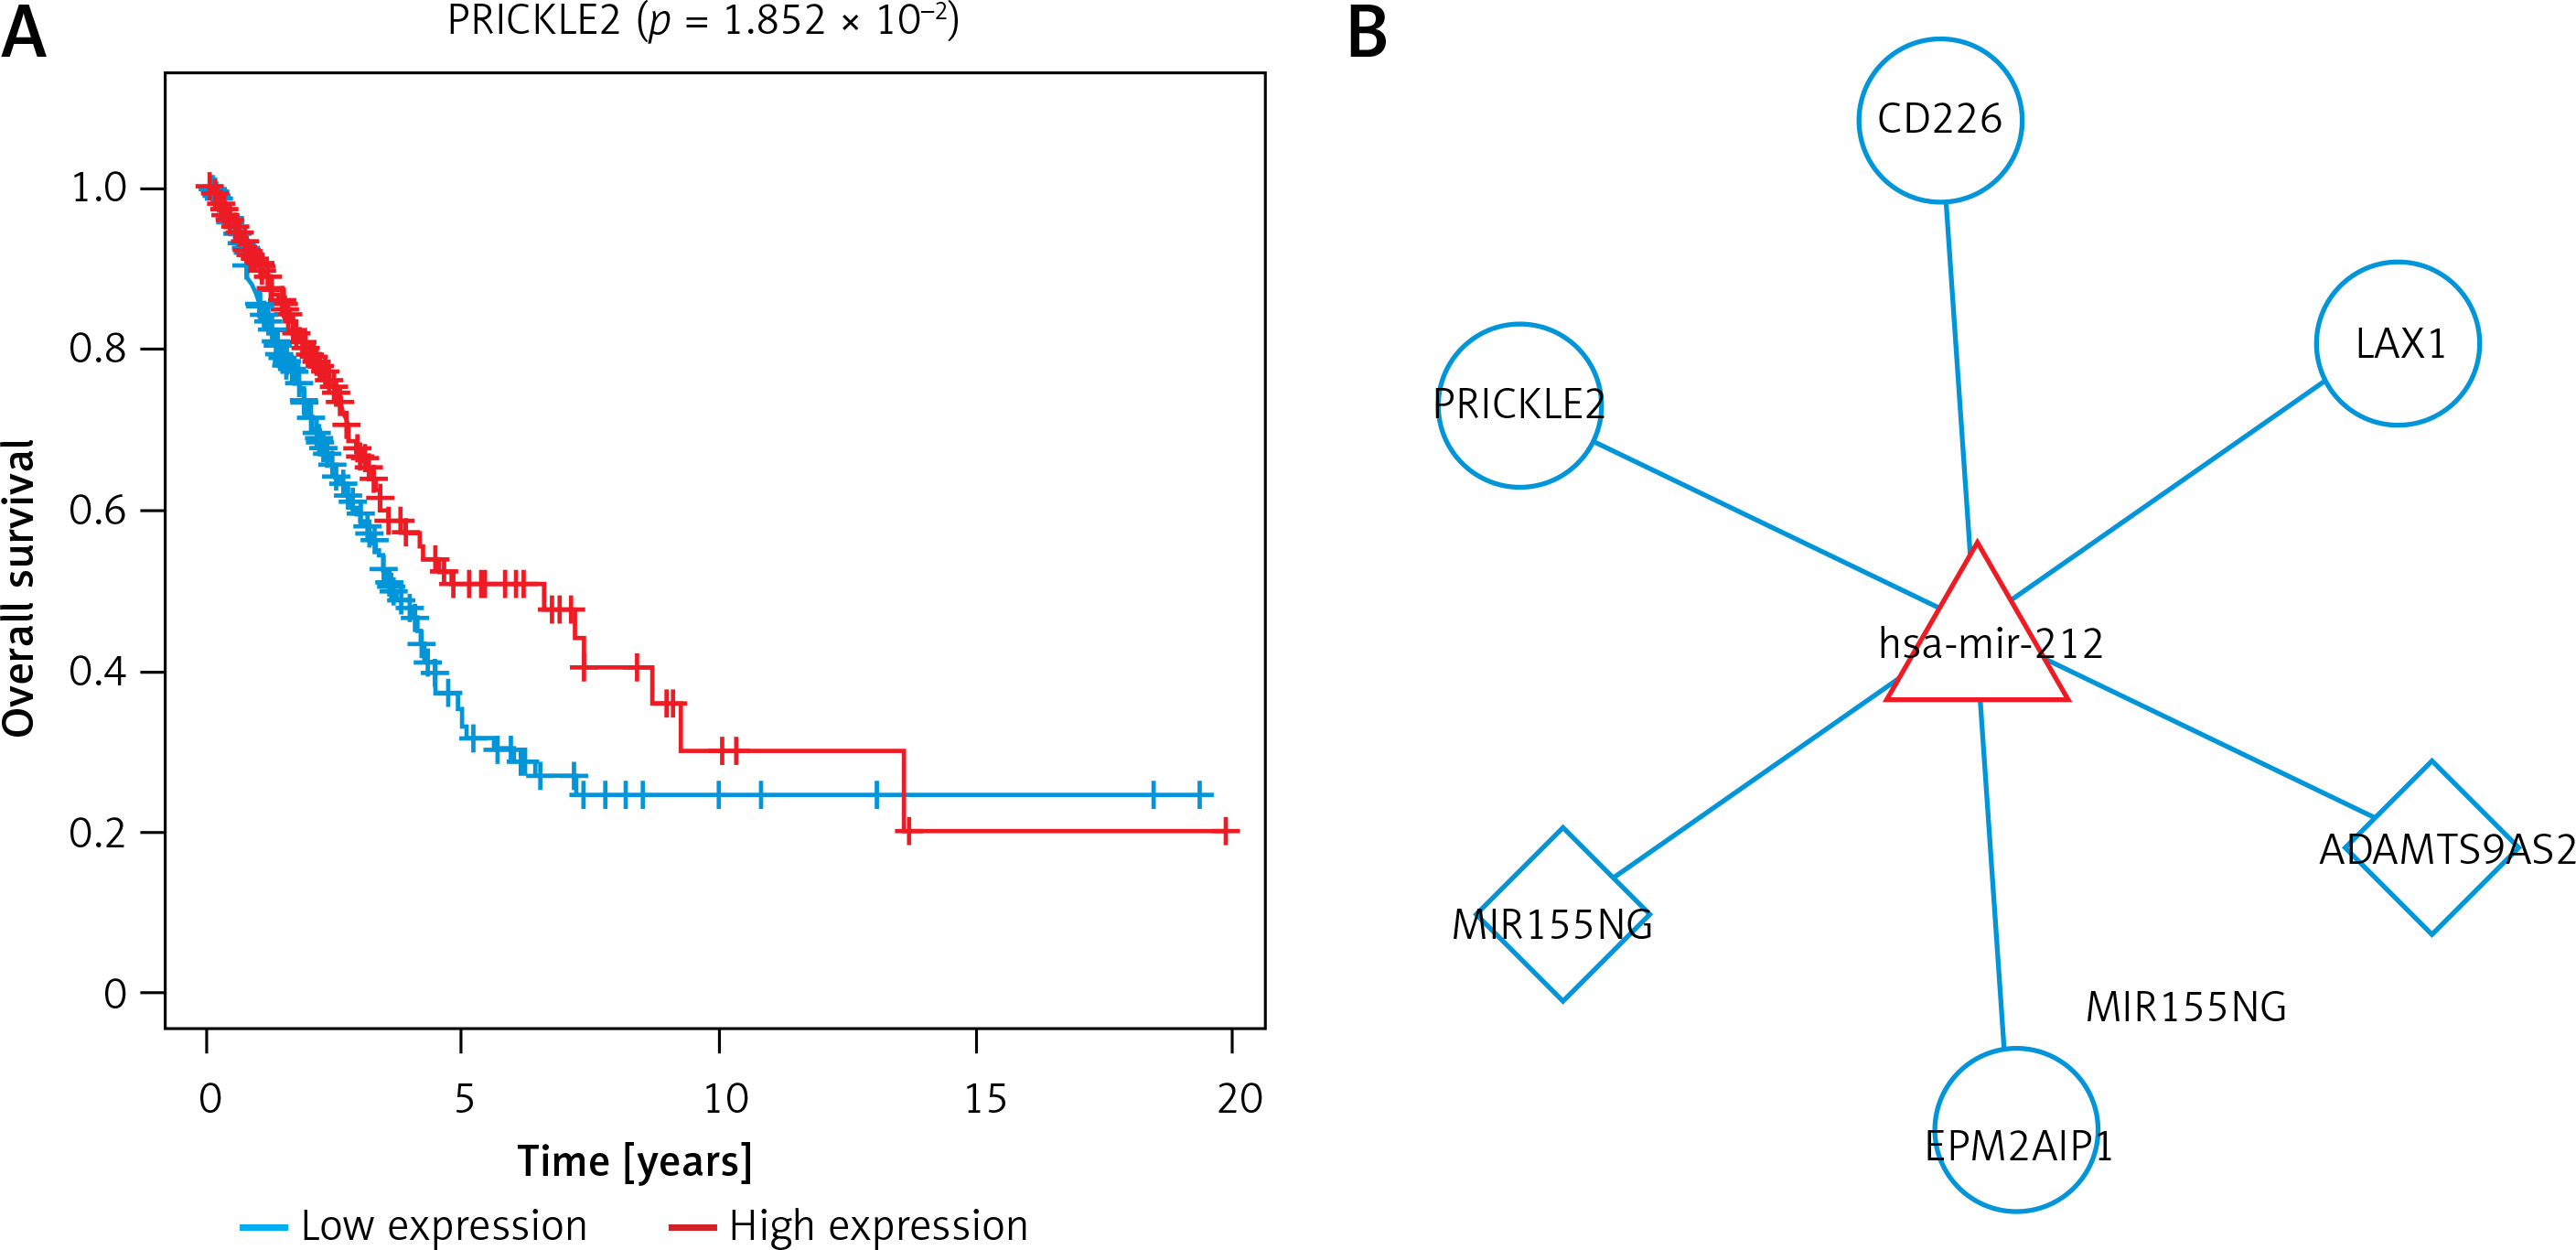
Additionally, the correlation between clinical characteristics and molecule expression in the prognosis-related ceRNA network was assessed by χ2 test and one-way ANOVA. As shown in Table III, statistical analysis indicated that the expression of six molecules (MIR155HG, ADAMTS9-AS2, EPM2AIP1, PRICKLE2, CD226, and mir-212) was significantly associated with the degree of spread to regional lymph nodes. The expression of ADAMTS9-AS2 and PRICKLE2 exhibited an obvious correlation with gender. There was a correlation of PRICKLE2 expression with distant metastasis. Also, the expression levels of LAX1 were correlated with the size of the original (primary) tumour. Additionally, MIR155HG, LAX1, CD226, and mir-212 expression levels were associated with clinical stage.
Table III
The correlation between clinical characteristics and molecules expression in a prognosis-related ceRNA network
To validate the roles of the prognosis-related ceRNA network in LUAD, we selected MIR155HG, miR-212, and CD226 from this network according to the previous reports regarding the interaction between the molecules in the ceRNA network and LUAD [20, 21] and performed in vitro experiments to explore their effects on LUAD cells.
LncRNA MIR155HG inhibits the proliferation, migration, and invasion of LUAD cells
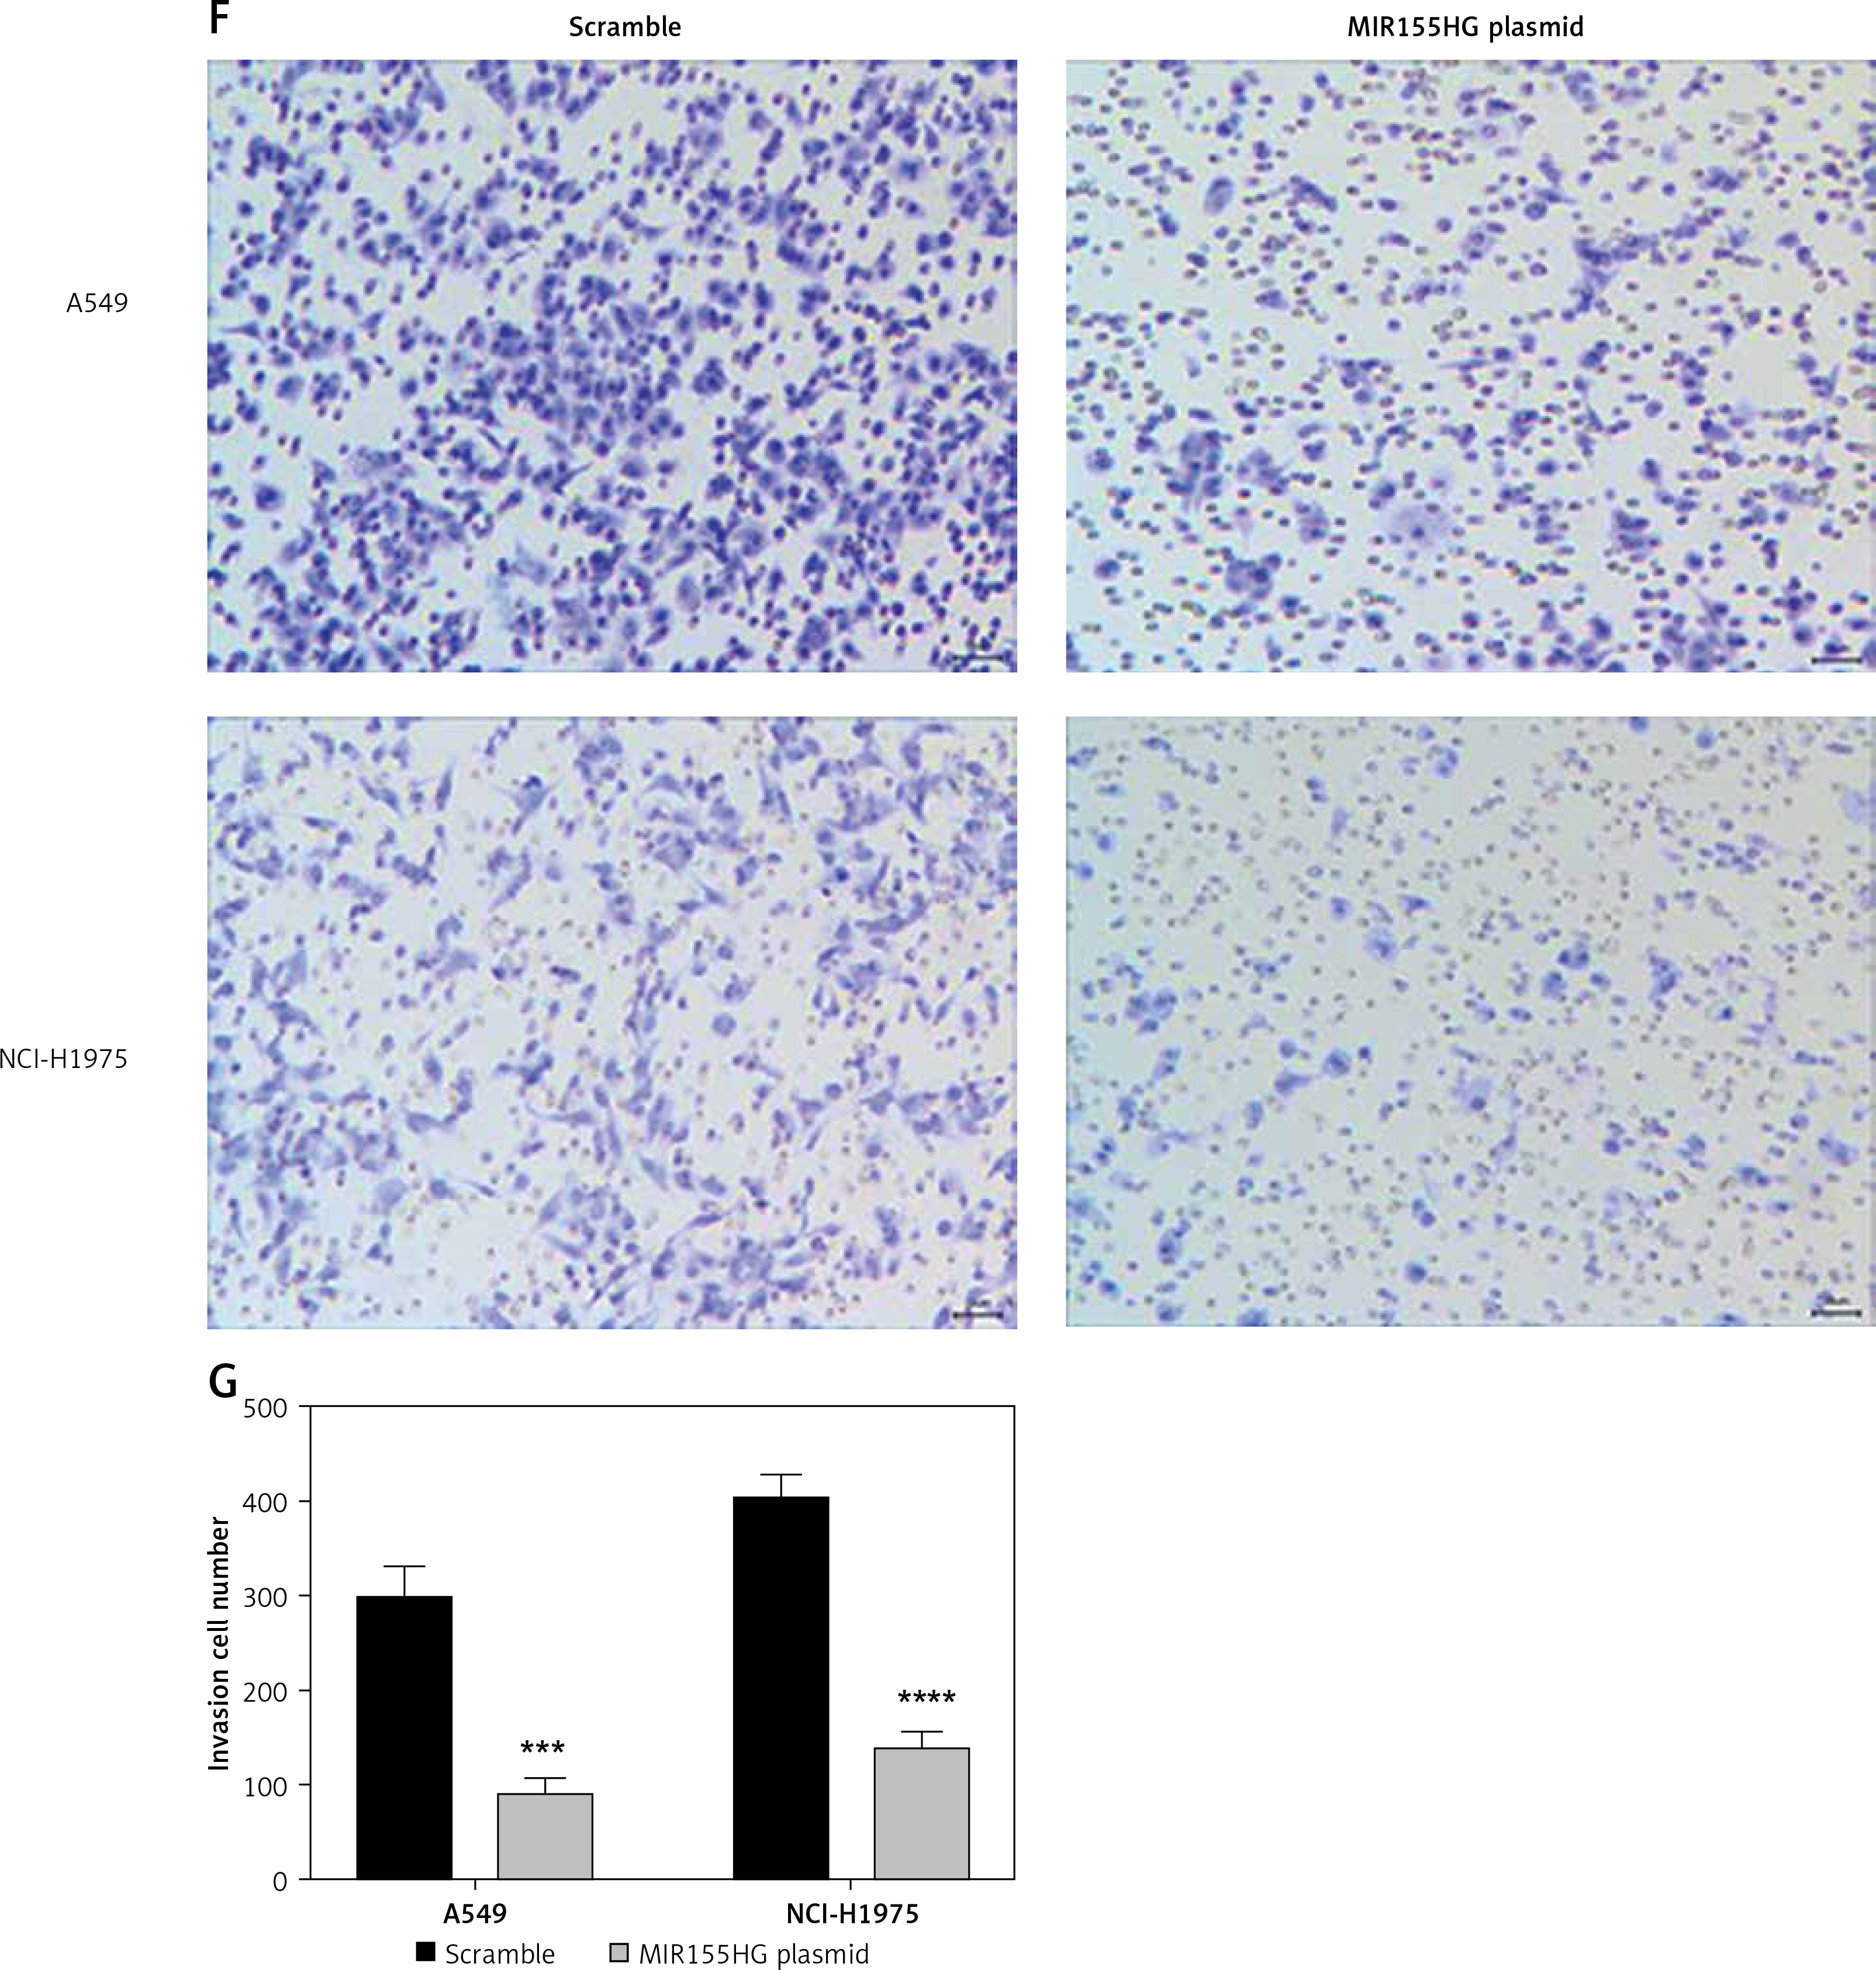
Firstly, RT-qPCR observed that the expression levels of MIR155HG in LUAD cell lines (NCI-H1299, A549, NCI-H1975) were lower than in human normal lung epithelial cells (BEAS-2B), which was consistent with the bioinformatics analysis results (Figure 5 A). Additionally, A549 and NCI-H1975 cells were chosen for the following experiments, because they had the lowest relative expression. Also, the transfection efficiency of MIR155HG plasmid in A549 and NCI-H1975 cells had a relatively high level compared with scramble plasmid as the control group (Figure 5 B). Furthermore, CCK8 assay results showed that MIR155HG overexpression obviously inhibited the proliferation of A549 and NCI-H1975 cells when compared with the control group (Figure 5 C). Moreover, compared with the control group, MIR155HG overexpression significantly suppressed the migration and invasion of A549 and NCI-H1975 cells (Figures 5 D–G).
Figure 5
The effect of lncRNA MIR155HG on lung adenocarcinoma cells. A – The expression levels of MIR155HG in LUAD cell lines (NCI-H1299, A549, NCI-H1975) and human normal lung epithelial cells (BEAS-2B) were detected by RT-qPCR. B – The transfection efficiency of MIR155HG plasmid was detected by RT-qPCR. The effects of MIR155HG on the proliferation (C), migration (D, E) Invasion (F, G) of LUAD cells were respectively measured by CCK8, wound healing, and Transwell invasion assays. **p < 0.01, ***p < 0.001, ****p < 0.0001 versus the scramble group
MIR155HG functions as a ceRNA of miR-212-3p and CD226 is a direct target of miR-212-3p
To verify the interaction among MIR155HG, miR-212-3p, and CD226, we separately performed dual luciferase reporter assay, RT-qPCR, and western blot. The binding sites of MIR155HG with miR-212-3p were identified by the miRcode database (Figure 6 A). The co-transfection of MIR155HG-WT with miR-212-3p mimic in LUAD cells considerably down-regulated the relative luciferase activity in comparison to its co-transfection with miRNA mimic control (NC mimic); however, there was no significant difference between MIR155HG-MUT co-transfected with miR-212-3p mimic and the NC mimic (Figure 6 B). Dual luciferase reporter assay confirmed that MIR155HG could directly interact with miR-212-3p (Figure 6 B). After LUAD cells were respectively transfected with MIR155HG plasmid, scramble plasmid, siRNA MIR155HG (si-MIR155HG), and siRNA control (si-NC), the expression of miR-212-3p was up-regulated by MIR155HG knockdown, while the level of miR-212-3p was down-regulated by MIR155HG overexpression (Figure 6 C). MIR155HG negatively regulated miR-212-3p expression. Collectively, MIR155HG could function as a ceRNA of miR-212-3p.
Figure 6
MIR155HG functions as a sponge of miR-212-3p and CD226 is a target of miR-212-3p. A – The binding sites between MIR155HG and miR-212-3p. B – The binding relationship was validated by the dual luciferase reporter gene assay. C – The expression of miR-212-3p in LUAD cells transfected with MIR155HG plasmid, siRNA MIR155HG (si-MIR155HG), or corresponding controls was detected by RT-qPCR. D – The binding sites between miR-212-3p and CD226. E – The binding relationship was validated by the dual luciferase reporter gene assay. The expression levels of CD226 in LUAD cells transfected with an miR-212-3p mimic, inhibitor, or controls were respectively detected by (F) RT-qPCR The expression levels of CD226 in LUAD cells transfected with an miR-212-3p mimic, inhibitor, or controls were respectively detected by (F) RT-qPCR and (G, H) western blot. ***p < 0.001, ****p < 0.0001 versus NC mimic, si-NC or inhibitor control; ###p < 0.001, ####p < 0.0001 versus scramble or miR-NC
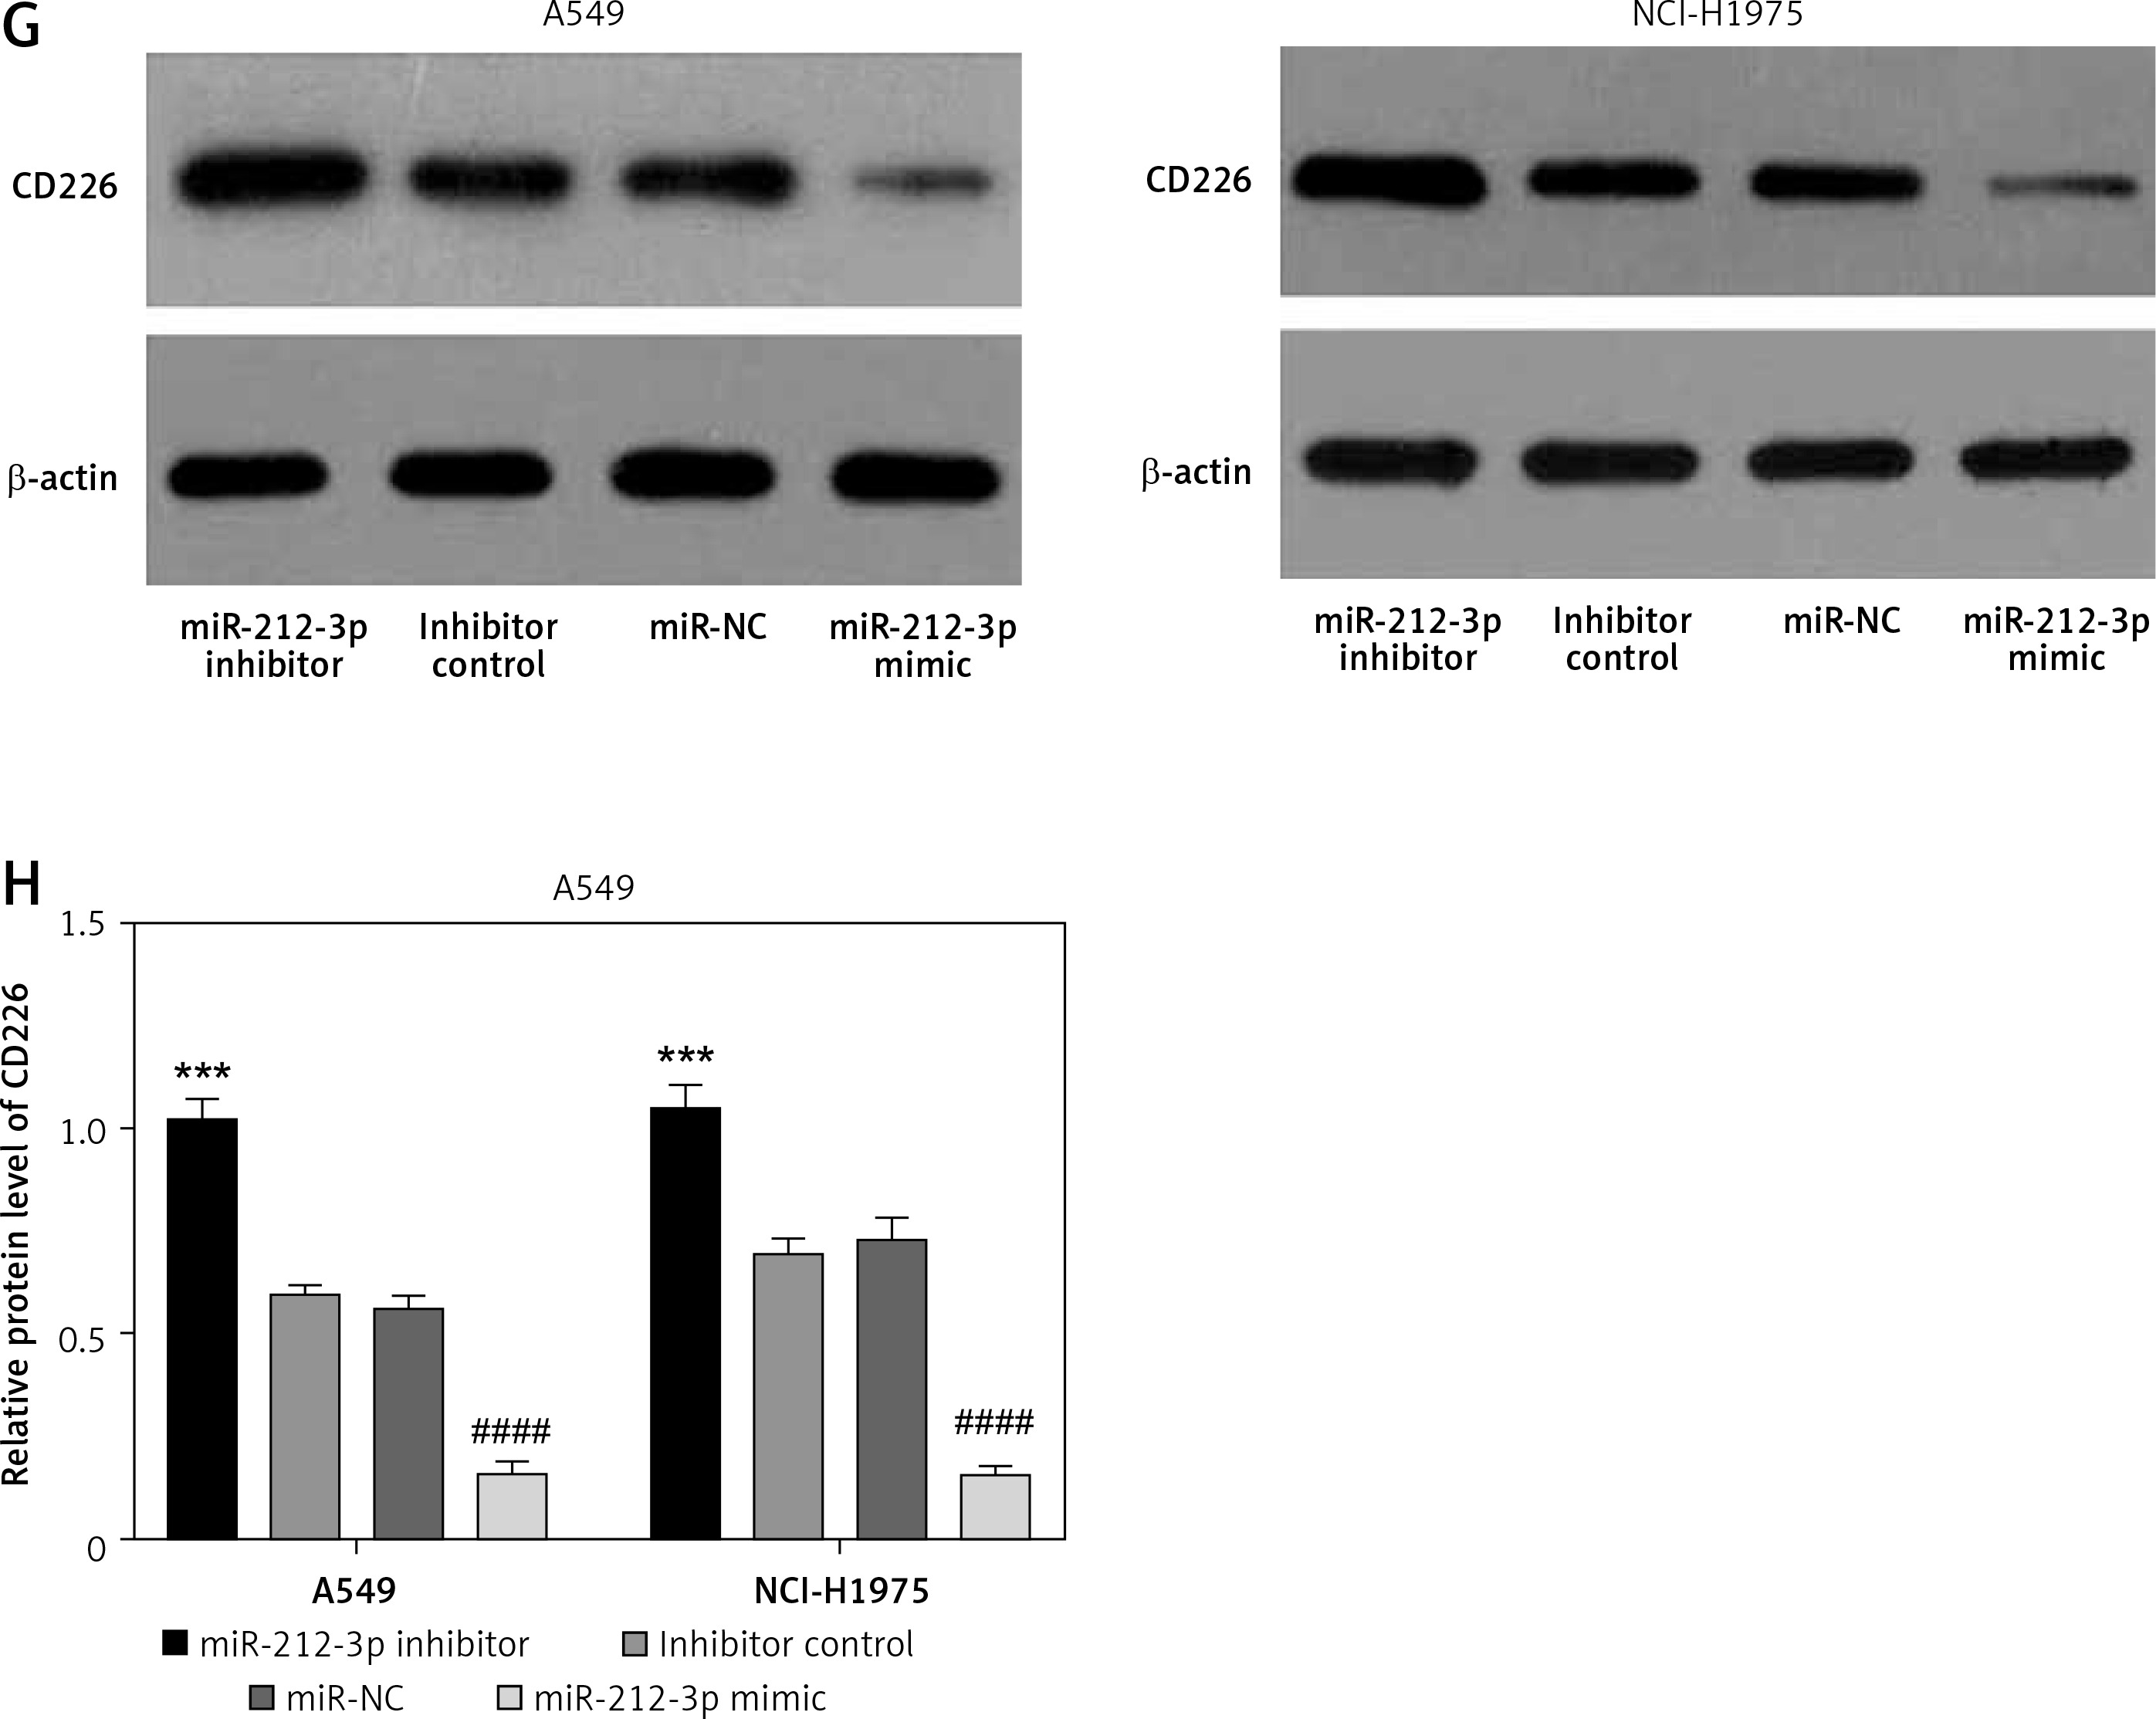
The binding sites between miR-212-3p and CD226 were predicted by the miRTarBase database (Figure 6 D). Dual luciferase reporter assay further confirmed that miR-212-3p could directly target CD226 (Figure 6 E). RT-qPCR and western blot showed that miR-212-3p mimic downregulated the expression of CD226, but miR-212-3p inhibitor up-regulated CD226 expression (Figures 6 F–H). Therefore, CD226 was a target gene of miR-212-3p. These findings confirmed the results of the prognosis-related ceRNA network.
MIR155HG inhibits the proliferation, migration, and invasion of LUAD cells through regulation of the miR-212-3p/CD226 axis
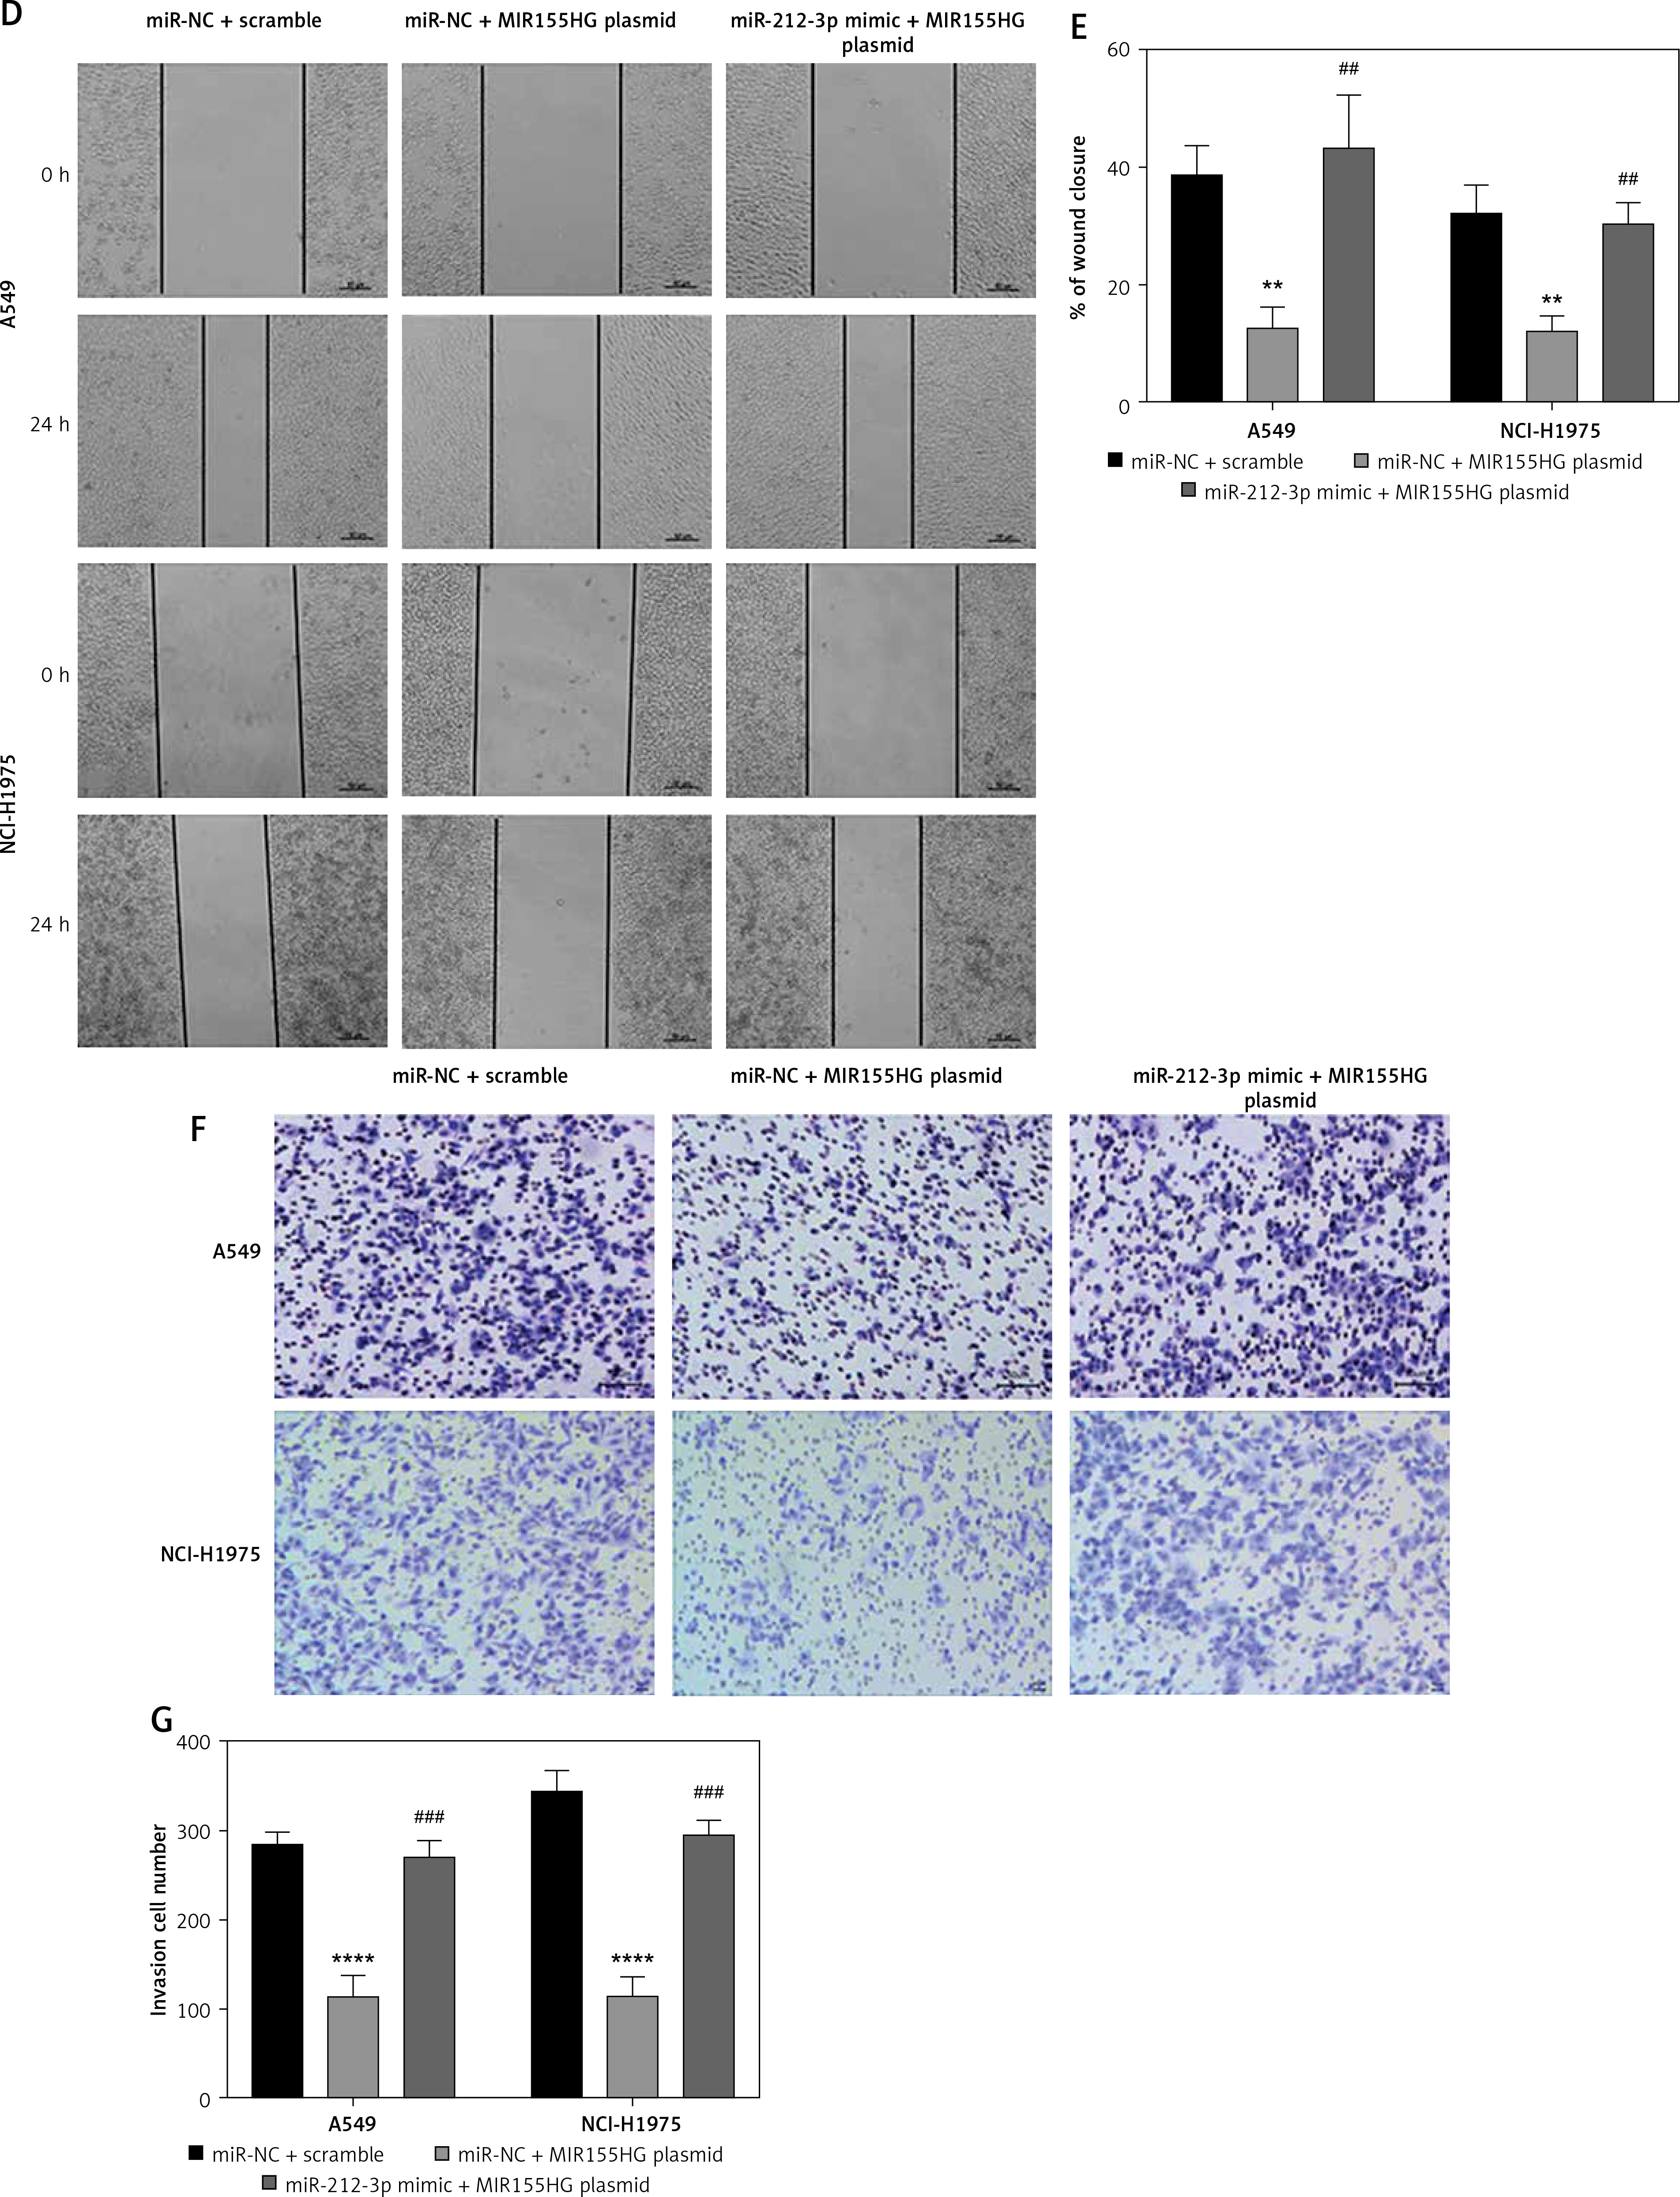
To study the roles of MIR155HG, miR-212-3p, and CD226 in LUAD cells, LUAD cells after co-transfection of MIR155HG plasmid combined with or without miR-212-3p mimic were respectively determined by western blot, CCK8, wound healing assay, and Transwell invasion assay. MIR155HG plasmid obviously enhanced the expression of CD226, but this situation was reversed by the introduction of miR-212-3p mimic (Figures 7 A, B). The inhibition of the proliferation of LUAD cells caused by MIR155HG plasmid was changed by the introduction of miR-212-3p mimic (Figure 7 C). Furthermore, the migration and invasion of the cells were suppressed by MIR155HG plasmid, which was improved in LUAD cells co-transfected with MIR155HG plasmid and miR-212-3p mimic (Figures 7 D–G). Therefore, MIR155HG overexpression inhibited the cellular proliferation, migration, and invasion through sponging miR-21-3p to regulate CD226 expression.
Figure 7
MIR155HG inhibits the growth of lung adenocarcinoma cells through regulation of the miR-212-3p/CD226 axis. After LUAD cells were transfected with miR-NC+ scramble-miR-NC + MIR155HG plasmid, and miR-212-3p mimic + MIR155HG plasmid, (A, B) the protein expression of CD226 was determined by western blot; (C) the cell proliferation was measured by CCK-8 The cell (D, E) migration and (F, G) invasion were respectively detected by wound healing assay and Transwell invasion assay. ***p < 0.001, ****p < 0.0001 versus miR-NC + scramble; ##p < 0.01, ####p < 0.0001 versus miR-NC + MIR155HG plasmid
Discussion
Over half of LUAD cases are diagnosed as advanced metastatic disease with very poor prognosis [8, 10]. Therefore, the exploration of the pathogenesis mechanism of LUAD is urgent and necessary in order to finding effective diagnoses and treatments. LncRNAs play an important role in many cellular processes such as proliferation, differentiation, and metastasis [15], and the dysregulation of lncRNAs has been closely related to the progression of cancer [16, 17]. Moreover, lncRNAs can function as ceRNAs to regulate gene expression through sponging miRNAs [14]. Thus, lncRNAs have received more and more attention. In the present study, we explored lncRNA-miRNA-mRNA ceRNA networks in LUAD using bioinformatics tools and validated the interactions among lncRNA, miRNA, and mRNA by biological experiments.
Based on the TCGA database, we obtained LUAD datasets and divided the patients into two groups (metastasis and non-metastasis groups). Then, we analysed the differential expression of lncRNAs, miRNAs, and mRNAs, and obtained 854 DELs, 150 DEMs, and 2211 DEGs between metastasis and non-metastasis LUAD patients. Combined with the target relationship of DEMs with lncRNAs and mRNAs, we obtained 44 lncRNA-miRNA pairs and 132 miRNA-mRNA pairs, including 15 lncRNAs, 7 miRNAs, and 91 mRNAs, and constructed the lncRNA-miRNA-mRNA ceRNA network. mRNAs in the ceRNA network were enriched through GO and KEGG pathway analysis. For GO terms, the mRNAs were mostly associated with small GTPase-mediated signal transduction, chromosomal region, and chromatin binding. For KEGG pathway analysis, the pathways significantly correlated to LUAD metastasis including p53 signalling pathway and transcriptional misregulation in cancer.
To further screen the ceRNA network, we downloaded the prognosis-related clinical information of the ceRNA network and analysed the OS of each molecule in the ceRNA networks. Combined with the interaction among lncRNA, miRNA, and mRNA, we obtained 2 lncRNA-miRNA interaction pairs and 4 miRNA-mRNA interaction pairs, including 1 miRNA, 2 lncRNAs, and 4 mRNAs, to construct the prognosis-related ceRNA network. In this network, MIR155HG and ADAMTS9-AS2 can function as ceRNAs of miR-212 to regulate EPM2AIP1, LAX1, PRICKLE2, and CD226. These molecules were associated with OS and could be valuable predictive factors for the prognosis of LUAD patients. For instance, ADAMTS9-AS2 acts as a tumour suppressor or a carcinogenic factor in different cancers [22–24], and ADAMTS9-AS2 has been proven to be a potential predictive biomarker in LUAD and breast cancer [25, 26]. In addition, the aberrant expression of miR-212-3p has been linked to cell proliferation, adhesion, differentiation, and migration [27].
To validate the roles of the molecules in the prognosis-related ceRNA network in LUAD, we randomly selected MIR155HG, miR-212-3p, and CD226 for in vitro experiments. Firstly, MIR155HG was found to be downregulated in LUAD cells, which was consistent with the bioinformatics results. MIR155HG overexpression inhibited the proliferation, migration, and invasion of LUAD cells. Furthermore, our prognosis analysis indicated that high expression of MIR155HG had a relatively good prognosis compared with its low expression. Thus, MIR155HG can be considered as a tumour suppressor in LUAD and a potential prognosis biomarker. These findings are in agreement with previous reports. Peng et al. found that a high level of MIR155HG, as a potential prognostic biomarker, was closely correlated with better OS in LUAD, cholangiocarcinoma, and skin cutaneous melanoma [20]. Secondly, our study confirmed that MIR155HG could function as a ceRNA of miR-212-3p, and CD226 was a direct target gene of miR-212-3p, which was consistent with the result of the prognosis-related ceRNA network. Thirdly, the high expression of CD226 induced by MIR155HG overexpression was changed by the introduction of miR-212-3p mimic. In addition, the inhibition of the proliferation, migration, and invasion of LUAD cells caused by MIR155HG overexpression was reversed in LUAD cells co-transfected with MIR155HG plasmid and miR-212-3p mimic. Previous reports suggested that CD226 was involved in tumour immune responses and regulation of the natural killer cell anti-tumour response [28–30]. Moreover, it has been reported that CD226 is critical for the metastasis of lung cancer cells [21]. Collectively, MIR155HG inhibited the proliferation, migration, and invasion of LUAD cells through sponging miR-212-3p to regulate CD226 expression.
In conclusion, our study constructed a prognosis-related ceRNA network to understand the pathogenesis of LUAD. The results indicated that MIR155HG and ADAMTS9-AS2 can function as ceRNAs to sponge miR-212-3p to regulate EPM2AIP1, LAX1, PRICKLE2, and CD226. Furthermore, the interaction among MIR155HG, miR-212-3p, and CD226 was validated by biological experiments, indicating that MIR155HG inhibited the growth of LUAD through the miR-212-3p/CD226 axis. These initial findings urge further experiments to validate the remaining lncRNA-miRNA-mRNA interactions in the ceRNA network.