Introduction
The incidence of pancreatic cancer (PC) is increasing each year, and it is an aggressive cancer that affects the digestive system. Over 490,000 new PC cases were identified in 2020, and 460,000 PC deaths occurred globally [1]. Currently, surgery is still a common form of treatment for PC, but it comes with a significant risk of postoperative recurrence and metastasis [2]. Due to the insidious onset and high degree of malignancy of PC, 80% to 85% of patients lose the chance of surgical resection after diagnosis [3]. Therefore, there is an urgent need to explore the mechanism of PC to find molecular markers for early diagnosis, prognosis and novel targets for therapy.
Long non-coding RNAs (lncRNAs) have been considered as ‘junk DNA’ in the past due to the lack of a complete open reading frame and no protein-coding function [4]. With the in-depth research on molecular biology, the potential biological functions of lncRNAs have been continuously explored. Many studies have revealed that lncRNAs have a substantial function in the progression of several tumor cells, together with PC [5, 6]. LncRNA CYTOR accelerated the malignancy of PC by facilitating cell growth and migration [7]. Zhang et al. reported that lncRNA LINK-A promoted the development of early-stage PC by increasing ROCK1 expression [8]. Here, we used the GEPIA database to find that Long intergenic nonprotein coding RNA 847 (LINC00847) was upregulated in pancreatic adenocarcinoma samples. After checking the literature, LINC00847, a newly discovered lncRNA, was reported to contribute to non-small cell lung cancer progression [9] and hepatocellular carcinoma progression [10]. Nevertheless, there is no information available on LINC00847’s precise PC function.
LncRNAs, as competitive endogenous RNAs (ceRNAs), can interact with microRNAs (miRNAs) to affect the incidence and progression of tumors [11, 12]. MiR-455-3p can interact with lncRNA to take part in the development of many tumors. By way of illustration, miR-455-3p sponged by LINC00472 could worsen the progression of oral squamous cell carcinoma [13]. Oppositely, miR-455-3p interacted with LINC00319 to suppress osteosarcoma progression [14]. In PC, Zhan et al. confirmed that miR-455-3p restrained PC tumor progression by suppressing the TAZ and Wnt/β-catenin pathway [15]. Nevertheless, the interaction between miR-455-3p and LINC00847 in PC progression remains unknown.
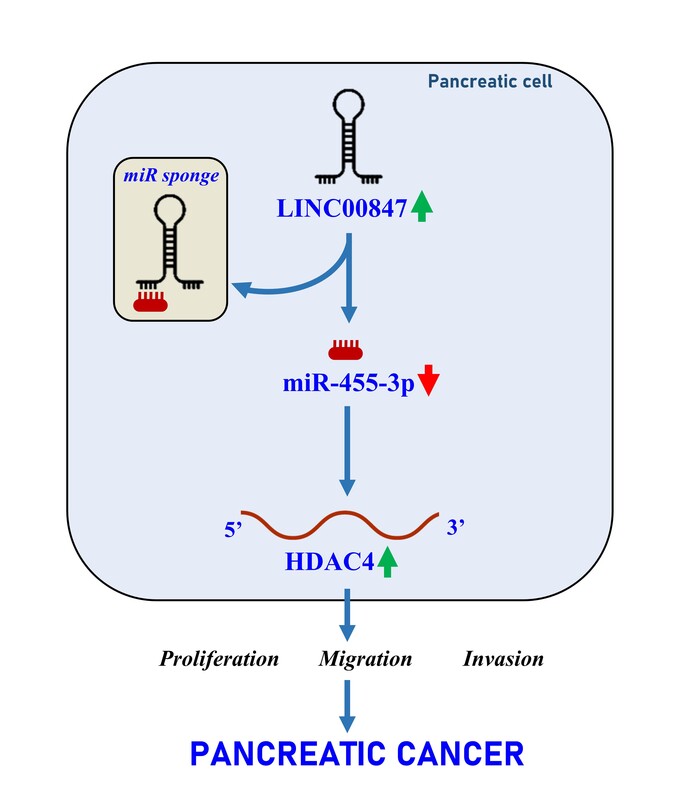
In the current study, we investigated the expression and functional role of LINC00847 in PC progression by molecular biological approaches. We found that knockdown of LINC00847 regulated tumor progression by blocking miR-445-3p and increasing histone deacetylase 4 (HDAC4).
Based on our findings, we highlighted the potential of LINC00847 as a therapeutic target for PC.
Material and methods
Tissue specimens and cell lines
Clinical samples could be taken from Wuhan University of Science and Technology Hospital with the approval of its ethics committee. No patients had undergone medical therapy or radiation previous to surgery, and all of them had PC that was pathologically confirmed. A total of 35 PC specimens and paired adjacent non-tumor specimens were collected and stored in a –80°C refrigerator. Before obtaining tissues samples, the patients were informed and signed the informed consent.
The BeNa Culture Collection provided the PC cell line (Capan-1) as well as the human pancreatic normal ductal epithelial cell (HPDE) cell line. The other PC cell lines (HuP-T3 and PSN-1) were obtained from Beijing Zhongyuan Ltd. (China). PSN-1 and HPDE cells were grown in RPMI-1640 media with 10% FBS from Procell (China), Capan-1 cells were cultured in IMDM medium with 20% FBS from Procell, and HuP-T3 cells were cultivated in MEM medium with 10% FBS from Procell. Cells were incubated in a constant temperature incubator (37°C, 5% CO2).
Cell transfection
Two small interfering RNAs (siRNA) targeting LINC00847 (si-LINC00847-1 and si-LINC00847-2), the siRNA negative control (si-NC), the miR-455-3p mimic, the mimic negative control (mimic-NC), the HDAC4 overexpression vector (HDAC4-OE), and the empty vector as the negative control of overexpression vector were synthesized by GenePharma (Shanghai, China). Capan-1 and PSN-1 cells (4 × 10⁵ cells/well) were cultured on a 6-well plate under the following conditions: 37°C and 5% CO2. When the cell confluence was more than 60%, the vectors mentioned above were transfected into Capan-1 and PSN-1 cells using Lipofectamine 3000 (Thermo Fisher, USA) according to the instructions. After 48 h of cell transfection, the transfection efficiency for each vector was evaluated by RT-qPCR.
RT-qPCR
Total RNA was extracted from tissues as well as cells using Trizol (Invitrogen, USA). Briefly, 1 ml of Trizol was added into tissues and cells for 5 min of quiescence. After centrifugation at 12 000× g for 15 min at 4°C, 0.2 ml of chloroform was added to the isolated RNA in the supernatant for 3 min quiescence, then RNA was precipitated using 0.5 ml of isopropanol for 10 min quiescence, and finally purified using 1 ml of 75% ethyl alcohol for 10 min quiescence. The isolated RNA was dissolved in RNase-free H2O, the RNA concentration was detected using the ratio of OD260 to OD280, and the quality of total RNA was confirmed using agarose electrophoresis. The TIANScript II RT Kit (TIANGEN, China) reverse-transcribed 500 ng of RNA into cDNA. For qPCR amplification, Genious 2× SYBR Green Fast qPCR Mix (ABclonal Technology Co., Ltd., China) was utilized with the following conditions: 95°C for 3 min, and 40 cycles of 95°C for 5 s and 60°C for 30 s. The 2–ΔΔCt method was used to calculate the relative levels of LINC00847, HDAC4 and miR-455-3p after normalizing to GAPDH and U6. The primer sequences are depicted in Table I.
Table I
Primer sequences
Nuclear and cytoplasmic RNA fractionation
Nuclear and cytoplasmic RNA was extracted from Capan-1, PSN-1 cells by the Minute Cytoplasmic and Nuclear Fractionation kit (Invent, USA). The distribution of LINC00847 in the cytoplasm and nucleus was measured by RT-qPCR with the references of GAPDH and U6.
Cell counting kit 8 (CCK-8) assay
The digested and resuspended cells were in the logarithmic phase. Following dilution, 96-well plates were seeded with a 100 µl cell suspension (3000 cells per well). Each well received 10 µl of CCK-8 reagent (Beyotime, China) at a separate time (0, 24, 48, 72, and 96 h). A microplate reader measured the absorbance value of each well at 450 nm after 2 h of incubation (TECAN, Switzerland).
Colony formation assay (CFA)
Six-well plates received an injection of 500 cells, which were then grown at 37 °C and 5% CO2. Cells were fixed (4% paraformaldehyde for 10 min) and stained after 2 weeks (0.1% crystal violet for 15 min). The number of colonies was counted and photographed with a microscope.
Transwell assay
The surface of the top Transwell chamber (Corning, USA) was coated with 50 mg/µl Matrigel dilution (Biosciences, USA). Cell suspension (2 × 10⁵ cells/well) without FBS was inoculated into the upper chamber of the Transwell, and in the lower compartment, 600 µl of 10% FBS media was added. The cells were fixed with 4% paraformaldehyde and stained with crystal violet after 48 h of incubator culture. An inverted microscope (Olympus, Japan) was used to capture images of five randomly chosen fields from each well, after which the number of cells was determined.
Scratch test
5 × 10⁵ cells were inoculated on a 6-well plate and cultured at 37°C for 24 h. When the cell confluence was more than 90%, the cells were scratched vertically with the 10 µl tip. After 0 h and 48 h, the plate was placed under the microscope and photographed. ImageJ software was used to calculate the scratch healing rate.
Dual-luciferase reporter (DLR) assay
The mutant-type and wild-type 3′UTR fragments of LINC00847 and HDAC4 were inserted into pGL3 vectors to construct mutant-type and wild-type of LINC00847 (LINC00847-MUT, LINC00847-WT) and HDAC4 (HDAC4-WT, HDAC4-MUT), respectively. LINC00847-WT, LINC00847-MUT, HDAC4-WT, and HDAC4-MUT were co-cultured with miR-455-3p mimic and mimic-NC by Lipofectamine 3000 (Thermo Fisher, USA). After a 48-hour incubator culture, each group’s luciferase activity was measured using a dual-luciferase reporter gene detection kit (TransGen Biotech, China).
Western blot assay
The total protein was collected by RIPA lysate (Solarbio, China). The presence of protein was measured using the BCA Protein Assay Kit (Beyotime, China). The protein samples were electrophoresed on SDS-PAGE gels, transferred to PVDF membranes (Millipore, USA), and then blocked for a period of 1 to 2 h at room temperature with non-fat milk (5%). After that, the membrane was treated at 4 °C overnight with primary antibodies (anti-HDAC4, 1 : 1000, ab12172, Abcam, USA; anti-GAPDH, 1 : 3000, ab9485, Abcam). The secondary antibody (anti-rabbit IgG/HRP, 1 : 5000, ab205718, Abcam) was then applied to the membrane and left at room temperature for 1 h. ECL illuminating solution from Millipore (USA) was then used to see the bands.
Xenograft mouse model
Five-week-old female BALB/C nude mice were acquired from our hospital’s animal laboratory. The nude mice were kept in the animal room with constant temperature and humidity and no specific pathogens. Mice’s left forelimb was subcutaneously injected with sh-LINC00847 or sh-NC, which had been introduced to PSN-1 cells in the lentivirus vector. Every 4 days, the tumor volumes in every group were measured using a vernier caliper and calculated with the following formula: tumor volume = short diameter2 × long diameter/2. The mice were euthanized using pentobarbital sodium after 28 days of consuming a normal diet. The tumors were taken out, weighed, and captured on camera. The Animal Ethics Committee of Wuhan University of Science and Technology Hospital gave its approval for the animal experiment.
Statistical analysis
SPSS22.0 software (IBM, USA) was used for statistical analysis, and all data from three independent experiments were shown as mean ± standard deviation. The t-test was performed to analyze the statistical significance of differences between two groups, whereas one-way ANOVA was used to analyze the statistical significance of variation among multiple groups. The relationships among LINC00847, miR-22-3p and HDAC4 were confirmed by Pearson’s correlation analysis. A p-value less than 0.05 indicates statistical significance.
Results
LINC00847 expression level is overexpressed in PC
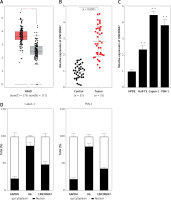
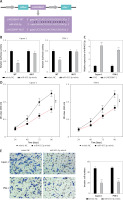
According to the data from GEPIA, LINC00847 expression was found to be upregulated in pancreatic adenocarcinoma (PAAD) samples (Figure 1 A). Then, LINC00847 expression in PC tissues and cells was verified utilizing RT-qPCR. In comparison with non-tumor tissues using the t-test, elevated LINC00847 was verified in PC tissues (p < 0.0001, Figure 1 B). Similarly, LINC00847 was overexpressed in HuP-T3, Capan-1 and PSN-1 cells compared with HPDE cells using one-way ANOVA (p < 0.001, Figure 1 C). Additionally, LINC00847 was mainly localized in the cytoplasm (Figure 1 D). Therefore, our data indicated that LINC00847 is overexpressed in PC and may be involved in PC progression.
Figure 1
LINC00847 expression level is overexpressed in PC. A – GEPIA showed the expression of LINC00847 in pancreatic adenocarcinoma (PAAD) samples. *p < 0.01. B – The expression of LINC00847 in PC tissues and non-tumor tissues was assessed by RT-qPCR. C – The expression of LINC00847 in HuP-T3, Capam-1, PSN-1 and HPDE cells was detected by RT-qPCR, **p < 0.001 compared to HPDE. D – The distribution of LINC00847 in the cytoplasm and nucleus was measured by RT-qPCR
Knockdown of LINC00847 decreases cell growth of Capan-1 and PSN-1 cells
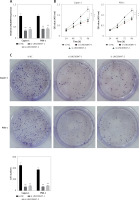
To evaluate the function of LINC00847 in PC progression, si-RNAs of LINC00847 were co-expressed into Capan-1 as well as PSN-1 cells to reduce the LINC00847 level. Results of RT-qPCR demonstrated that si-LINC00847-1 and si-LINC00847-2 both successfully depleted LINC00847 expression compared to si-NC using one-way ANOVA (p < 0.001, Figure 2 A). Through CCK-8 detection, the proliferation ability of Capan-1 and PSN-1 cells with si-LINC00847 was notably blocked compared to the si-NC group using one-way ANOVA (p < 0.001, Figure 2 B). Additionally, LINC00847 silencing suppressed the clonogenic ability of Capan-1 and PSN-1 cells compared to si-NC using one-way ANOVA (p < 0.001, Figure 2 C). All findings indicated that knockdown of LINC00847 blocked cell growth of PC cells.
Figure 2
Knockdown of LINC00847 decreases cell growth of Capan-1 and PSN-1 cells. A – The expression of LINC00847 in Capan-1 and PSN-1 cells transfected with LINC00847 siRNAs (si-LINC00847-1, si-LINC00847-2) was detected by RT-qPCR. B – Cell proliferation in Capan-1 and PSN-1 cells transfected with LINC00847 siRNAs (si-LINC00847-1, si-LINC00847-2) was explored by CCK-8 assay. C – The clonogenic ability of Capan-1 and PSN-1 cells transfected with LINC00847 siRNAs (si-LINC00847-1, si-LINC00847-2) was detected by colony formation assay. **p < 0.001 compared to si-NC
Knockdown of LINC00847 hinders cell invasion and migration of Capan-1 and PSN-1 cells
To examine how LINC00847 affected Capan-1 and PSN-1 cells’ capacity for invasion and migration, transwell and scratch assays were used. Capan-1 and PSN-1 cells’ capacity to migrate was considerably inhibited when LINC00847 was knocked down as opposed to the si-NC group using one-way ANOVA (p < 0.001, Figure 3 A). Additionally, the capacity of Capan-1 and PSN-1 cells to invade was observed to be inhibited by LINC00847 silencing (p < 0.001 using one-way ANOVA, Figure 3 B). These findings suggested that LINC00847 knockdown prevented PC cells from migrating and invading.
Figure 3
Knockdown of LINC00847 suppresses cell invasion and migration of Capan-1 and PSN-1 cells. A – Cell migration in Capan-1 and PSN-1 cells transfected with LINC00847 siRNAs (si-LINC00847-1, si-LINC00847-2) was explored by Scratch test. **p < 0.001 compared to si-NC. B – Cell invasion in Capan-1 and PSN-1 cells transfected with LINC00847 siRNAs (si-LINC00847-1, si-LINC00847-2) was explored by Transwell assay. **p < 0.001 compared to si-NC

Knockdown of LINC00847 decreases tumor growth in vivo
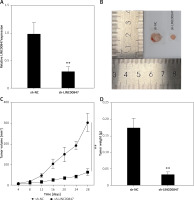
Animal tests were conducted to confirm that LINC00847 silencing had a tumor-suppressing impact. First, in nude mice, sh-LINC00847 was able to successfully reduce LINC00847 expression (p < 0.001 using t-test, Figure 4 A). The sh-LINC00847 group tumor volume was reduced as compare to the sh-NC group using the t-test (p < 0.001, Figures 4 B and C). Additionally, the sh-LINC00847 group’s tumor weight was lower than the sh-NC group (p < 0.001 using t-test, Figure 4 D). Therefore, it was demonstrated that LINC00847 knockdown inhibits tumor development in vivo.
Figure 4
Knockdown of LINC00847 decreases tumor growth in vivo. A – The expression of LINC0847 in Capan-1 cells with sh-LINC00847 was detected by RT-qPCR. B – Images of tumors transfected with sh-LINC00847 and sh-NC. C – Every 4 days, the tumor volumes of the sh-LINC00847 group and sh-control group were measured. D – After 28 days, the tumor weights of the sh-LINC00847 group and sh-NC group were measured. **p < 0.001 compared to sh-NC
MiR-455-3p, a direct target of LINC00847, blocks PC progression
The StarBase database showed that the LINC00847 sequence included the binding sites in miR-455-3p (Figure 5 A). Dual-luciferase reporter (DLR) analysis was carried out to evaluate the binding activity among miR-455-3p as well as LINC00847. Compared with LINC00847-MUT and miR-455-3p mimics co-transfected cells using one-way ANOVA, miR-455-3p mimics and LINC00847-WT co-transfected cells both showed significantly lower relative luciferase activity (p < 0.001, Figure 5 B). Evidently, LINC00847 silencing in Capan-1 and PSN-1 cells enhanced miR-455-3p expression (p < 0.001 using t-test, Figure 5 C). To examine the role of miR-455-3p in PC cells, we transfected miR-455-3p mimics into Capan-1 and PSN-1 cells. Increased miR-455-3p expression inhibited Capan-1 and PSN-1 cell invasion and proliferation compared to the mimic-NC group using the t-test (p < 0.001, Figures 5 D and E). According to the results, LINC00847 targeted miR-455-3p, and miR-455-3p mimics prevented progression of PC.
Figure 5
MiR-455-3p, a direct target of LINC00847, blocks PC progression. A – The binding sites between miR-455-3p and LINC00847 were predicted by StarBase. B – Dual-luciferase reporter assay was used to verify the relationship between LINC00847 and miR-455-3p, **p < 0.001 compared to mimic-NC. C – The expression of miR-455-3p was detected by RT-qPCR, **p < 0.001 compared to si-NC. D – Cell proliferation of Capan-1 and PSN-1 cells transfected with miR-455-3p mimic was detected by CCK-8 assay, **p < 0.001 compared to mimic-NC. E – Cell invasion of Capan-1 and PSN-1 cells transfected with miR-455-3p mimics was detected by Transwell assay, **p < 0.001 compared to mimic-NC
MiR-455-direct 3p’s target gene is HDAC4
The results of the StarBase database showed where miR-455-3p and HDAC4 bind (Figure 6 A). Furthermore, HDAC4 was found to be overexpressed in PC tissues by RT-qPCR (p < 0.0001 using t-test, Figure 6 B). According to Western blot analysis, Capan-1 and PSN-1 cells expressed more HDAC4 protein than HPDE cells (p < 0.001 using one-way ANOVA, Figure 6 C). Notably, miR-455-3p mimics decreased HDAC4-WT’s luciferase activity in Capan-1 and PSN-1 cells (p < 0.001 using one-way ANOVA, Figure 6 D). Furthermore, HDAC4 protein level was clearly decreased in Capan-1 as well as PSN-1 cells co-cultured with miR-455-3p mimics (p < 0.001 using t-test, Figure 6 E). According to the results of the Pearson’s correlation analysis, the expression of LINC00847 and HDAC4 in PC tissues were positively associated (Figure 6 F) and inversely associated with miR-455-3p in PC tissues (Figure 6 G). Additionally, miR-455-3p and HDAC4 level of expression had a negative correlation (Figure 6 H). These outcomes suggested that miR-455-3p may have HDAC4 as a direct target gene.
Figure 6
HDAC4 is a direct target gene of miR-455-3p. A – The matching sites between miR-455-3p and HDAC4 were predicted by StarBase. B – The mRNA expression of HDAC4 in PC tissues was examined by RT-qPCR, **p < 0.0001 compared to control. C – The protein expression of HDAC4 in HPDE, Capan-1 and PSN-1 cells was detected by Western blot assay, **p < 0.001 compared to HPDE cells. D – Dual-luciferase reporter assay was used to verify the relationship between HDAC4 and miR-455-3p, **p < 0.001 compared to mimic-NC. E – The protein expression of HDAC4 in Capan-1 and PSN-1 cells transfected with miRR-455-3p mimics was measured by western blotting, **p < 0.001 compared to mimic-NC. F – Pearson’s correlation analysis was used to explore the relationship between LINC00847 and HDAC4. G – The relationship between LINC00847 and miR-455-3p. H – The relationship between HDAC4 and miR-455-3p

HDAC4 overexpression reverses the effect of LINC00847 silencing
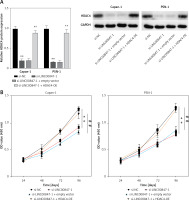
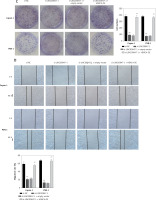
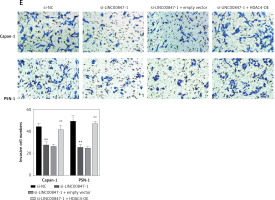
As shown in Figure 7 A, LINC0847 silencing suppressed HDAC4 expression, but HDAC4 overexpression disrupted the inhibition of IINC00847 silencing (p < 0.001, p < 0.001 using one-way ANOVA). Functionally, we found that HDAC4 overexpression revised the hindering effect of cell proliferation induced by LINC00847 silencing (p < 0.001 using one-way ANOVA, Figure 7 B). Additionally, LINC00847 silencing’s inhibitory effect on the capacity for clonogenicity was lessened by HDAC4 overexpression (p < 0.001 using one-way ANOVA, Figure 7 C). HDAC4 overexpression also reduced the impact of LINC00847 silencing on the capacity of cells to invade and migrate (p < 0.001 using one-way ANOVA, Figures 7 D, E). Our data indicated that HDAC4 overexpression reversed the effect of LINC00847 silencing in PC.
Figure 7
HDAC4 overexpression reverses the effect of LINC00847 silencing on PC cells. A – The protein expression of HDAC4 in Capan-1 and PSN-1 cells transfected with LINC00847 silencing was detected by Western blot assay. B – Cell proliferation of Capan-1 and PSN-1 cells was detected by CCK-8 assay. C – The clonogenic ability of Capan-1 and PSN-1 cells was explored by colony formation assay. D – Cell migration of Capan-1 and PSN-1 cells was explored by scratch test. E – Cell invasion of Capan-1 and PSN-1 cells was explored by Transwell assay. **p < 0.001 compared to si-NC; ##p < 0.001 compared to si-LINC00847-1 + empty vector
Discussion
Recent studies have revealed that lncRNAs are closely related to the malignant progression of PC. For instance, lncRNA GSTM3TV2 enhanced gemcitabine resistance by reducing let-7 and increasing LAT2 and OLR1 in PC cells [16]. LINC00958 silencing blocked PC cell invasion and EMT progression by sponging miR-330-5p and reducing PAX8 [17]. Furthermore, lncRNA EPIC1 silencing reduced cell growth ability, and facilitated cell apoptosis and G1/S cell cycle arrest of PC cells [18]. We set out to look into the function of LINC00847 in the tumor progression of PC. Previous research has shown that LINC00847 contributes to the development of various malignancies. In lung cancer, LINC00847 was upregulated and facilitated cell progression by modulating miR-147a and IFITM1 [9]. We discovered that PC cells and tissues have significant levels of LINC00847 expression. In particular, LINC00847 silencing reduced PC proliferation, invasiveness, as well as migration, and it also inhibited PC cell growth in vivo. These findings suggested that LINC00847 contributes to PC carcinogenesis.
LncRNAs have been confirmed to be a significant player in cancer progression by acting like sponges to absorb miRNAs. LINC00847 acted as an oncogenic factor in laryngeal squamous cell carcinoma by blocking miR-181a-5p and increasing ZEB2 expression [19]. In our study, we discovered that LINC00847 directly targeted miR-455-3p. It has been demonstrated that MiR-455-3p has varying impacts on the development of various malignancies. For instance, miR-455-3p expression was elevated in oral squamous cell carcinoma, and overexpression of miR-455-3p prevented the anticancer effects of LINC00472 [13]. In contrast, miR-455-3p prevented the progression of prostate cancer cells in vitro and in vivo [20]. Additionally, Zhan et al. reported that miR-455-3p mimic restrained cell multiplication of PANC1 as well as MIAPaCa2 cells [20]. Reduction of miR-455-3p accelerated cell invasion of SW1990 cells and PANC1 cells [21]. Similar to this, our findings indicated that miR-455-3p prevented Capan-1 cells and PSN-1 cells from proliferating and invading other cells. Our research as a whole demonstrated that miR-455-3p was a tumor-suppressing component in PC.
HDAC4, a key member of class IIa HDACs, is located in human chromosome 2q37.3 and expressed differently in different tissues and organs [22]. HDAC4 was verified to be a target of miR-455-3p. HDAC4 knockdown clearly suppressed cell proliferation of lung cancer cells [23]. Furthermore, HDAC4 acted as a tumor promoter in human multiple myeloma cells [24]. HDACs may be involved in the development of PC, where high expression of HDAC4 was borderline correlated with tumor growth and absent lymph node metastasis, and unrelated to organ metastasis [25]. Overexpression of HDAC4 was found in primary and metastatic pancreatic ductal adenocarcinoma [26]. We noted that HDAC4 was enhanced in PC tissues and cell lines, which is consistent with prior research. LINC00847 knockdown had an inhibitory impact on PC cells that was mechanically reduced by HDAC4.
The small number of patients is a limitation of this study. In future studies, we will increase the number of patients to validate the action of the LINC00847/miR-455-3p /HDAC4 axis in PC. More investigation is required to ascertain the mechanism by which miR-455-3p controls HDAC4 to promote PC cell growth.
In conclusion, this study confirms that LINC00847 is a tumor promoter in PC progression by sponging miR-455-3p to regulate HDAC4. Our findings provide a robust theoretical basis for potential therapeutic interventions targeting PC, highlighting the pivotal role of the LINC00847/miR-455-3p/HDAC4 axis in the pathogenesis of this condition.


