Introduction
According to available statistics, within 3 years of the start of the COVID-19 pandemic, more than 690 million people were infected, of whom 6.8 million died [1]. In addition, besides COVID-19 disease itself, subsequent complications have become a significant health problem that persists in a substantial percentage of people. Currently, the definition of complications after COVID-19 has not yet been fully systematised, but the World Health Organization (WHO) defines this disease as a post-COVID condition (also known as long COVID), which includes “the continuation or development of new symptoms 3 months after the initial SARS-CoV-2 infection, with these symptoms lasting for at least 2 months with no other explanation” [2]. Meanwhile, NICE (the National Institute for Health and Care Excellence) defines long COVID as persistent symptoms in the period from 4 weeks after recovering from COVID-19, wherein symptoms lasting more than 12 weeks are defined as post-COVID syndrome [3].
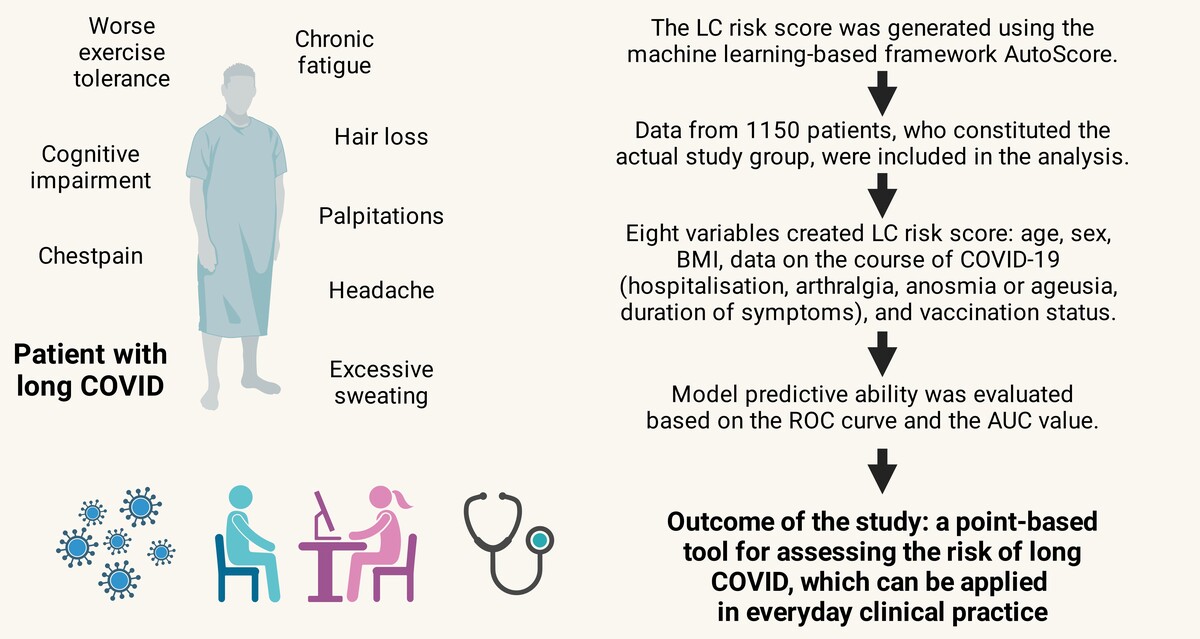
Long COVID is a very diverse disease entity that can include up to 60 different clinical symptoms, among which fatigue, neurocognitive disorders, smell and taste disorders, or persistent cough and shortness of breath are dominant [4]. Assessment of the disease prevalence remains difficult, but global data show that it can affect up to 70% of people following COVID-19. A meta-analysis of 735,006 patients showed a prevalence of 45% with a mean follow-up time of 126 days, with headache being the most common clinical manifestation in both hospitalised and home-treated patients [5]. The Polish data also confirm the phenomenon’s local spread at a high level [6]. Potential risk factors for developing complications after COVID-19 include age, female sex, severe course of COVID-19, and coexistence of comorbidities [6–9].
Analyses regarding the vaccination’s impact on the risk of developing complications after COVID-19 are still inconsistent; however, most researchers emphasise their highly protective effect [7, 10]. The mechanism of the disease is also not fully understood. Still, it is believed that the potential cause of its development may be organ dysfunction and tissue damage due to an excessive immune and pro-inflammatory response during COVID-19. Another hypothesis posits that COVID-19 may persist in a subclinical form for up to 3 months after infection, which may lead to long-term immune stimulation. The alternative view also includes the possibility of reactivating “latent” pathogens, e.g., EBV, HSV [11].
Long COVID and the huge burden on the health care sector have many socio-economic consequences since it causes absenteeism at work, limits professional and social activities, and reduces the quality of people’s lives [12]. According to recent calculations, the cost of long COVID may amount to as much as $3.7 trillion [13]. Due to the huge impact on health and economic consequences, long COVID should be considered not only in a particular context but more globally.
Risk prediction models are commonly used to predict the risk of a medical event. Risk prediction models are mathematical equations that allow one to assess the probability of an event based on patient data. Tools based on the above models are commonly used in clinical settings, including the Framingham Risk Score, Ottawa Ankle Rules and Euro-SCORE [14]. One such model is AutoScore, which is based on machine learning. This method has also been used many times to develop specific tools that were characterized by high sensitivity, including a scale to develop an assessment of the risk of acute kidney injury, pre-hospital return of spontaneous circulation (P-ROSC) in patients with out-of-hospital cardiac arrest, or a tool for the selection of patients presenting to the emergency department (Hospital Emergency Department) [15–17].
Therefore, the necessity of early identification of risk factors, planning the appropriate effective treatment, and reducing the risk of long-term complications seem to be critically important measures. However, there are no dedicated tools for assessing the LC risk using basic patient data. Therefore, the aim of the present study was to develop a simple, practical tool to assess the likelihood of developing long COVID. To the best of the authors’ knowledge, no similar tool has been available.
Material and methods
The analysed group
The study group includes patients from the STOP COVID registry, a Polish patient registry monitoring people’s health after COVID-19 (STOP COVID registry/the PoLoCOV study – ClinicalTrials.gov identifier — NCT05018052). Detailed information on the registry was published previously [6]. Briefly, the patients had follow-up visits 3 months after the end of SARS-CoV-2 infection. The criteria for inclusion in the registry included: (1) age over 18 years; (2) confirmed COVID-19 diagnosis (PCR or antigen test, depending on legal regulations); written consent to participate in the study. During the first visit, basic sociodemographic information was collected. In addition, the data were supplemented with existing comorbidities: arterial hypertension, diabetes, heart failure, coronary artery disease lipid disorders, asthma, and chronic obstructive pulmonary disease (COPD). Subsequently, a questionnaire was completed regarding the symptoms occurring during the SARS-CoV-2 infection. After introducing COVID-19 vaccination, information on vaccination status was additionally collected. Data on the place of isolation (home, hospitalisation) were noted. Every patient was weighed and measured, and based on these data, the body mass index (BMI) was calculated. Based on BMI values, patients were divided into four groups: underweight < 18.4 kg/m2, healthy weight 18.5–24.9 kg/m2, overweight 25–29.9 kg/m2 and obese ≥ 30 kg/m2 [18]. As a part of follow-up visits, patients completed a health questionnaire regarding persistent symptoms in the 3rd month after COVID-19 recovery. The most common symptoms classified as the long COVID syndrome were assessed in connection with the questionnaire, including fatigue, cough, shortness of breath, olfactory and taste disorders, headaches, arthralgia, and impaired exercise tolerance. The presence of at least one of them qualified the patient for the diagnosis of long COVID according to the WHO definition [2]. A person was considered vaccinated if they had received at least the basic vaccination regimen, i.e., 2 doses of Comirnaty (Pfizer/BioNTech), 2 doses of Spikevax (Moderna), 2 doses of Vaxzevria (AstraZeneca), or 1 dose of Johnson & Johnson.
This study was conducted following the Declaration of Helsinki, and the approval of the Bioethics Committee of Wroclaw Medical University was obtained.
Distinguishing the study group
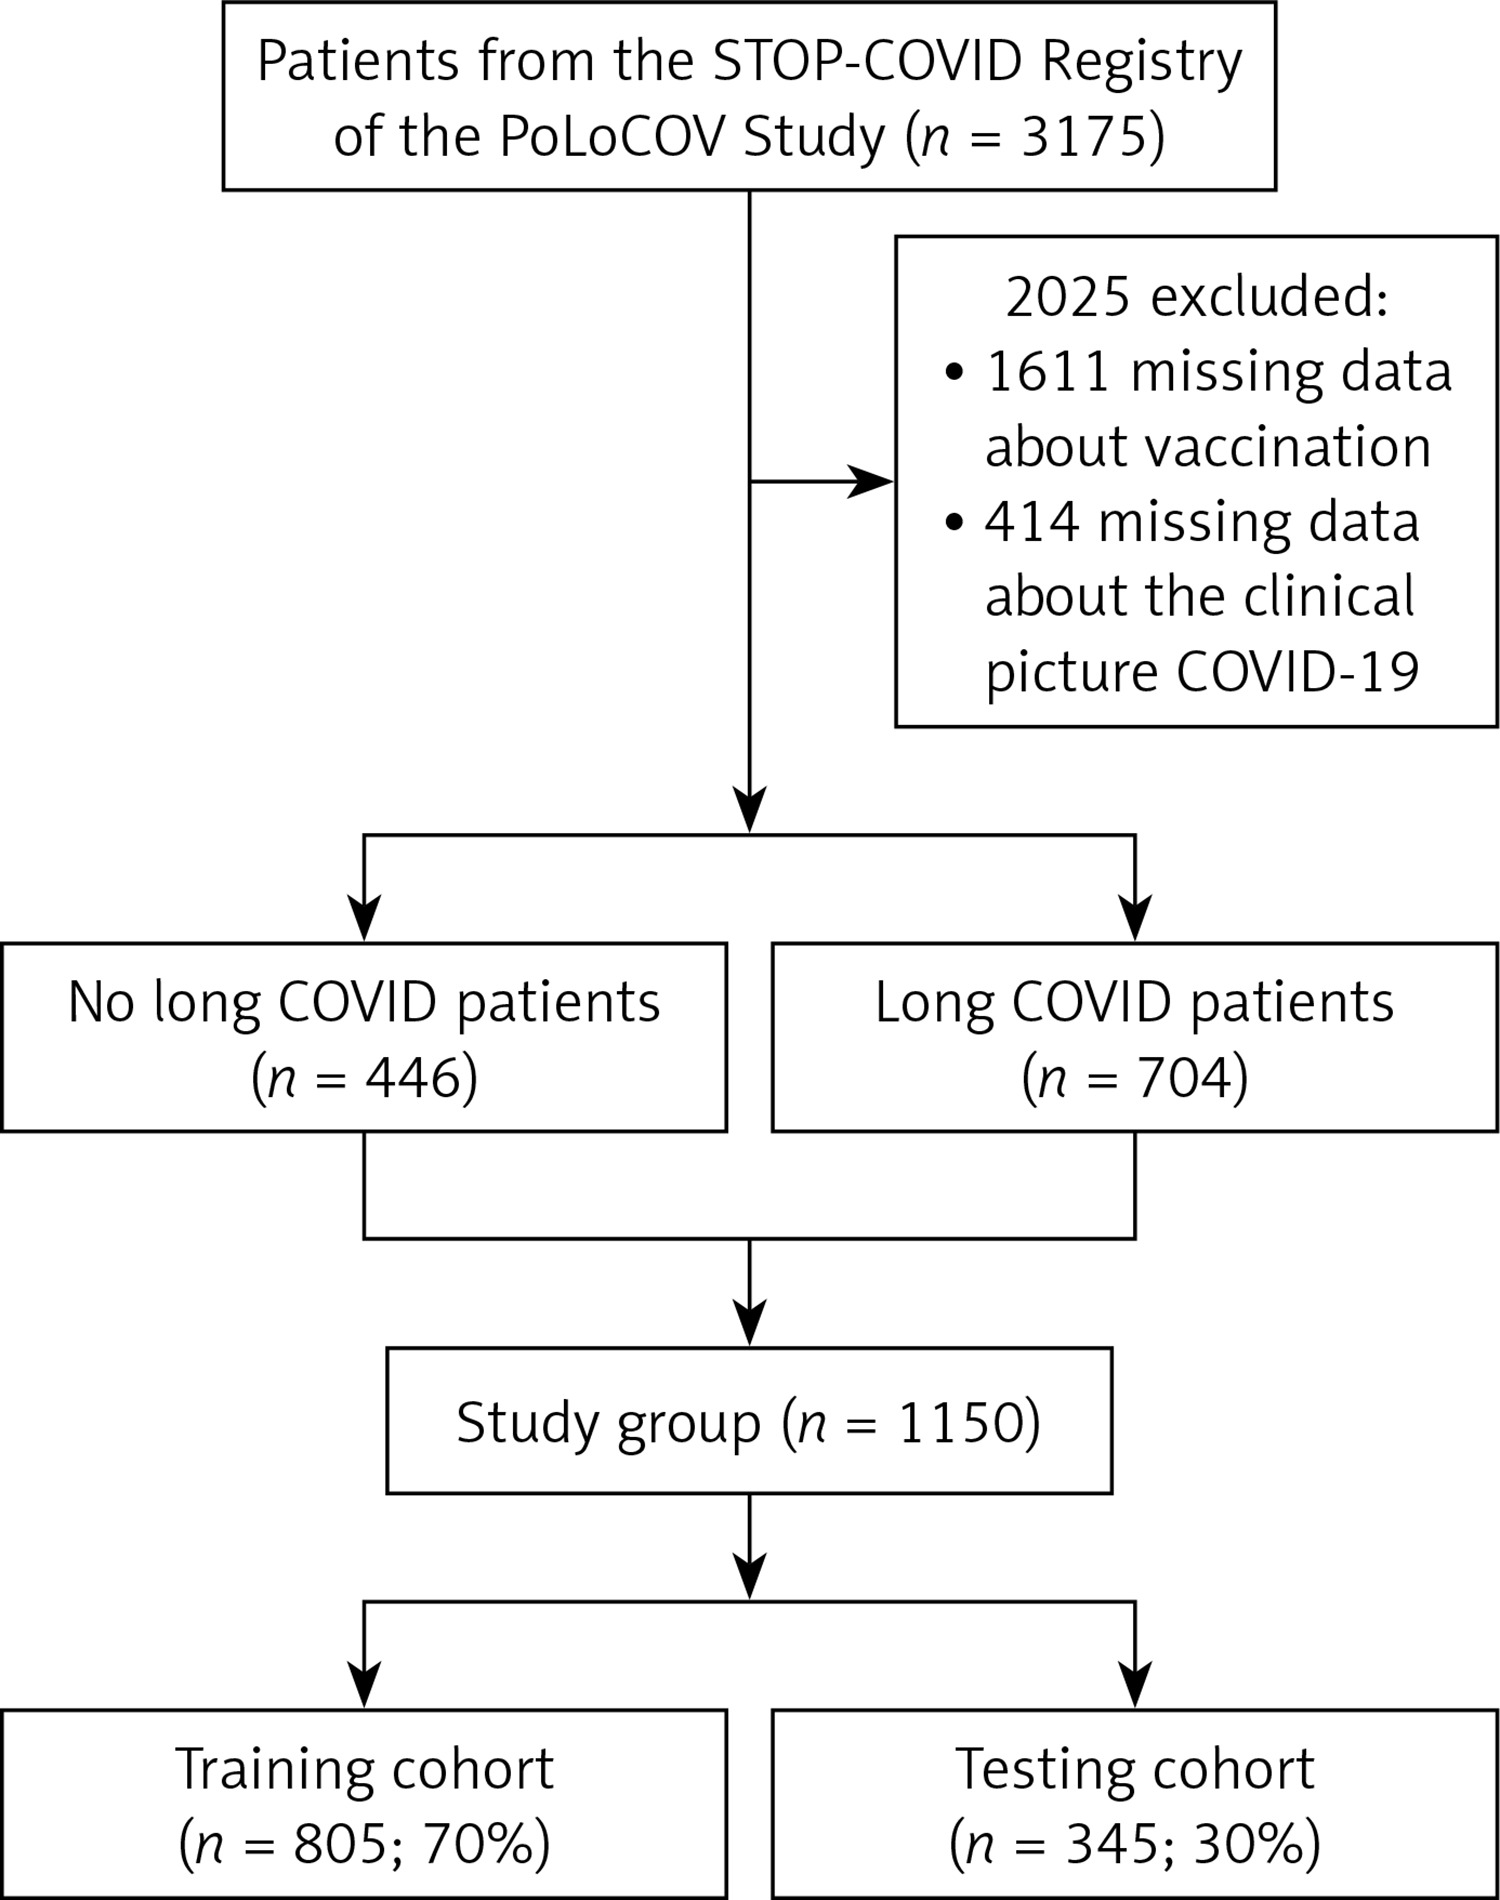
The analysed registry included data collected from 3,175 patients, of whom 1,611 were excluded due to the lack of data on vaccination status. Subsequently, 414 records were rejected due to missing data. Finally, data from 1,150 patients, who constituted the actual study group, were included in the analysis. Then, the study group was divided into patients meeting the long COVID criteria (n = 704) and those not meeting them (n = 446) (Figure 1).
Statistical analysis and development of a risk score
Continuous variables were expressed using descriptive statistics: mean and standard deviation (SD) or median and 25th and 75th percentiles (25–75%). Categorical (qualitative) variables were defined as absolute (n) and relative (%) frequencies. Differences between the two groups were compared using the Wilcoxon rank sum test for continuous variables. Comparison of categorical variables between groups was performed using Pearson’s χ2 test and Fisher’s exact test.
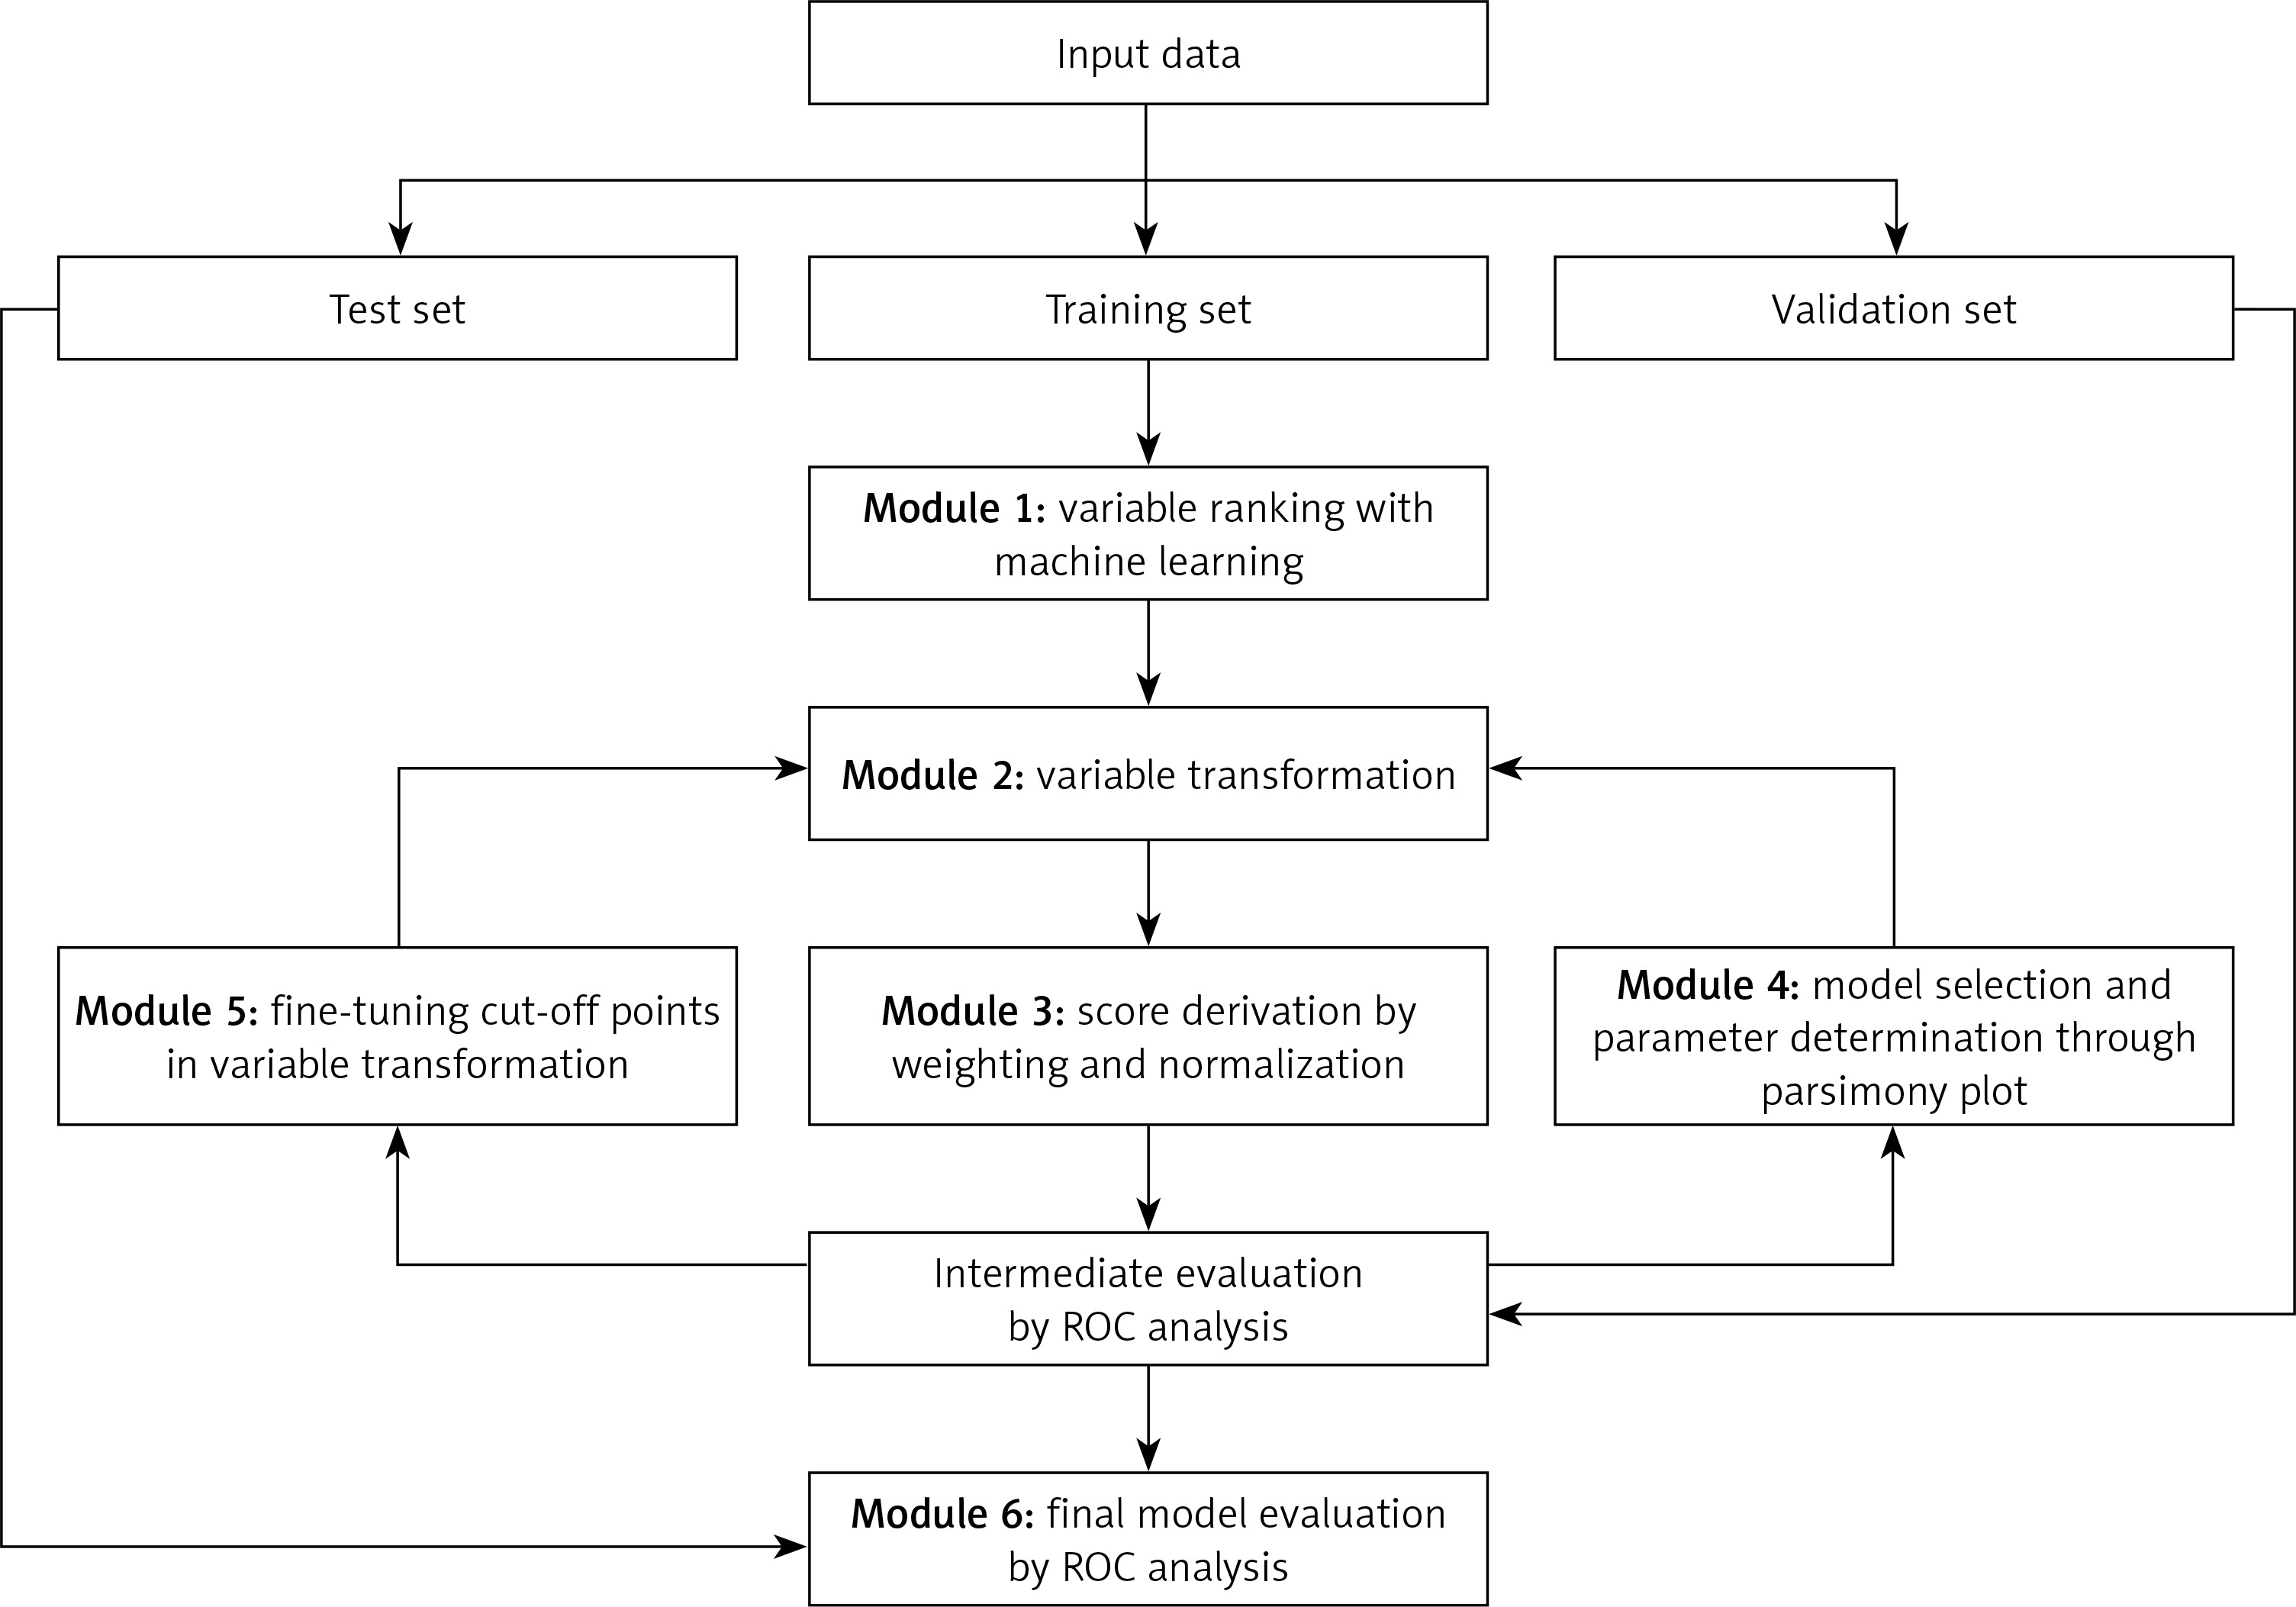
The AutoScore framework was employed to develop the LC risk score [19]. This tool enables the automatic development of a clinically useful scoring model. AutoScore consists of six modules: 1) variable ranking with machine learning, 2) variable transformation, 3) score derivation, 4) model selection, 5) domain knowledge-based score fine-tuning, and 6) performance evaluation. To create the long COVID score, 17 objective variables were selected regarding sociodemographic data, anthropometric measurements, and symptoms during the disease (acute SARS-CoV-2 infection). The final variables incorporated in the risk score were selected according to the results obtained from the above analysis and juxtaposed with the literature review regarding long COVID and the clinical experience of the researchers, as suggested by the authors of the machine learning-based tool [20].
Patients’ data were first randomised into training (70% of output) and test (30% of output) cohorts. Due to the small study group, cross-validation was used. The training cohort was utilised to generate preliminary risk score models. Cross-validation was employed (module 4) to evaluate intermediate performance with the subsequent selection of analysis parameters (e.g., number of variables, cut-off values for categorising continuous variables). Also, using cross-validation a parsimony plot was generated (i.e., model performance vs complexity), which helped select variables for the final risk score model. The test cohort was used to generate the metric of the final model performance (module 6). The predictive ability of the LC risk score was assessed using the ROC (receiver operating characteristic) curve and the AUC (area under curve) value. In addition, for various cut-off points (the value from which the occurrence of long COVID was predicted), sensitivity, specificity, positive predictive value (PPV), and negative predictive value (NPV) were calculated for the developed LC risk score (Figure 2).
Figure 2
Flowchart of the AutoScore Framework. This figure was originally published in JMIR Medical Informatics (http://medinform.jmir.org) under a CC-BY license (no permission required) [14]
Statistical analyses and development of the risk score were performed based on the R language in RStudio, an integrated development environment (software version R 4.11) [21]. In all analyses, results with p < 0.05 were considered statistically significant.
LC risk score calculation
After ordering the variables according to how they predict the occurrence of long COVID, a parsimony plot was created to visualise the selection of the variables for the model. The variables shown in Figure 3 have been ranked by significance in LC prediction. BMI was found to be the most significant variable, and respiratory diseases were the least important.
Figure 3
Parsimony plot showing the model performance (AUC) against model complexity (number of variables) during model selection in the LC risk score development (n = 1150)
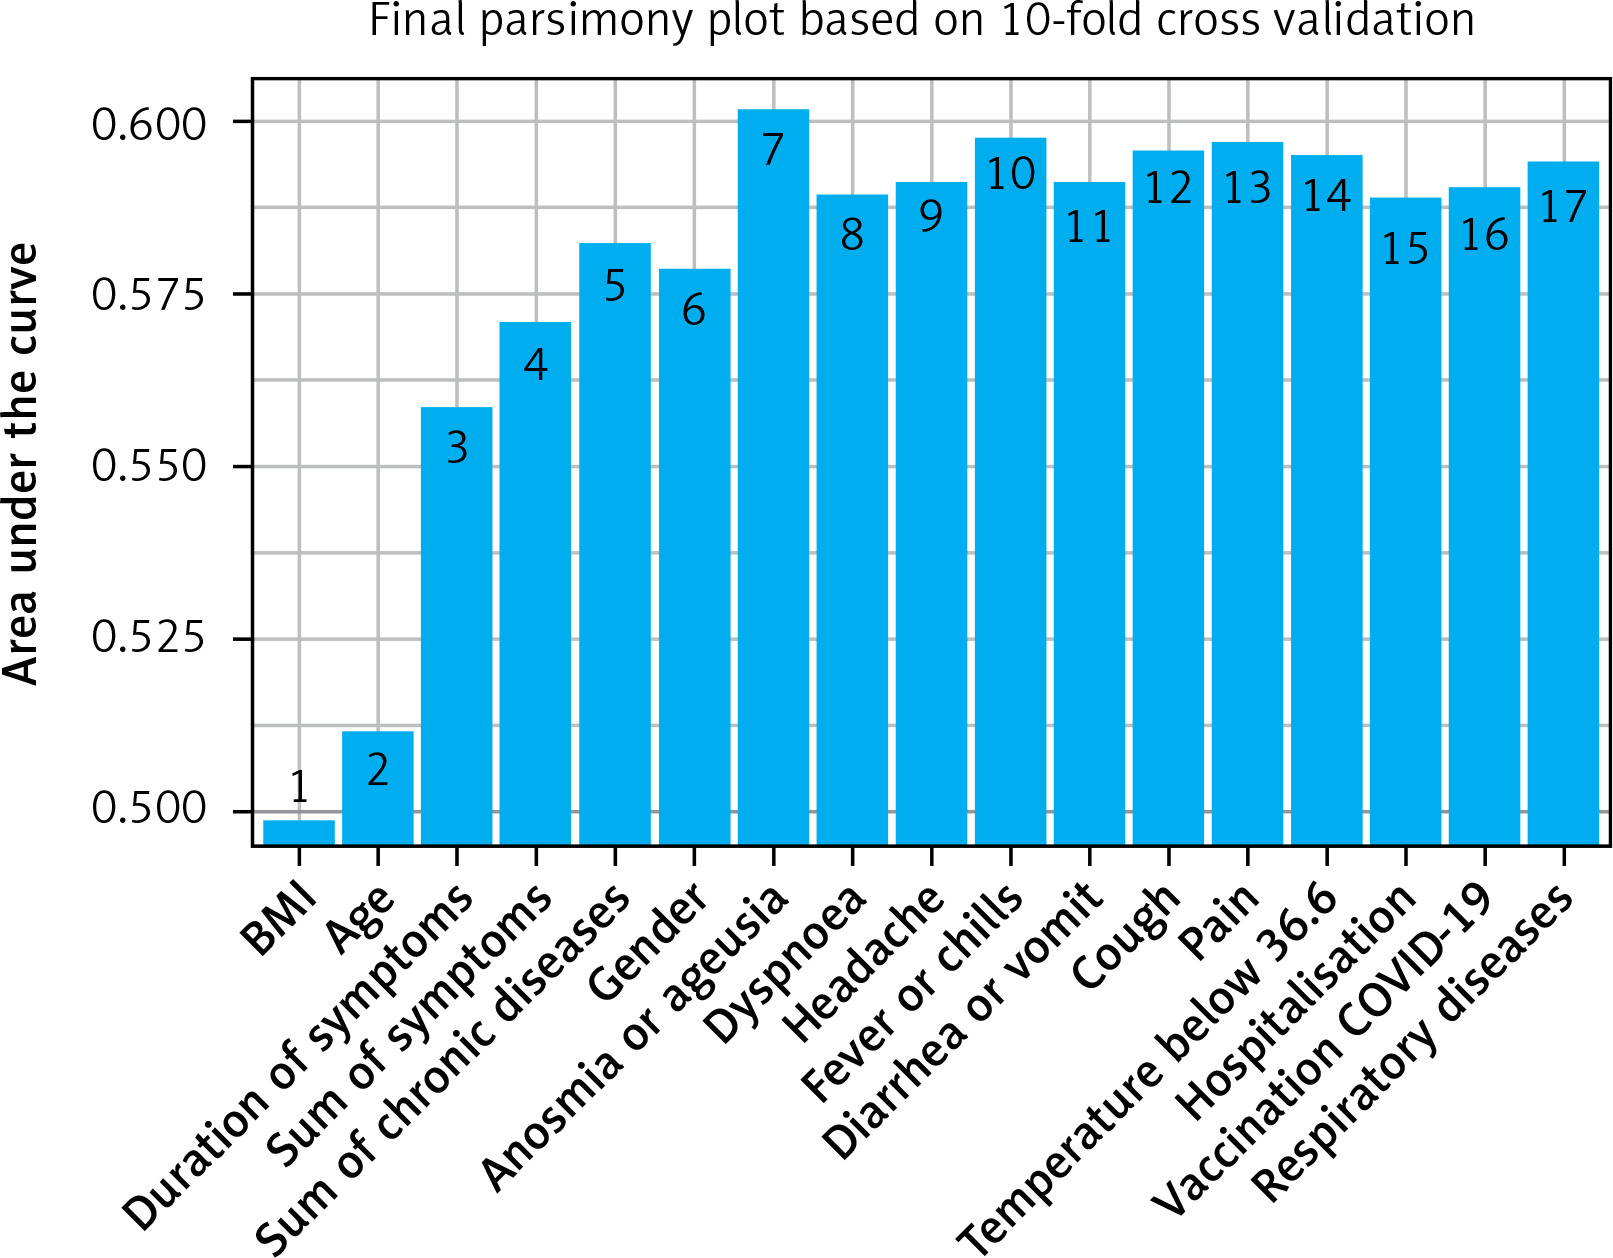
To create the LC risk score, 8 variables were ultimately selected due to their significance (Figure 3) and clinical value:
Results
Characteristics of the study group
Finally, 1,150 patients were enrolled in this study. The average age was 53 ±13 years. The vast majority of included patients were women (65%). Of the group analysed, 1,069 were ill before the period of Omicron variant dominance. A comparison of patients during and before the period of Omicron variant dominance is shown in Supplementary Table SI, which is part of the supplementary materials. Hypertension (37%) and hyperlipidaemia (21%) were the most common comorbidities. Considering the location during the isolation, 88% of patients were treated at home. There were no differences in the distribution of age, BMI, and most chronic diseases between patients with and without long COVID. Respiratory diseases were more common among patients with persistent symptoms after 3 months (p = 0.003). A detailed summary of the study group divided into patients with and without LC is presented in Table I.
Table I
Clinical characteristics – differences between groups with and without long COVID
| Parameter | Whole group N = 1150a | No long COVID n = 446a | Long COVID n = 704a | P-valueb |
|---|---|---|---|---|
| Age | 53 (13) | 53.07 (13.96) | 52.37 (12.68) | 0.36 |
| Female | 751/1,150 (65%) | 264/446 (59%) | 487/704 (69%) | < 0.001 |
| BMI [kg/m2] | 27.7 (5.30) | 27.66 (5.31) | 27.75 (5.35) | 0.29 |
| Underweight | 7/1,150 (0.6%) | 1/446 (0.3%) | 6/704 (0.9%) | > 0.90 |
| Healthy weight | 358/1,150 (31%) | 146/446 (33%) | 212/704 (30%) | > 0.90 |
| Overweight | 436/1,150 (38%) | 174/446 (39%) | 262/704 (37%) | > 0.90 |
| Obesity | 349/1,150 (30%) | 125/446 (28%) | 224/704 (32%) | > 0.90 |
| Comorbidities | ||||
| Hypertension | 429/1,150 (37%) | 168/446 (38%) | 261/704 (37%) | 0.84 |
| Diabetes | 94/1,150 (8%) | 36/446 (8%) | 58/704 (8%) | 0.92 |
| Coronary artery disease | 55/1,150 (5%) | 23/446 (5%) | 32/704 (4%) | 0.64 |
| Myocardial infarction | 21/1,150 (2%) | 12/446 (3%) | 9/704 (1%) | 0.08 |
| Heart failure | 6/1,150 (0.5%) | 3/446 (0.7%) | 3/704 (0.4%) | 0.68 |
| Hyperlipidaemia | 244/1,150 (21%) | 95/446 (21%) | 149/704 (21%) | 0.96 |
| Respiratory diseases | 128/1,150 (11%) | 34/446 (8%) | 94/704 (13%) | 0.003 |
| Vaccination against COVID-19 | 1,001/1,150 (87%) | 398/446 (89%) | 603/704 (86%) | 0.08 |
| Place of Isolation: | ||||
| Home isolation | 1,009/1,150 (88%) | 400/446 (90%) | 609/704 (87%) | 0.11 |
| Hospitalisation | 141/1,150 (12%) | 46/446 (10%) | 95/704 (13%) | 0.12 |
| Symptoms during COVID-19: | ||||
| Temperature < 36.6°C | 170/1,150 (15%) | 74/446 (17%) | 96/704 (14%) | 0.17 |
| Fever or chills | 804/1,150 (70%) | 290/446 (65%) | 514/704 (73%) | 0.004 |
| Cough | 802/1,150 (70%) | 317/446 (71%) | 485/704 (69%) | 0.43 |
| Dyspnoea | 575/1,150 (50%) | 186/446 (42%) | 389/704 (55%) | < 0.001 |
| Isolated anosmia | 121/1,150 (11%) | 54/446 (12%) | 67/704 (9.5%) | 0.16 |
| Isolated ageusia | 73/1,150 (6%) | 24/446 (5%) | 49/704 (7%) | 0.28 |
| Anosmia or ageusia | 489/1,150 (43%) | 153/446 (34%) | 336/704 (48%) | < 0.001 |
| Impaired hearing | 121/1,150 (11%) | 47/446 (11%) | 74/704 (11%) | 0.99 |
| Significant fatigue | 887/1,150 (77%) | 313/446 (70%) | 574/704 (82%) | < 0.001 |
| Chest pain | 530/1,150 (46%) | 159/446 (36%) | 371/704 (53%) | < 0.001 |
| Arthralgia | 838/1,150 (73%) | 302/446 (68%) | 536/704 (76%) | 0.002 |
| Headache | 714/1,150 (62%) | 257/446 (58%) | 457/704 (65%) | 0.01 |
| Diarrhoea or vomiting | 297/1,150 (26%) | 96/446 (22%) | 201/704 (29%) | 0.008 |
| BP elevation or dysregulation of previously well-controlled BP | 178/1,150 (15%) | 67/446 (15%) | 111/704 (16%) | 0.73 |
| Duration of symptoms [days] | 10 [7–14] | 10 [6–14] | 11 [7–15.] | < 0.001 |
| Sum of symptoms | 8 [6–11] | 8 [5–1] | 9 [7–11] | < 0.001 |
Clinical picture of COVID-19
In the analysed group, the most common clinical symptom of COVID-19 was chronic fatigue, which occurred in 77% of patients. Subsequently, 73% of patients also complained of arthralgia, and 70% had a cough, fever, or chills. The median duration of clinical symptoms was 10 days. 141 (12%) patients required hospitalization in the course of COVID-19, 7 of them in the ICU. A detailed summary of the clinical picture of COVID-19 in the analysed group of patients is presented in Table I.
Long COVID
In the analysed study group 704 (61.2%) patients met the long COVID criteria. The most common complaints reported by patients included deterioration of exercise tolerance (75%), chronic fatigue (74%), and cognitive impairment (56%). In addition, Figure 4 graphically shows the number of patients manifesting a certain number of symptoms. The exact list of long COVID symptoms in the study group is presented in Table II.
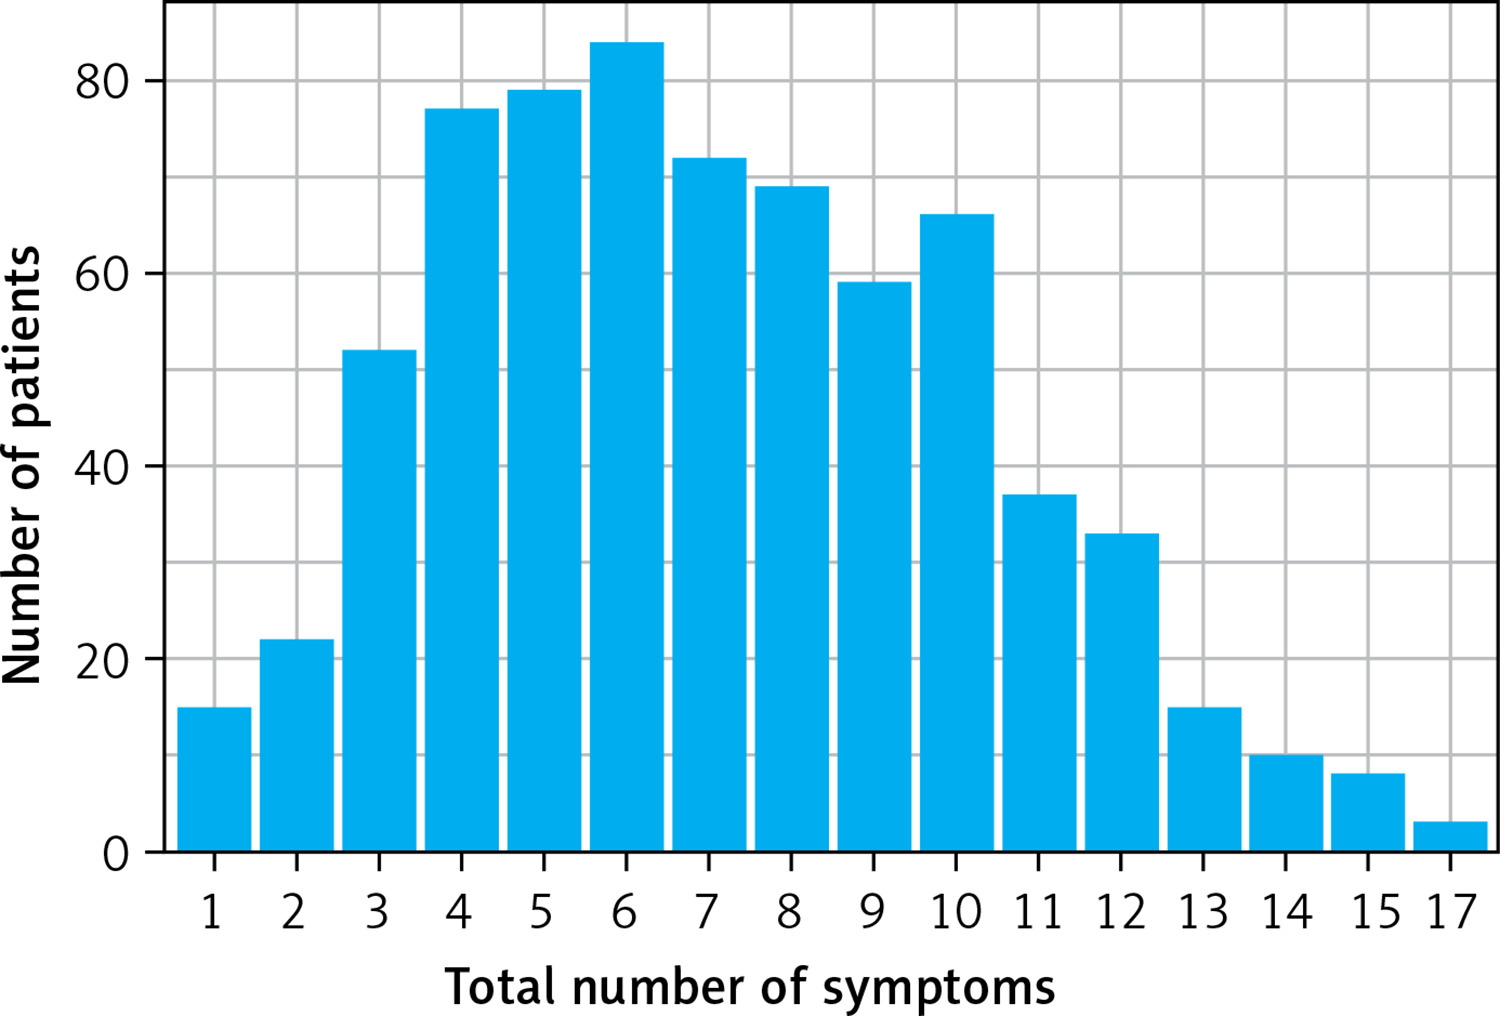
Table II
Clinical picture of patients with long COVID (n = 704a)
LC risk score
For selected variables in the model, the AutoScore tool generated a scoring table, in which each variable was assigned a specific point value (Table III). Thus, the result of the risk score for a given patient was the total value of points assigned to selected variables. Higher final risk score values (= higher risk of long COVID occurrence) were associated with female gender, age range 40–49, BMI < 18.5 kg/m2, hospitalisation during COVID-19, arthralgia, loss of taste and smell during infection, COVID-19 symptoms lasting at least 14 days, and lack of vaccination.
Table III
Scoring table for AutoScore-generated long COVID risk score
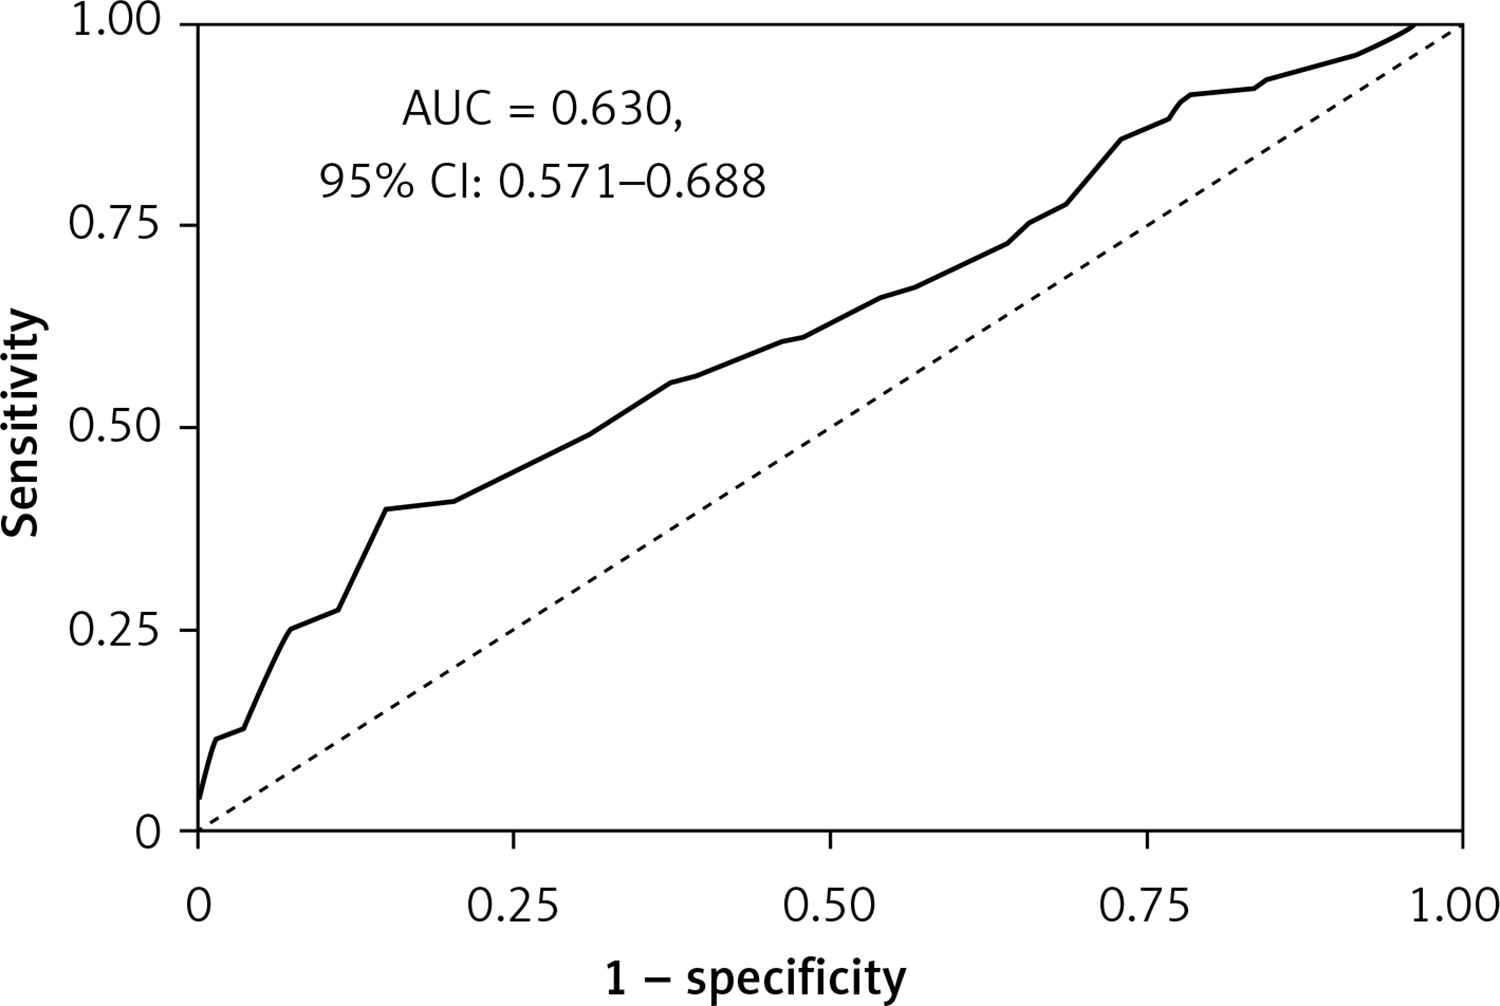
The optimal cut-off point for the developed prediction model, according to AutoScore, was the value of 58 for sensitivity 39.80%, specificity 85.1%, PPV 80.8%, and NPV 47.3%. The comparison with other cut-off points is presented in Table IV.
Table IV
Score cut-off points of predicted LC risk based on the long COVID risk score, including the percentage of patients within the score threshold, sensitivity, specificity, positive predictive value, and negative predictive value
The final predictive value of the developed the LC risk score for a cut-off of 58 points was AUC = 0.630 (95% CI: 0.571–0.688) on the test dataset (Figure 5).
Discussion
Although 4 years have passed since the outbreak of the pandemic, the complications of COVID-19 are still not fully explained. Their mechanism of their development is unknown, but we have learned more about the risk factors. Nevertheless, there are currently no simple tools for assessing the risk of long COVID. The development of such a utility seems justified due to the variety of symptoms and the huge prevalence of the problem, which can affect hundreds of millions of people worldwide [5]. Our study was performed using the database of the Polish STOP-COVID registry, which collects patients after COVID-19, treated at home, or hospitalised due to COVID-19. Furthermore, the AutoScore platform was utilised to develop a proprietary point score to assess the likelihood of LC among convalescents after COVID-19. The AutoScore framework, combining machine learning and regression modelling, automatically generates straightforward scoring models to implement and verify in clinical practice [19]. Scoring has the advantage of being easy to apply and therefore widely exploited and validated in various healthcare settings. The superiority of this tool is the unsophisticated interpretation of the results, which can support clinical decision-making; thus, physicians can easily classify patients into the appropriate risk category. Scoring models generated by AutoScore are comparable to other standard methods (i.e., logistic regression, stepwise regression, Least Absolute Shrinkage and Selection Operator (LASSO) model, Random Forest Regression (RF) model) regarding predictive performance and model calibration.
The proposed tool has also several advantages in creating risk prediction models. First, machine learning-based variable classification or selection can effectively filter out redundant information. Second, the variable transformation module improves the fitting of the model. Thirdly, employing a parsimony plot (model performance vs. complexity) facilitates determining the optimal number of variables for the model [20]. Furthermore, this tool has already been applied to develop risk scores for acute kidney injury, pre-hospital return of spontaneous circulation (P-ROSC) in patients with out-of-hospital cardiac arrest, or a triage tool for patients presenting to the ED (Hospital Emergency Department) and showed profitable efficiency [15–17].
The score includes the 8 most significant variables that can be effortlessly collected from the patient during the medical interview. The addition of successive variables was associated with only a slight increase in model performance, but on the other hand, it contributed to its complexity. Moreover, to the authors’ knowledge, it is one of the few tools evaluating the long COVID forecasts, and the first allowing one to assess the LC risk based on the general patient’s information. One of the available tools is PCAS-SCORE; however, it requires several variables and laboratory test results, such as total, non-specific immunoglobulin M (IgM) and immunoglobulin G3 (IgG3), which are not commonly determined among patients [22]. The complexity of this model severely limits its widespread use. Therefore, the development of the LC prediction model can be beneficial due to facilitating the diagnostic and therapeutic process of a patient whose symptoms may indicate complications after COVID-19. That can significantly translate into early detection of patients at the highest risk of long COVID, therapy optimisation, and reduced risk of distant complications. Secondly, it is estimated that obstacles after COVID-19 can be a huge budgetary burden for many countries; thus, prompt diagnosis and appropriate treatment improve people’s health, return to work, and fulfil their social roles. In addition, the implementation of an undemanding tool will contribute to improving the quality of healthcare provided. It may increase patients’ trust in the physician, which has changed during the COVID-19 pandemic [23]. Finally, it may make it possible to introduce the coordinated comprehensive care of the patients at the highest LC risk to significantly reduce the diseases burden and its complications, with significant reduction of healthcare costs for the payer [24].
Variables that show the highest predictive value in the prevalence of long COVID-19, show clinical relevance, and are easy and straightforward for the physician to acquire were used to build the scale.
Among sociodemographic variables, female gender and age are predictors of the development of long COVID. This is consistent with a number of observations that unequivocally indicate that female gender is associated with a higher risk of developing long COVID syndrome. This is supported by data both from Poland and from numerous meta-analyses [6, 25,26]. For example, a meta-analysis conducted by Vasiliki Tsampasian et al. involving 727,630 patients clearly indicated that female gender is associated with a high risk of developing long COVID syndrome [25]. One theory for the higher incidence of long COVID syndrome in women is a stronger immune response during the acute phase of COVID-19. It is also thought that hormones may have an effect on the long-term persistence of inflammation that can lead to the development of long COVID [27]. Thus, it is reasonable to select the above variable for the presented tool.
Another parameter analysed in the scale is BMI, where values both above and below normal are associated with a higher risk of developing long COVID. In analysing the impact of BMI on the risk of developing long COVID, most studies focus on the impact of overweight and obesity, which undoubtedly increase the risk of developing long COVID [25]. In contrast, underweight patients, whom studies clearly show to also be at risk for severe COVID-19 or lung damage, are often overlooked [28].
The effect of COVID-19 vaccination on the risk of developing long COVID was unclear for a long time. Now, more and more data are emerging to clearly show that COVID-19 vaccination not only reduces COVID-19 mortality, but also reduces the risk of developing long COVID – which translates into extra points on the scale for those who have not been vaccinated [29, 30].
Another parameter analysed in the RC score is hospitalization, which de facto reflects the severity of the course of COVID-19. In the LC score, any patient who has been hospitalized for COVID-19 scores additional points, indicating an increased risk of developing long COVID. This is supported by international data, which indicate that a history of hospitalization for COVID-19 increases the risk of complications and long COVID syndrome [25].
Finally, among clinical symptoms during the acute phase of COVID-19, arthralgia and olfactory and taste abnormalities proved to be the most significant. Joint and muscle pain is one of the most common symptoms of long COVID. What is more, this symptom is also one of the most common complaints during the acute phase of COVID-19 [31]. These symptoms fall into one of the four major subphenotypes of long COVID and can occur in up to 92% of patients suffering from long COVID. There are several theories to explain the persistence of pain including direct cellular damage by SARS-CoV-2, microvascular damage and ongoing inflammation [31, 32].
Converging epidemiological observations have been made for olfactory/taste disorders, which can occur in up to 23% of patients and are considered one of the main neuropsychiatric symptoms of long COVID syndrome and during COVID-19. Here, too, it is thought that a direct attack on the central nervous system by the virus may be the causative factor. In addition, studies also suggest that inflammation, hypoxia and micro-strokes in the brain may occur during SARS-CoV-2 infection, which contribute to the development of neuropsychiatric symptoms [25, 33,34]. These mechanisms suggest that the presence of the above symptoms may have a significant impact on the long-term sequelae of the infection, including the risk of developing long COVID.
Nevertheless, over the years there have been numerous scientific publications that have pointed to a wide variety of risk factors for the development of long COVID, which have ranged from sociodemographic variables to clinical status, vaccination status or symptoms during the acute phase of SARS-CoV-2. This wide variation may be due to a number of factors including the lack of a standardized definition of long COVID syndrome, different patient cohorts, or the lack of dedicated tools to assess the incidence of complications of COVID-19 [35–38]. It should also be mentioned that the symptoms assessed, such as fatigue and memory deterioration, among others, were often assessed subjectively by patients. This shows how much work still needs to be done to better understand the mechanisms of this syndrome so that risk factors can be assessed unequivocally.
The authors are undoubtedly aware of the limitations of this study, which included a relatively small group of patients in the final analysis. However, to the best of the authors’ knowledge, there is no practical, easy-to-apply LC risk score available to compare with. In addition, the group analysed is not representative of other latitudes due to geographical constraints. Therefore, validating the tool based on prospective and retrospective data from other parts of the world is necessary to exclude geographical specificity. Apart from prospective validation, the opinion of the medical practitioners regarding the usefulness of the tool remains equally important. Nevertheless, we hope that the simplicity and accessibility of the analysed parameters in the proposed utility make it an effective diagnostic tool for physicians who encounter complications after COVID-19 in their daily practice. In addition, the study’s methodological limitations include limiting the patient’s health assessment to only certain chronic conditions, which do not exhaust the full list of diseases that increase the risk of developing long COVID. Another limitation of the study is the lack of evaluation of the antiviral treatment used during the acute phase of COVID-19, which can have a major impact on the risk of developing long COVID [39].
In conclusion, we have developed a simple, point-based tool for assessing the risk of long COVID, which can be applied in everyday clinical practice. Thanks to the use of basic clinical and sociodemographic data and a small number of analysed variables, the tool has a chance to become widely used as part of everyday clinical practice. Another advantage is the short time needed to obtain the necessary data, and therefore the speed of their execution. Early assessment of the risk of developing long COVID will allow us to quickly develop diagnostic and therapeutic procedures. Moreover, early knowledge about the risk of developing the disease will allow us to prepare the patient for the possibility that such complications may occur. However, further tool validation is needed to exclude geographical specificity, especially concerning international data. Therefore, the authors plan to continue working on the tool and validate it based on international medical data.
ClinicalTrials.gov: NCT05018052