Introduction
China has the highest stroke burden in the world, and stroke is the leading cause of death and disability in Chinese adults [1, 2]. Although the age-standardized incidence and mortality of stroke in China decreased by 9.3% and 39.8%, respectively, from 1990 to 2019, the prevalence increased by 13.2% during the same period [3, 4]. In addition, China is the largest developing country, and it faces major problems due to its aging population [5]. In this context, stroke prevention and treatment remain challenging tasks.
Socioeconomic status (SES) is considered to be a determinant of health [6], income level and educational attainment, as the most commonly used indicators of SES [7] represent different aspects of SES, and thus they may affect health through different causal mechanisms [8]. Studies have shown that income continues to have an independent effect on health controlling for indicators of SES such as educational attainment [9]. Increasing attention has been paid to income in studies on stroke and SES. A case-control study of patients with acute first stroke in 32 countries showed that inadequate detection and treatment in low-income countries contributes to an increased risk of stroke [10]. A cohort study of 605,03 patients suggested that social inequalities, as expressed by income level, are evident in long-term post-stroke mortality rates [11]. Currently, however, there is little examination of the association between income and stroke prevention. Income is clearly associated with health-related access to material resources [7], whereas higher educational attainment may provide higher income by obtaining better occupations in the labor market. Educational attainment influences income to a large extent [7], and the effect of income may be confounded with the educational attainment indicator, so we examined the association between income as an independent consideration and stroke prevention after adjusting for the education indicator.
Therefore, we believe that there may be a correlation between high income and stroke prevention. Primary prevention and secondary prevention constitute two stages in disease prevention [12]. Primary prevention involves measures taken against the causes of a disease, such as stroke, before it occurs and represents the fundamental approach to preventing, controlling, and eliminating diseases. Strengthening research on the causes of stroke and reducing exposure to risk factors are fundamental to achieving primary prevention of stroke. Secondary prevention, on the other hand, encompasses measures taken during the latent phase of a disease, such as stroke, to prevent or slow down its progression [12]. Thus, we sought to determine whether income level has different effects on primary and secondary stroke prevention. To the best of our knowledge, this question has not previously been addressed.
Therefore, in this study, we aimed to assess differences in the effects of income level on the primary and secondary prevention of stroke using data from the China Kadoorie Biobank (CKB) survey.
Material and methods
Study population
This was a population-based study using data from a CKB survey that began in 2004 in 10 geographical regions of China (five urban and five rural). A detailed description of the CKB design, procedures, and study participants has previously been published [13]. Briefly, the baseline survey was conducted from 2004 to 2008 and completed by trained staff at local research assessment centers. Five urban (Qingdao, Harbin, Haikou, Suzhou, and Liuzhou) and five rural (Sichuan, Gansu, Henan, Zhejiang, and Hunan) regions were selected based on a combination of local disease patterns, known risk factors, population stability, the quality of mortality and disease registries, and local commitment and capacity. Approximately 150 administrative units (rural or urban residential communities) were selected in each region, and 512,715 community residents aged 30–79 years were recruited. Data were collected using an interview-administered questionnaire that included basic demographic information, SES, medical history, and long-term lifestyle behaviors. Blood pressure, height, and weight measurements were also recorded.
Sociodemographic data
From the interview-administered questionnaire, we obtained background information, including age, home address (urban or rural, northern or southern), educational level (primary school, lower or middle school, high school, college or above), health insurance status (insured, uninsured), marital status (married, other), and history of disease (hypertension, diabetes mellitus, family history of stroke); lifestyle behaviors, including alcohol consumption (never, former, current weekly, current daily), diet (daily vegetable consumption, daily fruit consumption, red meat consumption 1–6 days per week), and physical activity level in metabolic equivalents (MET; hours/day); medication use, including antiplatelet (yes or no), antihypertensive (yes or no), antihyperglycemic (yes or no), or lipid-lowering (yes or no) agents; and body measurements, including weight, height, and blood pressure (BP). Physical activity data were stratified by population quartile and by sex (quartile 1 [Q1]: MET [male] < 10.67, MET [female] < 9.6; Q2: 10.67 ≤ MET [male] < 16.8, 9.6 ≤ MET [female] < 18.72; Q3: 16.8 ≤ MET [male] < 28.21, 18.72 ≤ MET [female] < 32.45; Q4: MET [male] ≥ 28.21, MET [female] ≥ 32.45).
The main research variable was the household income level. Participants with stroke (secondary prevention category) and those with a high risk of stroke (primary prevention category) were divided into the following three income groups: low income (< 10,000 yuan), middle income (10,000–19,999 yuan), and high income (≥ 20,000 yuan). The high-income group included the top 29.7% of stroke participants by income level, the low-income group included the bottom 37.2% of stroke participants by income level, and the middle-income group included the remaining participants.
Measurement methods
Height, weight, and BP measurements were taken and recorded consistently at the local study centers by trained healthcare workers [14]. Body mass index (BMI) was calculated as the weight (kg) divided by the square of the height (m). A normal BMI was defined as < 23.9 kg/m2, overweight was defined as a BMI of 24 to 27.9 kg/m2, and obesity was defined as BMI ≥ 25 kg/m2 [15, 16]. Normal BP was defined as systolic blood pressure (SBP) < 120 mm Hg or diastolic blood pressure (DBP) < 80 mm Hg without medication, normal–high BP was defined as a SBP of 120–139 mm Hg or a DBP of 80–89 mm Hg, and high BP was defined as SBP ≥ 140 mm Hg or DBP ≥ 90 mm Hg [17].
Definition of outcomes
The outcomes of our study were primary and secondary prevention in the target populations, i.e., those with a high risk of stroke and those with stroke, respectively. This was achieved by including 512,715 participants at baseline, for whom stroke was determined by self-reporting a doctor’s diagnosis. A high risk of stroke was identified using the model developed in the Prediction for ASCVD Risk in China study [14]. Participants were classified as having a high risk of stroke when their predicted 10-year risk of cardiovascular disease (CVD) was not less than 5%. The remaining participants were classified as having a low risk of stroke, a population with a low risk of morbidity and a greater need for zero-level prevention targeting population-based interventions and social collaboration. The final numbers of people included in this study were 8,884 with stroke and 218,972 with a high risk of stroke.
Statistical analysis
Continuous variables such as age, income, and BMI were converted to categorical variables. Categorical variables are expressed as frequencies and percentages. To describe the baseline characteristics of this population and assess risk factors and medication use, participants were divided into the stroke group and the high stroke risk group. Participants within each group were then divided into three groups according to income level, and their respective profiles were counted separately. The differences between groups were analyzed using a χ2 test.
To compare stroke prevention between the two groups at different income levels, we identified six cardiovascular risk factors (smoking, alcohol consumption, physical activity, diet, BMI, and BP) and four types of medication (antiplatelet, antihypertensive, antihyperglycemic, and lipid-lowering agents). Currently not smoking, currently not consuming alcohol (never or occasionally), physical activity in the upper quartile of the population, a healthy diet (daily fresh vegetable and fruit consumption, red meat consumption 1–6 days per week), BMI of 18.5 to 24 kg/m2, and SBP < 120 mm Hg or DBP < 80 mm Hg without medication were used to define a low cardiovascular risk status. Differences in risk status and medication use for six cardiovascular risk factors across income levels in the two groups were assessed using unconditional logistic regression analysis, with the low-income group as the reference group and adjustments for baseline characteristics, including age (continuous), sex (male or female), type of residence (rural or urban), region (northern or southern), educational level (primary school, lower or middle school, high school, or college or above), health insurance status (insured or uninsured), history of diabetes (yes or no) and hypertension (yes or no), and family history of stroke (yes or no). The final results are reported as adjusted odds ratios (ORs) with 95% confidence intervals (95% CIs).
A p-value < 0.05 was considered statistically significant. All analyses were performed using R software (version 3.5.1; R Foundation for Statistical Computing, Vienna, Austria).
Results
Table I shows the demographic characteristics of the study population according to stroke prevention status category. In the stroke group, the proportion of participants ≥ 60 years old increased from the low-income (59.5%) to the high-income group (61.8%), whereas in the high stroke risk group, the proportion of participants ≥ 60 years old decreased from the low-income (26.9%) to the high-income group (21.1%). Compared to participants with a low income in the high stroke risk and stroke groups, those with a high income were more likely to be from an urban area; be married; have a higher educational level; have medical insurance; and have self-reported hypertension, diabetes, and a family history of stroke. In the high stroke risk group, participants with a high income were more likely to be from the southern than the northern area, whereas in the stroke group, participants with a high income were more likely to be from the northern area.
Table I
Baseline characteristics of participants with and without established stroke by income level
Table II shows the six CVD risk factors and medication use by income level in both the high stroke risk and stroke groups. In both groups, income level was positively associated with the proportion of participants who currently consumed alcohol (daily or weekly), and had a healthy diet, but was inversely associated with the proportion of participants who were current smokers. There was an inverse relationship between income level and the incidence of hypertension in the stroke group and a positive relationship between income level and the incidence of hypertension in the high stroke risk group (all ptrend < 0.05). BMI was not significantly associated with income level in either group.
Table II
CVD factors and medical use in participants with high stroke risk and established stroke by income level
In both groups, income level was positively associated with the proportion of participants who used antihyperglycemic drugs (ptrend < 0.001). The use of antihypertensive drugs showed a positive relationship with income level in the high stroke risk group (p < 0.001), but showed no significant relationship with income level in the stroke group. However, the use of lipid-lowering drugs showed an inverse relationship with income level in the stroke group (p < 0.05), but no significant relationship in the high stroke risk group. The use of antiplatelet agents was not significantly associated with income level in either group.
Table III shows the ORs and 95% CIs for the association between the control of primary and secondary prevention risk factors and medication use by income level. In the high stroke risk group, participants with a higher income level, especially high-income participants, were less likely than others to be current smokers (OR = 1.28; 95% CI: 1.24–1.33, reference: low-income group), have a level of physical activity higher than the population quartile (OR = 1.17; 95% CI: 1.14–1.20), and have a healthier diet (OR = 1.62; 95% CI: 1.52–1.71; Figure 1). However, middle- and high-income participants were less likely to control their alcohol consumption and BP than low-income participants. This was especially true for middle-income participants (OR = 0.82; 95% CI: 0.78–0.85 for alcohol consumption; OR = 0.82; 95% CI: 0.76–0.81 for BP; all p < 0.001; Figure 2). Antiplatelet medication use was significantly more likely to be used by middle- and high-income participants than low-income participants (p = 0.017). This was especially true for middle-income participants (OR = 1.17; 95% CI: 1.04–1.30). There was no significant association between middle-income participants and medication for hypertension; however, high-income participants were less likely to use it (OR = 0.90; 95% CI: 0.84–0.96, p < 0.001). BMI and the use of antihyperglycemic or lipid-lowering drugs were not significantly associated with income level.
Table III
Adjusted odds ratios and 95% confidence interval in stroke primary and secondary prevention according to income level*
* Adjusted odds ratios (OR, 95% CI) of low-income group vs. middle-income group, high-income group to evaluate the association between income level and the achievement of individuals risk factor control targets, and individual medication use (antiplatelet drug, BP-lowering drug, anti-hyperglycemia drug, lipid-lowering drug). Low-income group as the reference group. Age, gender (male, female), urbanity (urban, rural), region (northern, southern), education level (primary school or lower, middle school, high school, college or above), health insurance status (insured, uninsured), and history of disease (hypertension, diabetes mellitus, family history of stroke) were included in the adjustment.
Figure 1
Adjusted odds ratios and 95% confidence interval in stroke primary risk factor control according to income level
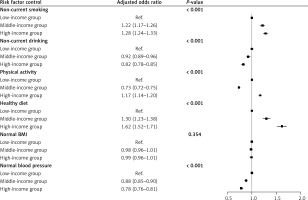
Figure 2
Adjusted odds ratios and 95% confidence interval in stroke primary medication use according to income level
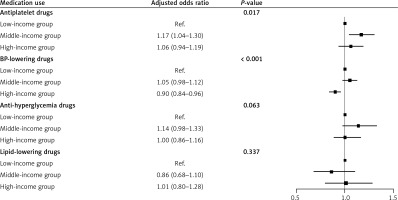
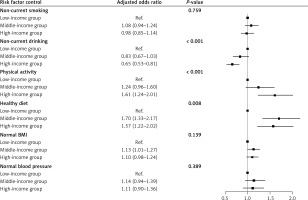
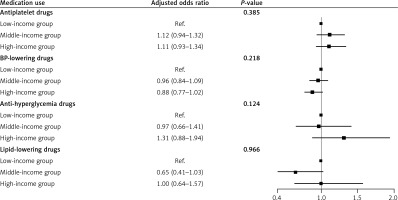
In the stroke group, middle- and high-income participants were more likely than low-income participants to engage in physical activity at a level higher than the population quartile (OR = 1.24; 95% CI: 0.96–1.60 for middle-income participants; OR = 1.61; 95% CI: 1.24–2.01 for high-income participants) and to have a healthier diet (OR = 1.70; 95% CI: 1.33–2.17 for middle-income participants; OR = 1.57; 95% CI: 1.22–2.02 for high-income participants (Figure 3). However, middle- and high-income participants had less control of their alcohol consumption than low-income participants (OR = 0.83; 95% CI: 0.67–1.03 for middle-income participants; OR = 0.65; 95% CI: 0.53–0.81 for high-income participants). In contrast, smoking, BMI, BP, and the use of all four drugs were not significantly associated with income level in the stroke group (Figure 4).
Discussion
To the best our knowledge, this is the first study to examine differences in the effects of income level on primary and secondary stroke prevention in a Chinese population. Compared to low-income participants, high-income participants were more likely to have a healthy diet and a physical activity level higher than the population quartile. In addition, we observed a significant difference in the effect of income level on primary and secondary prevention. In the primary prevention population, individuals with middle to high incomes were more likely to control smoking and use antiplatelet agents, but differences in the use of antidiabetic and lipid-lowering medications were not significant. In addition, people in the middle-income group were more likely to take blood pressure medications than those in the lower income group, while the opposite was true in the higher income group. Although participants with a moderate-to-high income were less likely than those with a low income to control their alcohol consumption for primary prevention, we observed the same relationship for secondary prevention (Table III). BMI and the use of antihyperglycemic or lipid-lowering drugs were not significantly associated with income level in either the primary or secondary prevention categories.
In both the primary and secondary prevention categories, in general, middle- and high-income participants were better able to maintain a healthy diet and engage in physical activity at a level higher than the population quartile than low-income participants. This is consistent with the findings of previous studies showing that higher indices of healthy eating are associated with higher dietary costs and higher SES [15] and that a smaller proportion of disposable income is spent on healthy eating in low-income households than in high-income households [16]. Further, an Australian study from 2007 to 2008 showed that adults in low-income households were less likely than adults in high-income households to meet the recommended physical activity guidelines [17], and a systematic review reported a positive association between the level of physical activity and SES in low-and-middle-income countries [16]. Economic and educational opportunities ultimately influence eating behaviors [18], and anthropological studies have shown that a low income is a major barrier to the adoption of a healthy diet [15], and that a healthy diet is a key strategy for preventing the development of stroke [19]. Studies have shown that, compared with lower-income individuals, those with a higher income have higher health awareness scores, tend to adopt healthier behaviors [20], have the financial basis to access better health services, maintain a healthier diet, and undergo more physical activity. However, in the primary prevention category in this study, middle-income participants were less likely than low-income participants to be physically active, which may be because most of the low-income participants were from rural areas (85.6% vs. 62.8%), where physical activity included the time they spent working in the fields. Meanwhile, in the secondary prevention group, participants with middle and high income were less likely to engage in high-level physical activity at work compared to those with lower incomes (middle-income groups: OR =1.24; high-income groups: OR = 1.61, p < 0.001). However, more research is needed to understand the relationships between income level, physical activity, and diet.
In the primary prevention population, individuals with middle to high incomes were more likely to control smoking and use antiplatelet agents. In addition, people in the middle-income group were more likely to take blood pressure medications than those in the lower-income group, while the opposite was true in the higher-income group. Smoking was found to be associated with an increased absolute risk of death for individuals in lower socioeconomic groups in a study of older adults in the United Kingdom [21], and a study of smoking during pregnancy and the postpartum period also showed a negative association between income level and smoking [22]. Antiplatelet medication is particularly critical for stroke prevention, and those with higher incomes are better able to pay for medications than those with lower incomes, whereas the use of antihypertensive medication was found to be less common among higher- than among lower-income groups in this study. This may be due to the fact that 45.6% of the 6,367 low-income participants were taking antihypertensive medications compared with 43.99% of the 13,345 high-income participants who reported a history of hypertension. A higher proportion of low-income participants than high-income participants were taking medications. Although BP-lowering medication is the most effective treatment for hypertension, the use of these medications cannot be stopped once it is started. However, the high-income group may have more alternative options to treat hypertension, such as physical activity and a healthy diet in addition to medication, which may be the reason for the low rate of hypertension medication use in this group. The mechanisms underlying the relationship between income level and BP control are unclear, and thus more research is needed.
In the primary and secondary prevention categories, middle- and high-income participants were more likely than low-income participants to regularly consume alcohol daily or weekly. Studies have suggested that alcohol consumption may be a risk factor for stroke [23], but other studies have shown that current alcohol consumption is associated with a reduced risk of myocardial infarction (hazard ratio: 0.76; 95% CI: 0.63–0.93) [24]. In a study of the relationship between alcohol consumption and income level, moderate alcohol consumption was found to be associated with a 10% increase in income compared with no alcohol consumption, when correcting for confounding factors [25]. It has also been reported that an appropriate level of alcohol consumption was associated with reduced risk of ischemic stroke [26]. Specific drinking patterns (< 5 days per week) were found to be associated with a reduced risk of stroke in the earlier period in another study of 152,469 middle-aged participants [27]. Also, in a study of alcohol use and SES in urban and rural regions of China, income level was found to be associated with the likelihood of current regular alcohol consumption [28]. Business interactions are more prevalent in the context of rapid economic development, and alcohol is commonly consumed during social and business activities [28]. Thus, middle- and upper-income participants would have greater exposure to alcohol than lower-income participants, which may have contributed to the finding that middle- and upper-income participants were less likely to control their alcohol consumption. However, the mechanisms underlying the association between alcohol consumption and stroke remain unclear, and more research is needed.
In addition, although we adjusted for urbanization as a factor in our study, there was an association between income and urbanization, and potential residual confounding factors stemming from urbanization may be a risk factor for stroke. Studies show that with the accelerated urbanization, people’s sedentary work style and lack of exercise have gradually increased the incidence of overweight/obesity. People living in cities are experiencing increasing work pressure and the psychological burden associated with work pressure, and long-term mental stress causes a series of problems such as insomnia and anxiety [29]. In a systematic review of studies, high psychological demands, low job control and job stress were associated with an increased risk of stroke in women and men, and reducing job stress helped to reduce the risk of stroke in the working population [30]. China is currently facing the world’s worst air pollution problem, and cities have the highest levels of air pollution, with one study reporting an association between air pollution and daily stroke mortality in eight Chinese cities [31]. These may be potential effects from cities, which deserve further study. Stroke prevention remains a long-standing strategy, and understanding the effect of income level is critical to understanding the causes of stroke prevention disparities. The present study found a significant effect of income level on risk factor control (e.g., smoking, alcohol consumption, physical activity, diet, BP) and medication use (antiplatelet and antihypertensive drugs) in the primary prevention category. However, only alcohol consumption, physical activity, and diet were associated with income level in the secondary prevention category. Health education may influence an individual’s beliefs and behaviors. For both primary and secondary prevention, long-term health education programs should be implemented, especially for primary prevention in low-income populations.
To the best of our knowledge, this is the first study to examine the association between income levels and stroke prevention disparities in a Chinese population. The findings of this study will be useful in informing stroke prevention strategies. This study included populations from 10 geographical regions of China, with a large sample size, detailed data records, a rigorous and standardized survey process, and reliable data sources and quality.
However, there were several shortcomings of our study. First, the diagnosis of stroke was based on a self-reported physician’s diagnosis, which may be subject to recall bias, and our population was selected based on local disease patterns, exposure to certain risk factors, population stability, quality of death and disease registers, and local commitment and capacity, with some limitations on extrapolation of our findings. Second, the classification of income level was based on the appropriate tertile classification for this study, whereas previous studies may have used different criteria for income level classification, and therefore our findings may lack comparability with those from other studies. Also, due to the huge socioeconomic development differences between cities and regions in China, using a unified income division standard may be inappropriate. For example, for economically developed cities and regions, 20,000 RMB does not represent a high income level, while for economically underdeveloped regions, 10,000 RMB may represent a middle income. In addition, due to the influence of age, young people and the elderly generally have lower income levels, and the income grouping criteria in this study may not reflect this well. Future research needs to consider regional differences and develop more reasonable income division standards. The third limitation of this study is the intergenerational differences in educational levels, which could potentially confound the impact of income. In China, older participants have historically had fewer opportunities for education. To account for this, we adjusted for educational levels in subsequent analyses. However, residual confounding factors may still exist. Future research should further explore the interactions among age, education level, income, and stroke prevention behaviors. In addition, because our data did not include specific stroke type, we did not know whether the stroke was an ischemic or hemorrhagic stroke, or a transient ischemic attack (TIA). Finally, this was a cross-sectional study, and therefore we were unable to verify the causal relationship between income level and stroke prevention activities.
In conclusion, our findings suggest that low-income individuals are less likely to control their smoking and diet and use preventive medications, whereas high-income individuals are less likely to control their alcohol consumption and BP and use medication for both primary and secondary prevention. In China, disparities in stroke prevention due to income level persist, and prevention outcomes remain suboptimal. Further evaluation of the current prevention measures is needed, and a long-term approach to health education for low-income populations needs to be implemented.


