Introduction
As a complication of pregnancy, pre-eclampsia (PE) is characterized by proteinuria and increased blood pressure [1]. In Western countries, the incidence of PE is about 5%, although the incidence of PE is much higher in developing countries [2]. Worldwide, PE is estimated to be responsible for over one hundred thousand maternal deaths every year and is considered as a key reason for premature delivery, i.e., children born with birth weight < 1500 g [1, 3, 4]. Moreover, PE has been shown to cause cardiovascular morbidity in pregnant women [5].
Initially isolated from the serum of pregnant women, pregnancy-associated plasma protein-A (PAPP-A) contains a unique metalloproteinase zinc-binding motif in its amino acid structure, although the role of this motif remains unclear. PAPP-A is increasingly used for the prenatal screening of trisomy 21, either alone or in combination with ultrasound measurement of nuchal translucency (NT) [6, 7], while recently, a study showed that PAPP-A is associated with proteolytic activity [8–11]. In fact, an abnormally low level of PAPP-A has been used as a biomarker to predict the tendency to have small-for-gestational-age (SGA) neonates [12]. Also, it was shown that the ultrasound examination of the uterine artery can provide useful information to predict the onset of PE even in the first trimester [13]. Currently, it is believed that an abnormally low level of PAPP-A plays a role as essential as that of abnormal ultrasound results in the prediction of SGA fetuses, although the role of a low level of PAPP-A in the prediction of PE remains controversial [12]. These discrepancies may be due to the different molecular mechanisms involved in the development of SGA and PE, such that an abnormal ultrasound result may indicate the invasion of trophoblasts in maternal spiral arteries [14], whereas a low value of PAPP-A may indicate that the placenta can no longer support the further growth of the fetus.
The expression of the transcriptome is regulated by a complex network involving the interaction among a wide range of molecules, including messenger RNA (mRNA), microRNA (miRNA), and long non-coding RNA (lncRNA) [15]. Among them, miRNA plays an essential role to maintain the stability of the transcriptome and to regulate the homeostasis in the body. Recently, the molecular interaction between lncRNA/miRNA and mRNAs has gained special interest because it has been revealed that both miRNAs, a type of small non-coding RNAs (ncRNAs) with a length of about 22 nucleotides, and lncRNAs, a type of ncRNAs with a length of over 200 nucleotides, are involved in the translation regulation of their target mRNAs [16, 17]. At the same time, mRNAs were also shown to regulate the expression of ncRNAs in a certain way [18, 19].
In a previous study, it was found that increased expression of urothelial cancer-associated 1 (UCA1) was positively associated with the increase in imatinib (IM) resistance [20]. Further investigation showed that UCA1 competitively binds to miR-16 and suppresses the function of miR-16. In another study, it was demonstrated that UCA1 functions as a competing endogenous RNA (ceRNA) of miR-16 [20]. In bladder cancer cells, UCA1 could also function as an endogenous sponge of miR-16 to regulate GLS2 expression and glutamine meolism [21].
It has been shown that PAPP-A could function as a biomarker in the diagnosis of PE [22]. Meanwhile, using an online miRNA daase, we found that miR-16 might act as a potential regulator of PAPP-A. Furthermore, UCA1 has been identified as a competing endogenous RNA (ceRNA) of miR-16 [21]. In this study, we studied the value of using UCA1 and miR-16 as biomarkers in the diagnosis of PE. In addition, we compared the diagnostic value of miR-16, UCA1 and PAPP-A in PE.
Material and methods
Human subjects and sample collection
In this study, PE patients (n = 128) and healthy pregnant women (n = 172) were enrolled in the case group and the control group, respectively. Subsequently, according to the type of PE, the case group was further divided into a MILD group (patients with mild PE, n = 88), a SEVERE group (patients with severe PE, n = 32) and a HELLP group (patients with HELLP pregnancies, a complication of pregnancy characterized by hemolysis, elevated liver enzymes, and a low platelet count, n = 8). Demographic and clinical characteristics of all subjects were collected and analyzed, and are presented in Table I. Moreover, peripheral blood samples and placenta samples were collected from all subjects for subsequent receiver operating characteristic (ROC) analyses. All patients signed the written informed consent before their participation in this study. In addition, this study was approved by the Ethics Committee of our institute and was carried out in accordance with the Helsinki Declaration.
Table I
Demographic and clinical characteristics of subjects without pre-eclampsia (PE) (n = 172), subjects with mild PE (n = 88), subjects with severe PE (n = 32) and subjects with HELLP pregnancies (n = 8)
RNA isolation and real-time PCR
A miRNeasy Mini Kit (Qiagen, Hilden, Germany) was used to extract the total RNA from tissue and cell samples. Isolated RNA was reversely transcribed into complementary DNA (cDNA) templates using a reverse transcription kit (Thermo Fisher Scientific, Waltham, MA). The expression of UCA1, miR-16, and PAPP-A mRNA was measured using quantitative real-time PCR and a SYBR Premix Ex Taq II reagent kit (Takara, Tokyo, Japan) following the instructions of the kit. The reaction system of quantitative real-time PCR contained a volume of 20 μl, including 10.0 μl of One Step SYBR RT-PCR Buffer III, 0.4 μl of TaKaRa Ex Taq HS, 0.4 μl of Prime Script RT Enzyme Mix II, 0.3 μl of PCR forward primer, 0.3 μl of PCR reverse primer, 0.4 μl of ROX Reference Dye (50×), 2 μl of total RNA, and 6.2 μl of RNase Free ddH2O. An ABI7500 quantitative PCR instrument (ABI, Foster City, CA) was used to carry out the quantitative real-time PCR. The reaction conditions were set as follows: pre-denaturation at 95°C for 10 s, followed by 40 cycles of denaturation at 95°C for 5 s and annealing at 60°C for 25 s, and a final extension step. U6 was used as the internal reference to quantify the relative expression of UCA1, miR-16, and PAPP-A mRNA using the 2–ΔΔCt method. Each experiment was repeated three times.
Cell culture and transfection
Trophoblast and Hela cells were acquired from ATCC (American Type Culture Collection, Manassas, VA) and maintained in an environment of saturated humidity at 37°C and under 5% CO2. DMEM (Gibco, Thermo Fisher Scientific, Waltham, MA) containing 10% fetal bovine serum, 100 unit/ml streptomycin, and 100 mg/ml penicillin was used as the culture medium. For transfection experiments, trophoblast and Hela cells were seeded into 96-well plates at a density of 104 cells per well and incubated overnight. On the next day, the cells were transfected with pcDNA-UCA1 and pcDNA-anti-miR-16 using Lipofectamine 2000 (Invitrogen, Carlsbad, CA) following the instructions of the manufacturer. The transfected cells were harvested at 48 h post-transfection for subsequent analyses. Each experiment was repeated three times.
Vector construction, mutagenesis, and luciferase assay
The putative target genes of miR-16 were determined using online bioinformatics tools. The results identified the presence of miR-16 binding sites in the 3’ UTR of PAPP-A mRNA and the promoter of UCA1. Subsequently, the 3’ UTR of PAPP-A mRNA and the promoter of UCA1 containing the miR-16 binding sites were amplified by PCR and cloned into pcDNA vectors (Promega, Madison, WI) to generate wild type vectors for the 3’ UTR of PAPP-A mRNA and the promoter of UCA1, respectively. At the same time, site-directed mutagenesis was also carried out at the miR-16 binding sites in the 3’ UTR of PAPP-A mRNA and the promoter of UCA1. Subsequently, the mutant sequences were also amplified by PCR and cloned into pcDNA vectors to generate mutant vectors for the 3’ UTR of PAPP-A mRNA and the promoter of UCA1. In the next step, trophoblasts and Hela cells were co-transfected with UCA1 and miR-16, or miR-16 and PAPP-A mRNA, using Lipofectamine 2000. At 48 h after transfection, the transfected cells were collected and the luciferase reporter activity in transfected cells was detected by a Dual Luciferase Reporter Assay System (Promega, Madison, WI). The Renilla internal control was used in the assay to normalize the relative firefly luciferase activity of UCA1 and PAPP-A mRNA. Each experiment was repeated three times.
Western blot analysis
Collected tissue and cell samples were lysed using a radioimmunoprecipitation assay (RIPA) buffer (Invitrogen, Thermo Fisher Scientific, Waltham, MA) supplemented with 1% sodium deoxycholate, 1% NP-40, 0.1% SDS, 150 mM NaCl and 50 mM Tris-HCl (pH 8.8). The lysis treatment was performed at 4 C for 30 min following the guidelines provided by the supplier. In the next step, the cell lysate was centrifuged at 4oC and 15,000 rpm for 10 min. Subsequently, the bicinchoninic acid method was used to measure the concentration of protein in the supernatant. Thereafter, 10% sodium dodecyl sulfate-polyacrylamide gel electrophoresis (SDS-PAGE) was used to separate the protein in each sample, and the separated proteins were then blotted onto a polyvinylidene difluoride (PVDF) membrane (Immobilon-P; Millipore, Billerica, MA) for 60 min at 180 mA using a transfer buffer containing 0.2 M glycine, 20% methanol, and 25 mM Tris (Promega, Madison, WI) following a standard protocol. Subsequently, the membrane was blocked in 5% skim milk (Merck, Darmstadt, Germany) and then incubated with anti-PAPP-A (1 : 1000 dilution, Abcam, Cambridge, MA) and anti-β-actin primary antibodies (1 : 10,000 dilution, Abcam, Cambridge, MA) overnight at 4°C, followed by another 60 min of incubation with horseradish peroxidase (HRP)-conjugated goat anti-rabbit immunoglobulin G secondary antibodies (1 : 10,000 dilution, Abcam, Cambridge, MA). In the next step, the chemiluminescent signals of bound antibodies were detected using an Electrochemiluminescence Plus Western Blotting Detection System (GE Healthcare Bio-Sciences, Pittsburgh, PA) in conjunction with a high-performance chemiluminescence film (GE Healthcare Bio-Sciences, Pittsburgh, PA) in accordance with the manufacturer’s recommendations. The relative expression of PAPP-A protein in each sample was normalized to the protein expression of the internal control β-actin. Each experiment was repeated three times.
Immunohistochemistry
Sample sections were dewaxed twice in xylene (10 min each time) and dehydrated in graded ethanol (100%, 95%, 80%; and 70%, 2 min each time). Subsequently, the sections were placed on a shaker and washed twice in distilled water (5 min each time). In the next step, the sections were incubated in 3% H2O2 for 10 min and washed by distilled water, followed by antigen repair at high pressure for 90 s. After being cooled down to room temperature, the sections were washed with phosphate buffer saline (PBS), blocked with 5% bovine serum albumin (BSA) for 30 min at 37oC, and then incubated overnight at 4oC with anti-PAPP-A primary antibodies (1 : 100, Abcam, Cambridge, MA). After PBS washing, the sections were further incubated with biotinylated secondary antibodies (1 : 100, Abcam, Cambridge, MA) at 37oC for 30 min. Subsequently, after being fully washed, the sections were incubated with horseradish peroxidase (HRP)-conjugated working fluid, stained with 3,3-diaminobenzidine (DAB, chromogenic agent), and counterstained for 5 min with hematoxylin. During this experiment, PBS was used as the negative control. After staining, the cells showing positive expression of PAPP-A protein were analyzed under a microscope. In brief, five fields of vision were chosen randomly from each section under a high power lens to detect the localization of positive PAPP-A expression. Each experiment was repeated three times.
ELISA
The level of PAPP-A protein expression in collected samples was measured using an ELISA kit (Thermo Fisher Scientific, Waltham, MA) following the instructions of the kit. Each experiment was repeated three times.
Statistical analysis
All statistical analysis was carried out using SPSS 19.0 software (IBM Corp.). All data are shown as mean ± standard deviation (SD). The differences between two different groups were compared using Student’s t-tests, while the differences between multiple groups were compared using one-way analysis of variance (ANOVA). The ROC curves were plotted using NCSS Statistical Software (NCSS, Kaysville, UT) to calculate the area under curve (AUC) values of different markers. At least three independent tests were performed for each experiment. A p-value of < 0.05 was considered statistically significant.
Results
UCA1 showed better value than miR-16 and PAPP-A in the diagnosis of PE
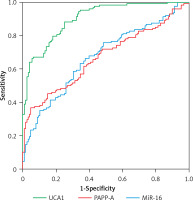
In this study, demographic and clinical characteristics of all subjects were collected and analyzed, as shown in Table I. There were no significant differences between different groups of PE patients as well as the case group with respect to the above indexes. Moreover, as shown in Figure 1, upon the calculation of the diagnostic values of UCA1, miR-16 and PAPP-A in the diagnosis of PE, the AUC of miR-16 and PAPP-A was very similar, while the AUC of UCA1 was evidently higher, suggesting that UCA1 can be used as a better marker in the diagnosis of PE.
UCA1/PAPP-A expression was inhibited in PE cases along with enhanced miR-16 expression
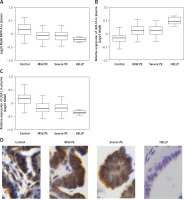
As shown in Figure 2 A, PAPP-A expression was similarly down-regulated in the MILD group and SEVERE group compared with that in the control group, which showed the highest PAPP-A expression. In contrast, the HELLP group showed the lowest PAPP-A expression. The relative expression of UCA1 in the plasma (Figure 2 C) showed the same trend as that of log10 MoM PAPP-A. However, the relative expression of miR-16 in the plasma (Figure 2 B) showed the opposite trend: The expression of miR-16 was the highest in the HELLP group and the lowest in the control group. Furthermore, the expression of PAPP-A (Figure 3 A), miR-16 (Figure 3 B) and UCA1 (Figure 3 C) in placenta samples collected from different groups also showed a similar trend as that in the peripheral blood samples. Finally, the trend in PAPP-A expression among different groups was also validated using IHC assays (Figure 3 D). Therefore, PE patients showed inhibited miR-16 expression and increased UCA1/PAPP-A expression, while the patients with HELLP pregnancies showed the lowest UCA1/PAPP-A expression and the highest miR-16 expression.
Figure 2
A – Log10 MoM pregnancy-associated plasma protein-A (PAPP-A) in the plasma of Mild PE, Severe PE, HELLP and control groups. B – Relative expression of miR-16 in the plasma of Mild PE, Severe PE, HELLP and control groups. C – Relative expression of urothelial cancer-associated 1 (UCA1) in the plasma of Mild PE, Severe PE, HELLP and control groups
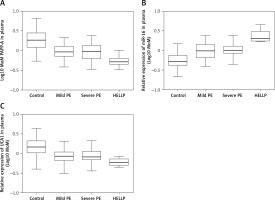
Figure 3
A – Log10 MoM pregnancy-associated plasma protein-A (PAPP-A) in the placenta samples of Mild PE, Severe PE, HELLP and control groups. B – Relative expression of miR-16 in the placenta samples of Mild PE, Severe PE, HELLP and control groups. C – Relative expression of urothelial cancer-associated 1 (UCA1) in the placenta samples of Mild PE, Severe PE, HELLP and control groups. D – Expression of PAPP-A protein in the placenta samples of Mild PE, Severe PE, HELLP and control groups were detected using the immunohistochemistry (IHC) assay
UCA1 and PAPP-A mRNA functioned as a sponge and a target of miR-16, respectively
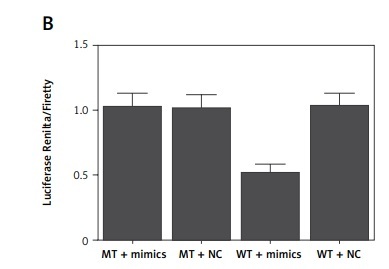
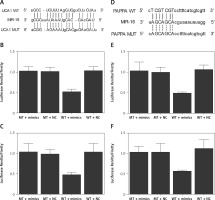
Based on a computational analysis carried out using an online target prediction tool (www.targetscan.org), a binding sequence of miR-16 was identified in UCA1 (Figure 4 A). Subsequently, a luciferase assay was performed to evaluate the interaction between miR-16 and UAC1, and the results demonstrated evidently reduced luciferase activity in trophoblast (Figure 4 B) and Hela (Figure 4 C) cells co-transfected with miR-16 and wild-type UCA1, suggesting that UCA1 acts as a sponge of miR-16. Additionally, a ‘seed sequence’ of miR-16 was identified in the 3’UTR of PAPP-A mRNA (Figure 4 D), and the luciferase activity of trophoblast (Figure 4 E) and Hela (Figure 4 F) cells was significantly reduced upon the co-transfection with miR-16 and wild-type PAPP-A 3’UTR, indicating that PAPP-A mRNA acts as a virtual target gene of miR-16.
Figure 4
A – Computational analysis on the sequences of miR-16 and urothelial cancer-associated 1 (UCA1). B – Luciferase assay of trophoblast cells co-transfected with wild-type/mutant UCA1 and miR-16/negative controls. C – Luciferase assay of Hela cells co-transfected with wild-type/mutant UCA1 and miR-16/negative controls. D – Computational analysis on the sequences of miR-16 and pregnancy-associated plasma protein-A (PAPP-A) mRNA. E – Luciferase assay of trophoblast cells co-transfected with wild-type/mutant PAPP-A mRNA and miR-16/negative controls. F – Luciferase assay of Hela cells co-transfected with wild-type/mutant PAPP-A mRNA and miR-16/negative controls
Establishment of the UCA1/miR-16/PAPP-A signaling pathway
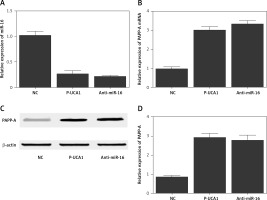
To further investigate the regulatory relationships among UCA1, miR-16, and PAPP-A, trophoblast cells were transfected with plasmids carrying UCA1 or anti-miR-16. As shown in Figure 5, the relative expression of miR-16 (Figure 5 A) was significantly suppressed in the presence of UCA1 or anti-miR-16, along with significantly increased expression of PAPP-A mRNA. Also, the results of Western blot analysis showed significantly increased expression of PAPP-A protein (Figure 5 C) in the UCA1 and anti-miR-16 groups, verifying the role of UCA1 as a negative regulator of miR-16 expression. Unlike miR-16, a positive relationship was confirmed between UCA1 and PAPP-A. Similar results were also obtained from Hela cells (Figure 6), thus establishing a UCA1/miR-16/PAPP-A signaling pathway. In summary, it can be concluded that when the expression of UCA1 is reduced, the expression of PAPP-A is accordingly suppressed, thus exhibiting positive effects in the pathogenesis of PE.
Figure 5
A – Relative expression of miR-16 in trophoblast cells transfected with negative controls, urothelial cancer-associated 1 (UCA1), or anti-miR-16. B – Relative expression of pregnancy-associated plasma protein-A (PAPP-A) mRNA in trophoblast cells transfected with negative controls, UCA1, or anti-miR-16. C – Relative expression of PAPP-A protein in trophoblast cells transfected with negative controls, UCA1, or anti-miR-16. D – Relative density of the PAPP-A protein band in trophoblast cells transfected with negative controls, UCA1, or anti-miR-16
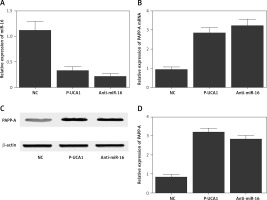
Figure 6
A – Relative expression of miR-16 in Hela cells transfected with negative controls, urothelial cancer-associated 1 (UCA1), or anti-miR-16. B – Relative expression of pregnancy-associated plasma protein-A (PAPP-A) mRNA in Hela cells transfected with negative controls, UCA1, or anti-miR-16. C – Relative expression of PAPP-A protein in Hela cells transfected with negative controls, UCA1, or anti-miR-16. D – Relative density of the PAPP-A protein band in Hela cells transfected with negative controls, UCA1, or anti-miR-16
Discussion
As a major contributor to neonatal and maternal mortality and morbidity, PE is known for its role as a trigger of maternal proteinuria, hypertension, imbalance of angiogenic factors, and placental dysfunction [23]. During PE, the decrease in uteroplacental perfusion may cause ischemia, which in turn promotes the release of soluble factors from the ischemic placenta and subsequently causes hypertension and endothelial dysfunction [24]. The physiological alterations observed in PE also promote the synthesis of proinflammatory cytokines, including IL-6 and tumor necrosis factor-α (TNF-α), from the placenta [25]. Recently, many studies have shown that the dysregulation in the production of placental growth factor (PIGF), vascular endothelial growth factor (VEGF), and soluble fms-like tyrosine kinase I (sFlt-1) plays an essential role in the pathology of PE [26, 27].
UCA1 was first discovered in human bladder carcinoma [20]. Previous studies have reported that UCA1 can promote the development of drug resistance, metastasis, and proliferation in many types of cancer cells, including the cells of breast cancer and bladder cancer [28–30]. UCA1 was recently found to function as a miRNA sponge. For example, UCA1 can activate mTOR to regulate the expression of hexokinase 2 (HK2) and glycolysis by activating STAT3 and by inhibiting the expression of miR-143 [31]. UCA1 also increases the invasion and migration ability of epithelial ovarian cancer cells by directly binding to miR-485-5p [32]. In this study, the AUC of miR-16 and PAPP-A was evidently lower than that of UCA1, suggesting that UCA1 is associated with better value in the diagnosis of PE.
In both plasma and placenta samples collected from the subjects of this study, the expression of PAPP-A and UCA1 was similarly down-regulated in the MILD and SEVERE groups, while the patients in the HELLP group showed the lowest expression of PAPP-A and UCA1. Meanwhile, the relative expression of miR-16 was the highest in the HELLP group and the lowest in the control group, verifying the role of UCA1, miR-16 and PAPP-A dysregulation in the pathogenesis of PE, especially in the pathogenesis of HELLP pregnancies.
In addition, it was found that miR-16 acts as a tumor suppressor by regulating the apoptosis and proliferation of many types of cancer cells, such as bladder cancer cells [33]. It was postulated that UCA1 can bind to miR-16 to impair its functions in bladder cancer. Past results also indicated that UCA1 exerts a dose-dependent sponge effect on miR-16. Additionally, it was found using luciferase assays that miR-16 can directly bind to the 3’UTR of GLS2 mRNA, suggesting that UCA1 acts as a tumor suppressor and sponge of miR-16 to block its role in promoting the tumorigenesis of bladder cancer. In this study, miR-16 binding sites were identified on UCA1 and the 3’UTR of PAPP-A mRNA, respectively. Also, the luciferase activity of cells was evidently reduced when the cells were co-transfected with miR-16 and wild-type UCA1/PAPP-A mRNA. These results suggested that UCA1 functions as a sponge of miR-16, while PAPP-A mRNA acts as a virtual target gene of miR-16. In humans, miR-16 targets WNT3A, BCL2 and cyclin D1 (CCND1), all of which can enhance cell cycle arrest at the G1/S checkpoint and suppress the invasion, proliferation, and survival of cancer cells [34]. In fact, it has been shown that, upon DNA damage, the expression of miR-16 is quickly increased before returning to a normal value. Altered expression of miR-16 can dramatically change the activity of Wip1. For example, the silencing of miR-16 expression promoted the expression of Wip1, while the over-expression of miR-16 significantly inhibited the expression of Wip1 upon DNA damage. Some of these miR-16 potential targets such as BCL2, Wip1, and CCND1 have been observed to be associated with or involved in the pathogenesis of PE [35–37]. An analysis carried out on the miRNA/miRNA GO network produced the most connections for miR-16. Also, the over-expression of miR-16 suppressed the migration and proliferation of decidua derived mesenchymal stem cells (dMSCs) while inducing cell-cycle arrest by binding to CCNE1. Furthermore, the over-expression of miR-16 also decreased the angiogenetic potential of HUVECs and blocked the migration of trophoblast cells, and this effect of miR-16 may be due to its activity in inhibiting the production of VEGF-A by dMSCs. Interestingly, the expression of VEGF-A and CCNE1 is negatively related to the expression of miR-16 in dMSCs, suggesting that the change in miR-16 expression in dMSCs may be implicated in the pathogenesis of PE. In this study, compared with that in cells transfected with the negative control, the relative expression of miR-16 was suppressed in cells transfected with UCA1 or anti-miR-16. In addition, the expression of PAPP-A mRNA/protein was elevated in cells transfected with UCA1 or anti-miR-16. Therefore, in the signaling pathway of UCA1/miR-16/PAPP-A, UCA1 acted as a negative regulator of miR-16 expression and an enhancer of PAPP-A mRNA/protein expression.
As a protein with high concentrations in the circulation of pregnant women, PAPP-A was initially discovered in 1974, although its biological role remained unclear for several decades. Nevertheless, PAPP-A1 has been used clinically as a biomarker in the screening of Down’s syndrome [8, 38]. In the 1990s, it was reported that PAPP-A is associated with a protease activity against insulin-like growth factor binding protein-4 (IGFBP-4), and a unique feature of this protease activity is that the presence of IGF-II or IGF-I is required to cleave IGFBP-4 [39–41]. As a protein complex, PAPP-A plays an important role and its expression in PE patients is significantly decreased [22]. Therefore, PAPP-A may be used as a potential biomarker for the early diagnosis of PE. Additionally, when the serum level of PAPP-A is used in conjunction with other serum biomarkers or imaging examinations, including the ultrasound examination of the uterine artery in the first trimester [6, 7], it may provide more valuable information for the early diagnosis of PE. Moreover, Canini et al. have shown that PAPP-A can be used as a more useful marker in the prediction of fetal growth restriction than in the prediction of PE [42]. Spencer et al. also showed that a low level of serum PAPP-A in pregnant women is associated with an elevated risk of SGA, regardless of the karyotype of the infants [43].
In conclusion, the findings of this study demonstrated that, compared with miR-16 and PAPP-A, UCA1 can be used as a biomarker of higher diagnostic value in the diagnosis of PE. Meanwhile, miR-16 was validated to act as a potential regulator of PAPP-A expression while UCA1 was demonstrated to sponge the expression of miR-16. Therefore, the signaling pathway of UCA1/miR-16/PAPP-A was established, in which the expression of PAPP-A was positively regulated by UCA1. Consequently, the reduced expression of UCA1 could exert a positive effect by reducing the expression of PAPP-A in the pathogenesis of PE.


