Introduction
Coronaviruses (CoVs) are enveloped, positive-sense single-stranded RNA viruses belonging to the Coronaviridae family of the order Nidovirales. CoVs have been broadly classified into four genera, i.e., α-, β-, γ- and δ-CoVs [1]. CoVs can trigger moderate to severe upper respiratory tract and gastrointestinal infections in mammals, birds, and humans. Currently, six human coronaviruses (HCoV), namely HCoV-229E, HCoV-OC43, HCoV-NL63, HCoV-HKU1, severe acute respiratory syndrome-CoV (SARS-CoV), and Middle East respiratory syndrome (MERS-CoV), have been reported to cause common cold and pneumonia-like infection. Recently, a seventh member of HCoV, i.e., SARS-CoV-2 (COVID-19) has been reported in Wuhan city (Hubei province, China) to cause severe pneumonia-like infection [2]. Since then, SARS-CoV-2 has spread throughout the world and has caused more than 79 million confirmed cases of COVID-19, including more than 1.75 million deaths (https://covid19.who.int; accessed on Dec 27, 2020). Out of the seven HCoVs, three (SARS-CoV, SARS-CoV-2, and MERS-CoV) are highly virulent and cause a severe respiratory infection, while the other four HCoVs (HCoV-229E, HCoV-OC43, HCoV-NL63, and HCoV-HKU1) are mild and cause only common cold-like symptoms.
The genome of SARS-CoV-2 is 29.9 kb in length, consisting of flanking untranslated regions (UTRs) at both 5’ and 3’ ends. The viral genome also possesses 11 open reading frames (ORFs); ORF 1a and 1b present at the 5’ proximal region of the RNA genome encode for polyprotein and constitute nearly 70% of the genome [3, 4]. ORF1a and 1b, which are expressed as polypeptides pp1a and pp1ab respectively, undergo proteolytic cleavage to produce 16 putative nonstructural proteins (nsps) [5]. The other end of the viral genome, i.e., the 3’ end, comprises 12 nested ORFs, which ultimately code for structural proteins, i.e., spike (S), envelope (E), membrane (M), nucleocapsid (N), and other accessory proteins. Out of these virus proteins, the main protease (Mpro), also known as chymotrypsin-like cysteine protease (3CLpro), encoded by nsp 5, has been established to play a significant role in viral gene expression and replication and thus appears to be an exciting target for SARS-CoV-2 drug design [6]. Another protease of SARS-CoV-2 known as PLpro has been comprehensively studied recently due to its involvement in the process of viral replication and host immune modulation. The principal function of PLpro and 3CLpro is to process the viral polyprotein in an organized manner, where PLpro has the supplementary function of shedding ubiquitin and ISG15 tags from host cell proteins, thus assisting the virus to escape the host innate immune responses [7]. Hence, lately, it was contended that targeting PLpro with drugs possessing antiviral properties may have an additional benefit in inhibiting viral replication and preventing the dysregulation of signaling cascades in infected cells that may lead to apoptosis in surrounding uninfected cells [8].
According to the US Centers for Disease Control and Prevention (CDC), two COVID-19 vaccines, manufactured by Pfizer-BioNTech and Moderna, are authorized and recommended for the treatment of COVID-19. In addition, two vaccines manufactured by AstraZeneca and Janssen are under Phase 3 clinical trials. However, with the identification of a new strain of SARS-CoV-2, more efforts are needed to quickly identify novel drugs/vaccines. A traditional approach to identify and develop a new antiviral agent against COVID-19 requires comprehensive knowledge of genomics, potential protein targets, and pathogenesis of SARS-CoV-2. Although the drugs developed using this approach would have a better anti-coronavirus effect, it would take around 10–12 years to develop drugs with proper approval to use clinically [9]. Another approach to identifying potent inhibitors of SARS-CoV-2 is the repurposing of known drugs. This approach’s main advantage is that knowledge of the dosage, efficacy, and potential side effects of drugs will be available beforehand, as they have already been approved to treat various infections. However, the drug-repurposing approach’s disadvantages are its broad-spectrum nature (thus it cannot be used against SARS-CoV-2 infection in a targeted manner) and the associated side effects. Nevertheless, an in silico approach to identify novel inhibitors of SARS-CoV-2 is to screen different databases for a molecule that may have therapeutic potential against COVID-19 [8]. Computational approaches including homology modeling, virtual screening by docking and molecular dynamics are a fast and time-saving approach to identify lead compounds against SARS-CoV-2 drug targets [10–13].
Natural compounds and herbal medicines offer a rich resource for a novel treatment for the SARS-CoV-2 infection. In China, plant-based medicines to fight infectious diseases employing Chinese traditional medicines have raised hope in the fight against the global pandemic situation (WHO). Previously, plant-derived natural products with diverse biological properties have been shown to possess inhibitory potential against Mpro and PLpro [14, 15]. In this study, we screened a natural compounds database and identified proanthocyanidin and rhapontin as potential inhibitors of SARS-CoV-2 Mpro and PLpro using computational approaches such as high throughput virtual screening, molecular docking (standard precision and extra precision), free energy calculations, and molecular dynamics simulation. The results of this study may provide crucial information to the scientific community to develop proanthocyanidin and rhapontin into potential therapeutic intervention against COVID-19 after validating their antiviral effects in vitro and in vivo.
Material and methods
Pre-processing of ligands
A library of natural products (L1400) containing 2267 unique and diverse ligand molecules was retrieved from Selleck Inc (www.selleck.com). As described previously, the ligands were preprocessed using the LigPrep tool (Schrodinger-2018-4, LLC, NY, USA) by generating different ionization states at pH 7.0 ±2.0 employing the Epik tool (Schrodinger-2018-4, LLC, USA, NY) and the removal of any salt [16]. A maximum of 32 different conformational states of a given ligand were produced, and their energies were minimized using OPLS3e forcefield.
Preprocessing of target proteins
The crystal structures of SARS-CoV-2 proteases Mpro (PDB Id: 6LU7) and PLpro (PDB ID: 6W9C) were downloaded from the RCSB protein data bank (www.rcsb.org/pdb). The crystal structure of Mpro (resolution: 2.16 Å) has been reported with a bound inhibitor N3, while that of PLpro (resolution: 2.70 Å) has been reported without any inhibitor. Prior to virtual screening and molecular docking, the proteins were preprocessed using Protein preparation wizard (Schrodinger-2018-4, LLC, NY, USA) as reported before [17, 18]. Briefly, missing hydrogen atoms were added, and then appropriate bond orders were allotted. The crystallographic water molecules establishing less than three contacts with protein were removed. Further, any missing side chains or loops were modelled with the Prime module (Schrodinger-2018-4, LLC, NY, USA). Finally, a hydrogen-bond network was generated on the processed proteins and their energies were minimized employing OPLS3e forcefield. Grid boxes around the substrate binding sites of both the proteins were generated by means of the Receptor-grid generation tool (Schrodinger-2018-4, LLC, NY, USA). The dimensions of the grid box used were 88 × 88 × 88 Å and 78 × 78 × 78 Å for Mpro and PLpro, respectively. Prior to docking, the structure of target proteins was energy minimized using OPLS3e forcefield.
High throughput virtual screening, standard- and extra-precision molecular docking
The natural product library was first screened against the target proteins (Mpro and PLpro) by high throughput virtual screening (HTVS) using Glide (Schrodinger-2018-4, LLC, NY, USA) as reported previously [19]. The top-scoring 50 ligands against each target protein (docking energy range: –5.424 to –11.212 kcal/mol for Mpro; –5.185 to –6.973 kcal/mol for PLpro) were selected and subjected to standard-precision (SP) molecular docking with default settings. Finally, the best 6 ligands with the lowest binding energies against each protein were again subjected to molecular docking using extra-precision (XP) mode. The scaling factor and partial charge cut-off in XP docking were set to 0.80 and 0.15, respectively. The results were analyzed and visualized in Maestro (Schrodinger-2018-4, LLC, NY, USA). The binding affinity (Kd) of the ligand was calculated from the docking free energy (ΔG) with the help of the equation given [20, 21]: ΔG = –RT ln Kd, where R and T were the Boltzmann gas constant (= 1.987 cal/mol/K) and temperature (= 298 K) respectively.
Further, the ligand efficiency (LE), which measures the validation of docking interactions, was estimated using the relation: LE = ΔG/N, where ΔG is the docking free energy, and N is the number of non-hydrogen atoms or heavy atoms in the ligand.
Validation of docking protocol by enrichment calculation
The validity of the docking procedure adopted in this study was conducted using an enrichment calculator in Maestro (Schrodinger-2018, LLC, NY, USA) as described previously [22]. It evaluates the docking procedure’s ability to identify active ligands from a pool of inactive decoys and place them in the top percentage of a ranked database. Standard inactive ligands or the decoy set of Schrodinger was employed for enrichment purposes. The area under the curve (AUC) and enrichment factor was calculated at 1 and 20%, respectively [23].
Calculations of binding free energy using Prime/MM-GBSA
The binding free energy of protein-ligand interaction was calculated using the Prime/MM-GBSA method (Schrodinger-2018-4, LLC, NY, USA) as reported before [24]. Briefly, the binding energy of the protein-ligand complex was determined using the molecular mechanics forcefield. A generalized Born and surface area continuum (implicit) solvent model and rotamer search algorithms were also employed, as defined by the following equation [19]: ΔG = E(complex)minimized – [E(ligand)minimized + E(protein)minimized].
To calculate MM-GBSA, ligand atoms were set unrestricted while the atoms of protein were fixed, and based on free energies, generated protein-ligand poses were ranked.
Molecular dynamics (MD) simulation
The dynamics and stability of the protein-ligand complex were measured by performing molecular dynamics simulation using Desmond (Schrodinger-2018-4, LLC, NY, USA), as reported previously [25]. Briefly, the protein-ligand complex was positioned in an orthorhombic simulation box, keeping a minimum distance of 10 Å from the box’s boundaries. The TIP3P explicit water model was used to solvate the simulation box, and the system was neutralized by adding appropriate counter ions. The concentration of NaCl was adjusted to 150 mM to simulate the biological condition. The complete system was pre-equilibrated for 2000 iterations with a convergence criterion of 1 kcal/mol/Å using OPLS3e force field. Lastly, simulation (50 ns) was executed employing an NPT ensemble at 300 K and 1 bar, using OPLS3e forcefield. A Nose-Hoover Chain thermostat and a Martyna-Tobias-Klein barostat were employed to maintain the temperature and pressure constant [26, 27]. During the simulation process, a time step of 2 fs was set, and at every 10 ps, the energies and structures were recorded in the trajectory.
Physiological and ADMET properties
The physicochemical and ADMET (absorption, distribution, metabolism, excretion, and toxicity) properties of the most potent ligands were assessed employing QikProp (Schrodinger-2018-4, LLC, NY, USA) as reported before [28]. QikProp predicts ADMET properties on the basis of complete 3D molecular structure of a ligand. The following descriptors were evaluated: molecular weight (Mol_MW), solvent accessible surface area (SASA), hydrophobic component of SASA (FOSA), hydrophilic component of SASA (FISA), polar component of SASA (PISA), weakly polar component of SASA (WPSA), hydrogen bond donor (donorHB), hydrogen bond acceptor (accptHB), number of rotatable bonds, polarizability (QPpolrz), hexadecane/gas partition coefficient (QPlogPC16), octanol/gas partition coefficient (QPlogPoct), water/gas partition coefficient (QPlogPw), octanol/water partition coefficient (QPlogPo/w), solubility (QPlogS), conformation-dependent solubility (CIQPlogS), blockage of HERG K+ channel (QPlogHERG), CACO permeability (QPPCaco), blood/brain partition coefficient (QPlogBB), MDCK cell permeability (QPPMDCK), skin permeability (QPlogKp), binding to human serum albumin (QPlogKhsa) and % oral absorption.
Results
Virtual screening of natural compounds against Mpro and PLpro
In this study, the high throughput virtual screening of natural compounds led us identifying 50 potential drug candidates against Mpro and PLpro (Supplementary Tables SI and SII). Standard precision (SP) and extra precision (XP) molecular docking further shortlisted the potential compounds to 6 each against Mpro and PLpro (Table I). The most promising compounds against Mpro were Polymyxin B, Complanatuside, Kaempferol-3-O-glucosrhamanoside, Proanthocyanidin, Typhaneoside, and Amikacin. Likewise, the most potential compounds against PLpro were Secoisolariciresinol diglucoside, Sophoricoside, Eriocitrin, (+)-Catechin, Rhapontin, and Nadide. The XP molecular docking scores of Polymyxin B, Complanatuside, Kaempferol-3-O-glucosrhamanoside, Proanthocyanidin, Typhaneoside, and Amikacin towards Mpro were –10.704, –10.599, –10.566, –10.515, –9.442, and –9.103 kcal/mol, respectively (Table I). Similarly, the XP molecular docking score of Rhapontin, Secoisolariciresinol diglucoside, Eriocitrin, Sophoricoside, Nadide, and (+)-Catechin was –10.022, –9.374, –8.677, –8.066, –5.629, and –5.006 kcal/mol against PLpro (Table II). Further, the free energy of interaction between proteins and natural compounds were determined by performing Prime/MM-GBSA on all the selected compounds listed in Table I. The Prime/MM-GBSA energy of Proanthocyanidin and Rhapontin were the lowest, –89.98 and –61.39 kcal/mol against Mpro and PLpro, respectively (Table I).
Table I
Extra precision (XP) molecular docking and Prime/MM-GBSA scores of SARS-CoV-2 Mpro and PLpro with the most promising natural compounds
Table II
Molecular interaction between SARS-CoV-2 Mpro and PLpro proteins with their respective inhibitors
Validation of receiver operating characteristic (ROC) curve
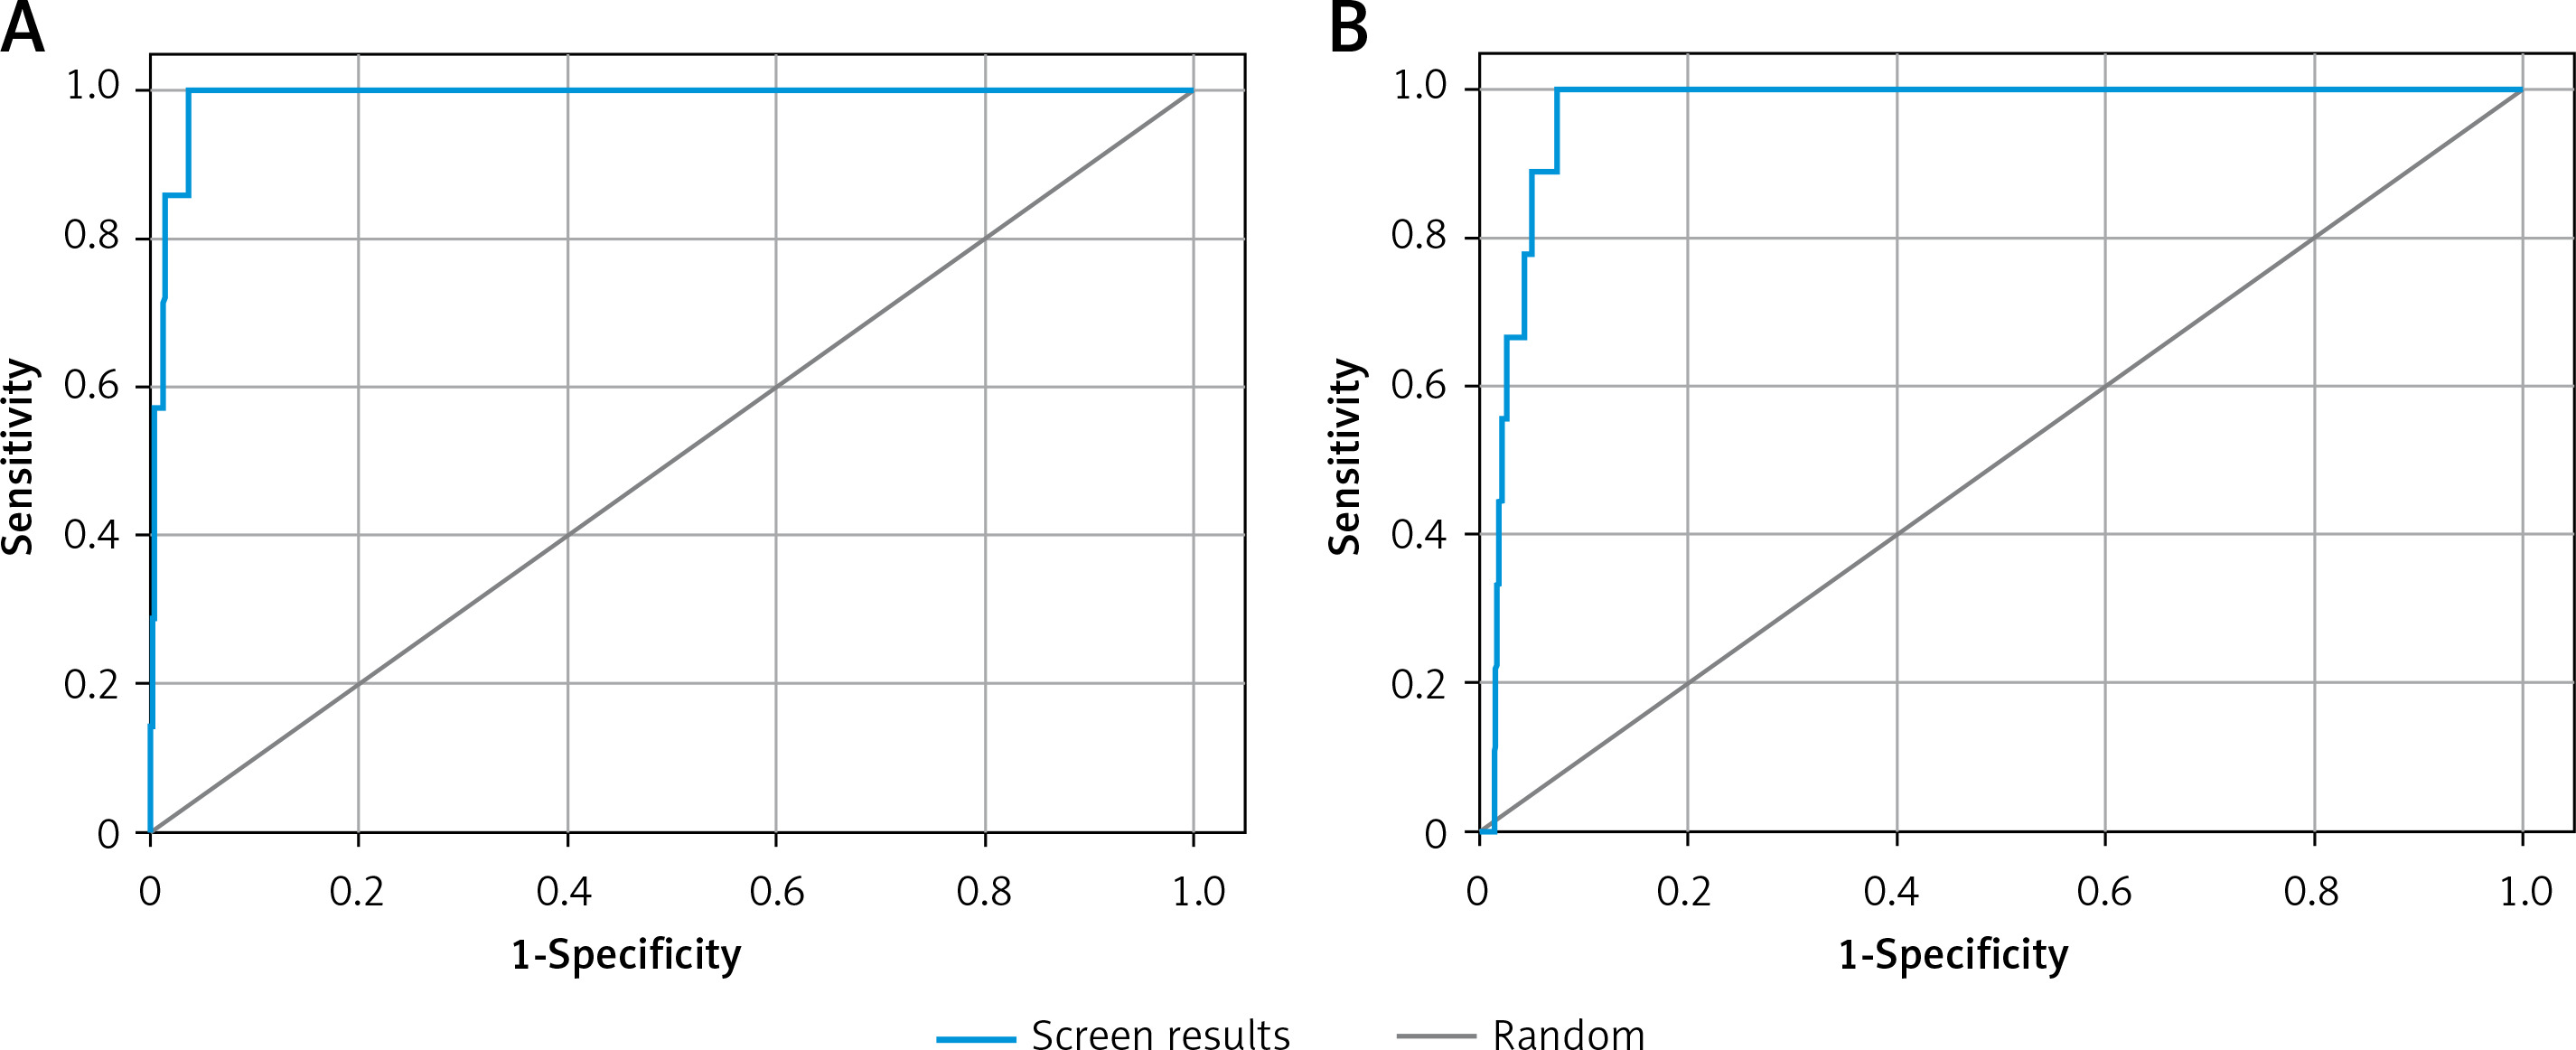
The validity of docking procedures was established by performing enrichment calculation on the shortlisted 6 compounds with the lowest docking energies against each target proteins. The enrichment analysis was performed by plotting ROC curves and checking the adopted docking protocol’s ability to distinguish the active compounds from a pool of decoy set of inactive compounds (Figure 1). The ROC values of XP docking against Mpro and PLpro were 0.99 and 0.97, respectively. The BEDROC scores for Mpro and PLpro docking were 0.929 at α-0.0556 and 0.788 at α-0.0714, respectively. Moreover, the area under curve (AUC) values of compounds docked to Mpro and PLpro were 0.99 and 0.96, respectively. Since the AUC values for both Mpro and PLpro docking were significantly greater than 0.5, it is clear that the docking procedure adopted in this study is accurate in predicting the active compounds from an extensive database. Moreover, root mean square deviation (RMSD) between the crystal structure pose and docked pose of Mpro bound N3 was elucidated and was estimated to be 1.1564 Å (Supplementary Figure S1).
Interaction between proteins and inhibitors
Investigation of Mpro-proanthocyanidin interaction
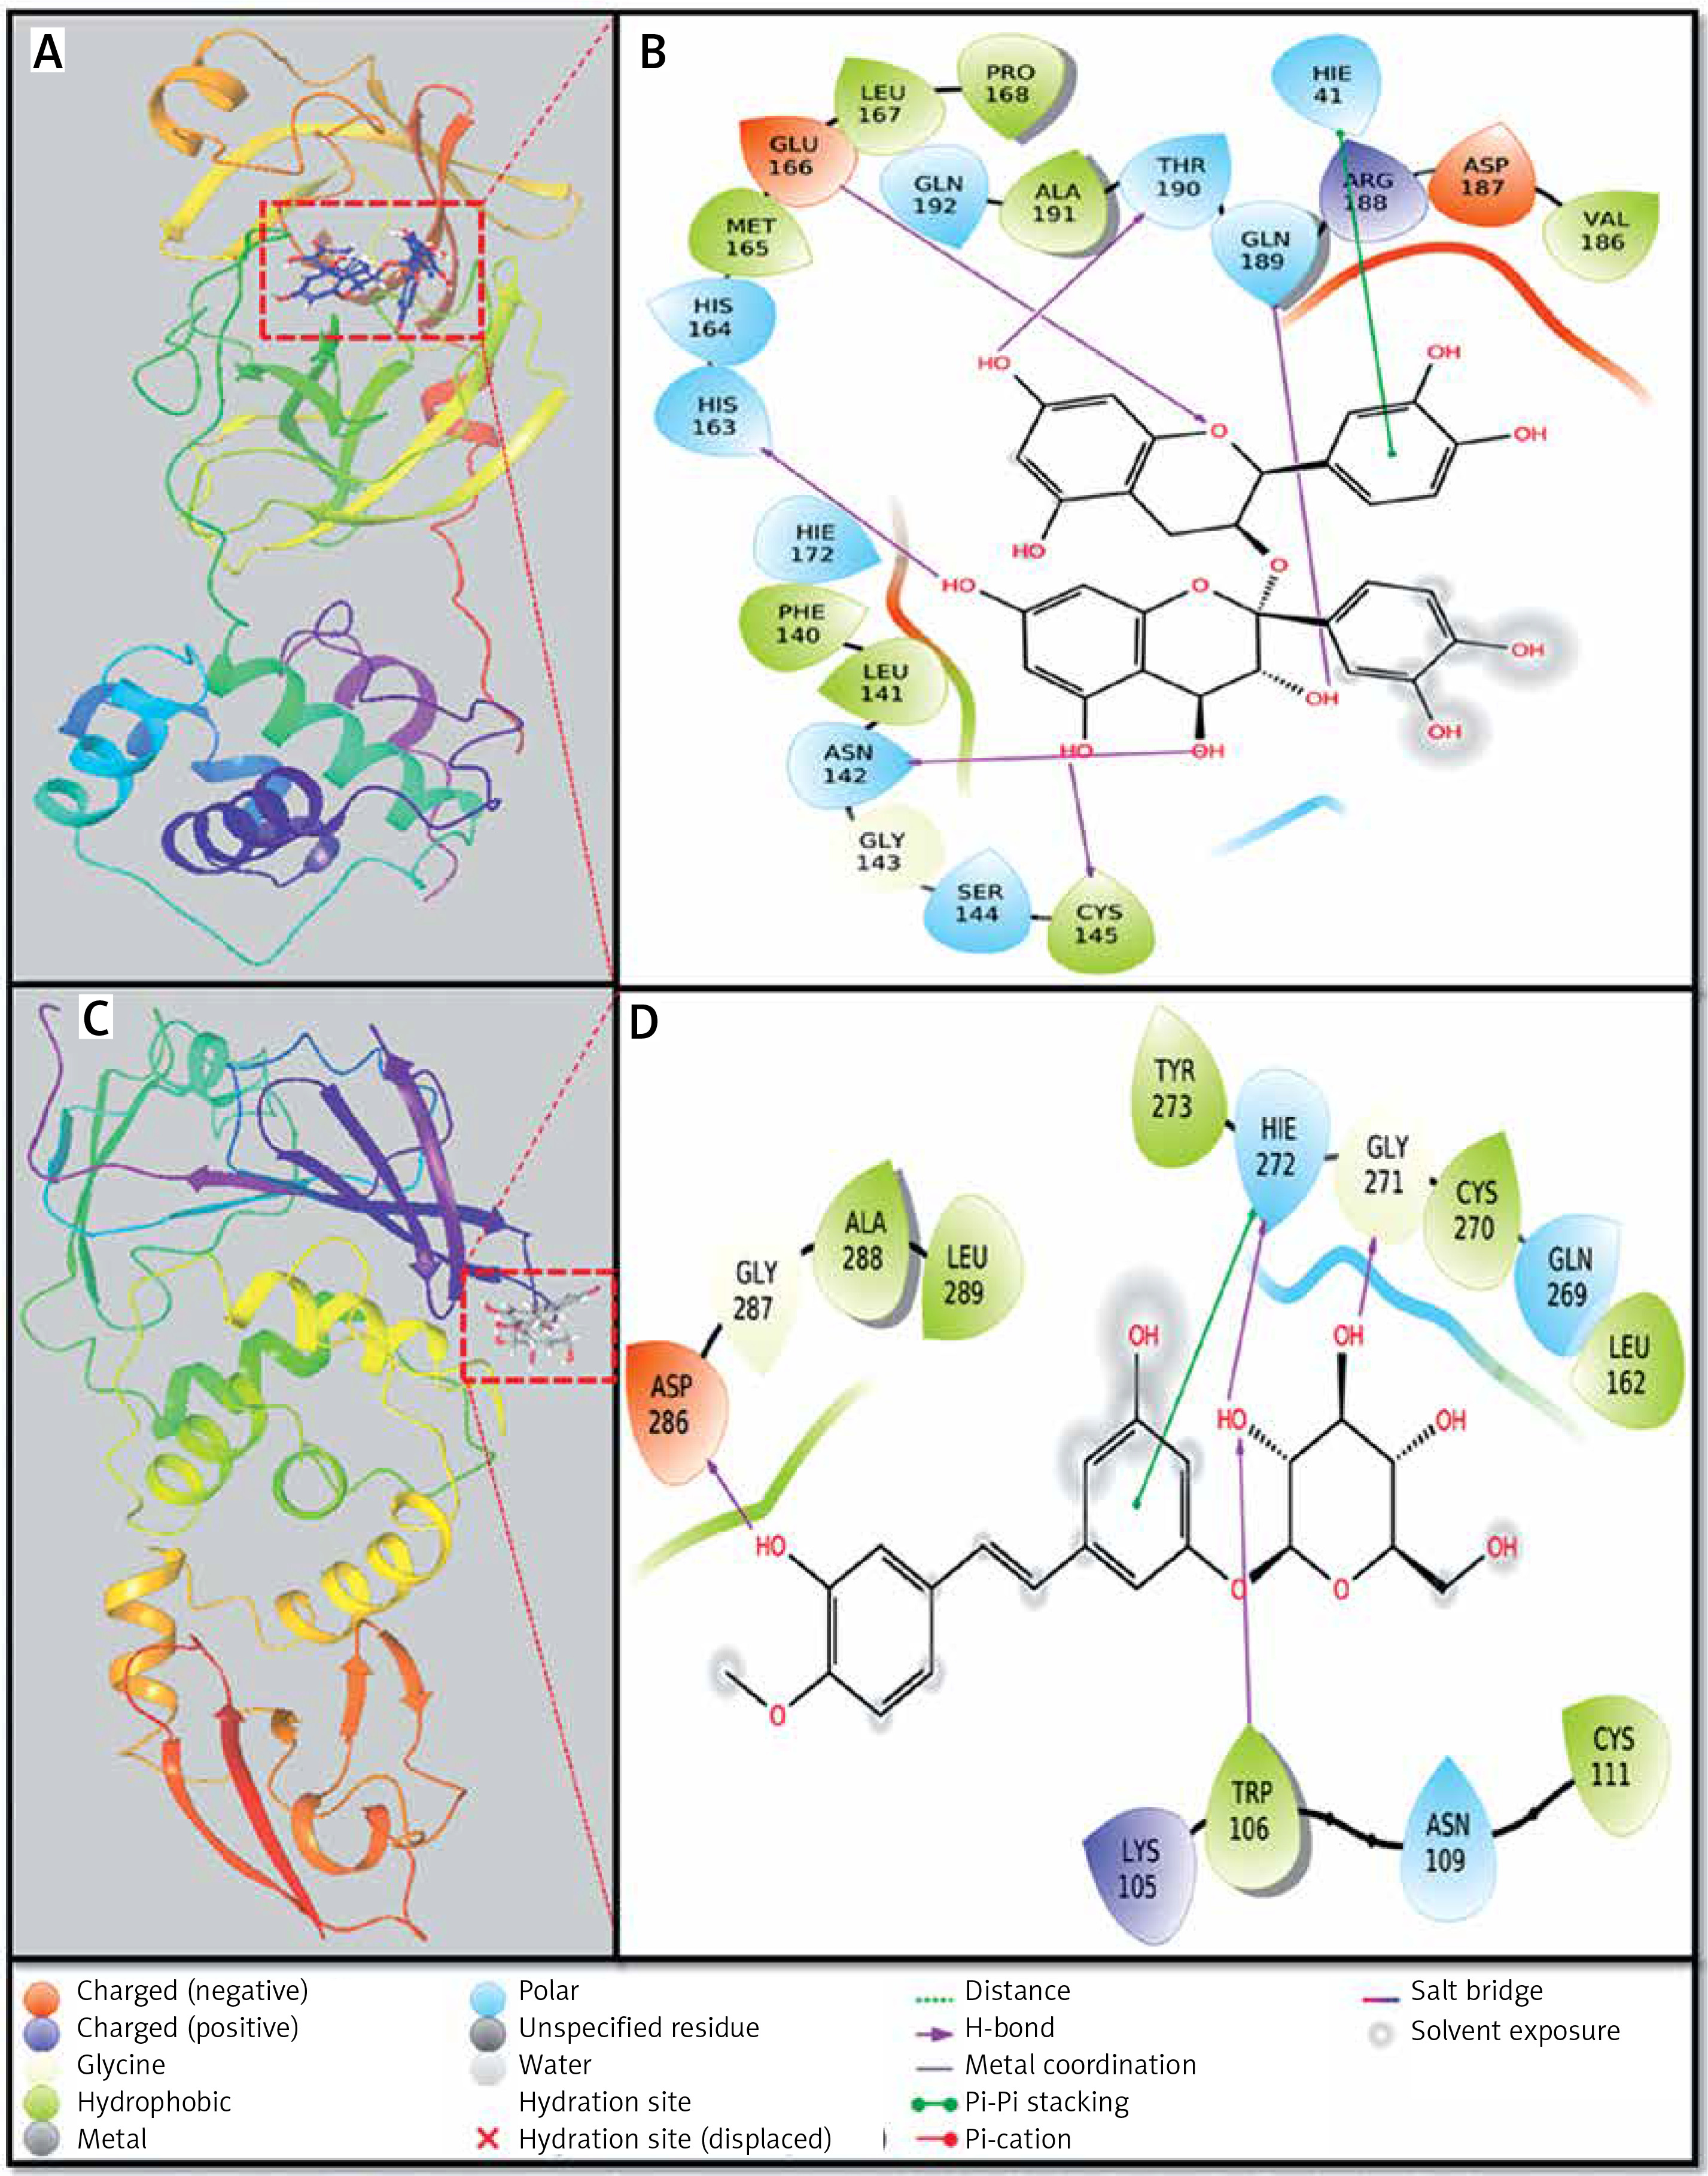
A detailed analysis of Mpro and Proanthocyanidin’s interaction implicates that the inhibitor was bound to the substrate-binding site of Mpro. The Mpro-Proanthocyanidin complex was stabilized by six hydrogen bonds with Asn142, Cys145, His163, Glu166, Gln189, and Thr190 (Figure 2 A, Table II). The amino acid residues responsible for van der Waals’ interaction with Proanthocyanidin were Phe140, Leu141, Gly143, Ser144, His164, Met165, Leu167, Pro168, Hie172, Val186, Asp187, Arg188, Ala191, and Gln192. Further, there was a hydrophobic interaction between the active site residue Hie41 and Proanthocyanidin. The docking energy of interaction between Mpro and Proanthocyanidin was assessed to be –10.566 kcal/mol, which corresponded to a binding affinity of 5.62 × 10⁷ M–1 (Table II). Also, the ligand efficiency of Proanthocyanidin to bind Mpro was estimated to be –0.153 kcal/mol (Table II).
Investigation of PLpro-rhapontin interaction
A close investigation of the PLpro-Rhapontin complex suggests that Rhapontin was bound to the substrate-binding site of PLpro, situated at the cleft of thumb and palm domains. Rhapontin formed four hydrogen bonds with Trp106, Gly271, Hie272, and Asp286; and hydrophobic interaction with the active site residue Hie272 (Figure 2 B, Table II). Further, the amino acids responsible for van der Waals’ interaction with Rhapontin were Lys105, Asn109, Cys111, Leu162, Gln269, Cys270, Tyr273, Gly287, Ala288, and Leu289. The respective docking energy and docking affinity of PLpro towards the Rhapontin complex were estimated as –10.022 kcal/mol and 2.24 × 10⁷ M–1 (Table II). Moreover, the ligand efficiency of Rhapontin to bind PLpro was predicted to be –0.186 kcal/mol (Table II).
Analysis of molecular dynamics (MD) simulation
To investigate the structure and dynamics of proteins (Mpro and PLpro) complex with their respective inhibitors (Proanthocyanidin and Rhapontin), we have performed MD simulation for 50 ns, and the results are presented below.
Root mean square deviation (RMSD)
RMSD is a fundamental property to investigate the changes in the conformation and compactness of a protein occurred due to the binding of a ligand. An analysis of the deviation in Cα-atoms of Mpro with respect to the initial frame of protein alone (blue line) or in a complex (brown line) with Proanthocyanidin revealed a significant fluctuation in RMSD values for the initial 20 ns of simulation time (Figure 3). However, for the later part of the simulation (21–50 ns), the RMSD values were within the maximum allowed value of 2.0 Å, thus indicating a stable Mpro-Proanthocyanidin complex formation (Figure 3 A). Similarly, the variation in Cα-atoms of PLpro alone (blue line) with respect to its initial frame suggests that the protein attained a stable conformation at the start of the simulation. The RMSD values of PLpro alone remain within 1.2–2.4 Å throughout the simulation. Although the RMSD values in Cα-atoms of PLpro-Rhapontin complex (brown line) with respect to the initial frame fluctuated enormously for 0–25 ns, it was stabilized within the acceptable limit of 2.0 Å for the remaining simulation time (Figure 3 B). At the start of the simulation, the minor fluctuations in RMSD values were expected due to the entry of big ligands such as Proanthocyanidin and Rhapontin into the substrate binding cavity of Mpro and PLpro respectively. However, on the formation of stable interactions, the RMSD values of Mpro as well as PLpro get stabilized.
Figure 3
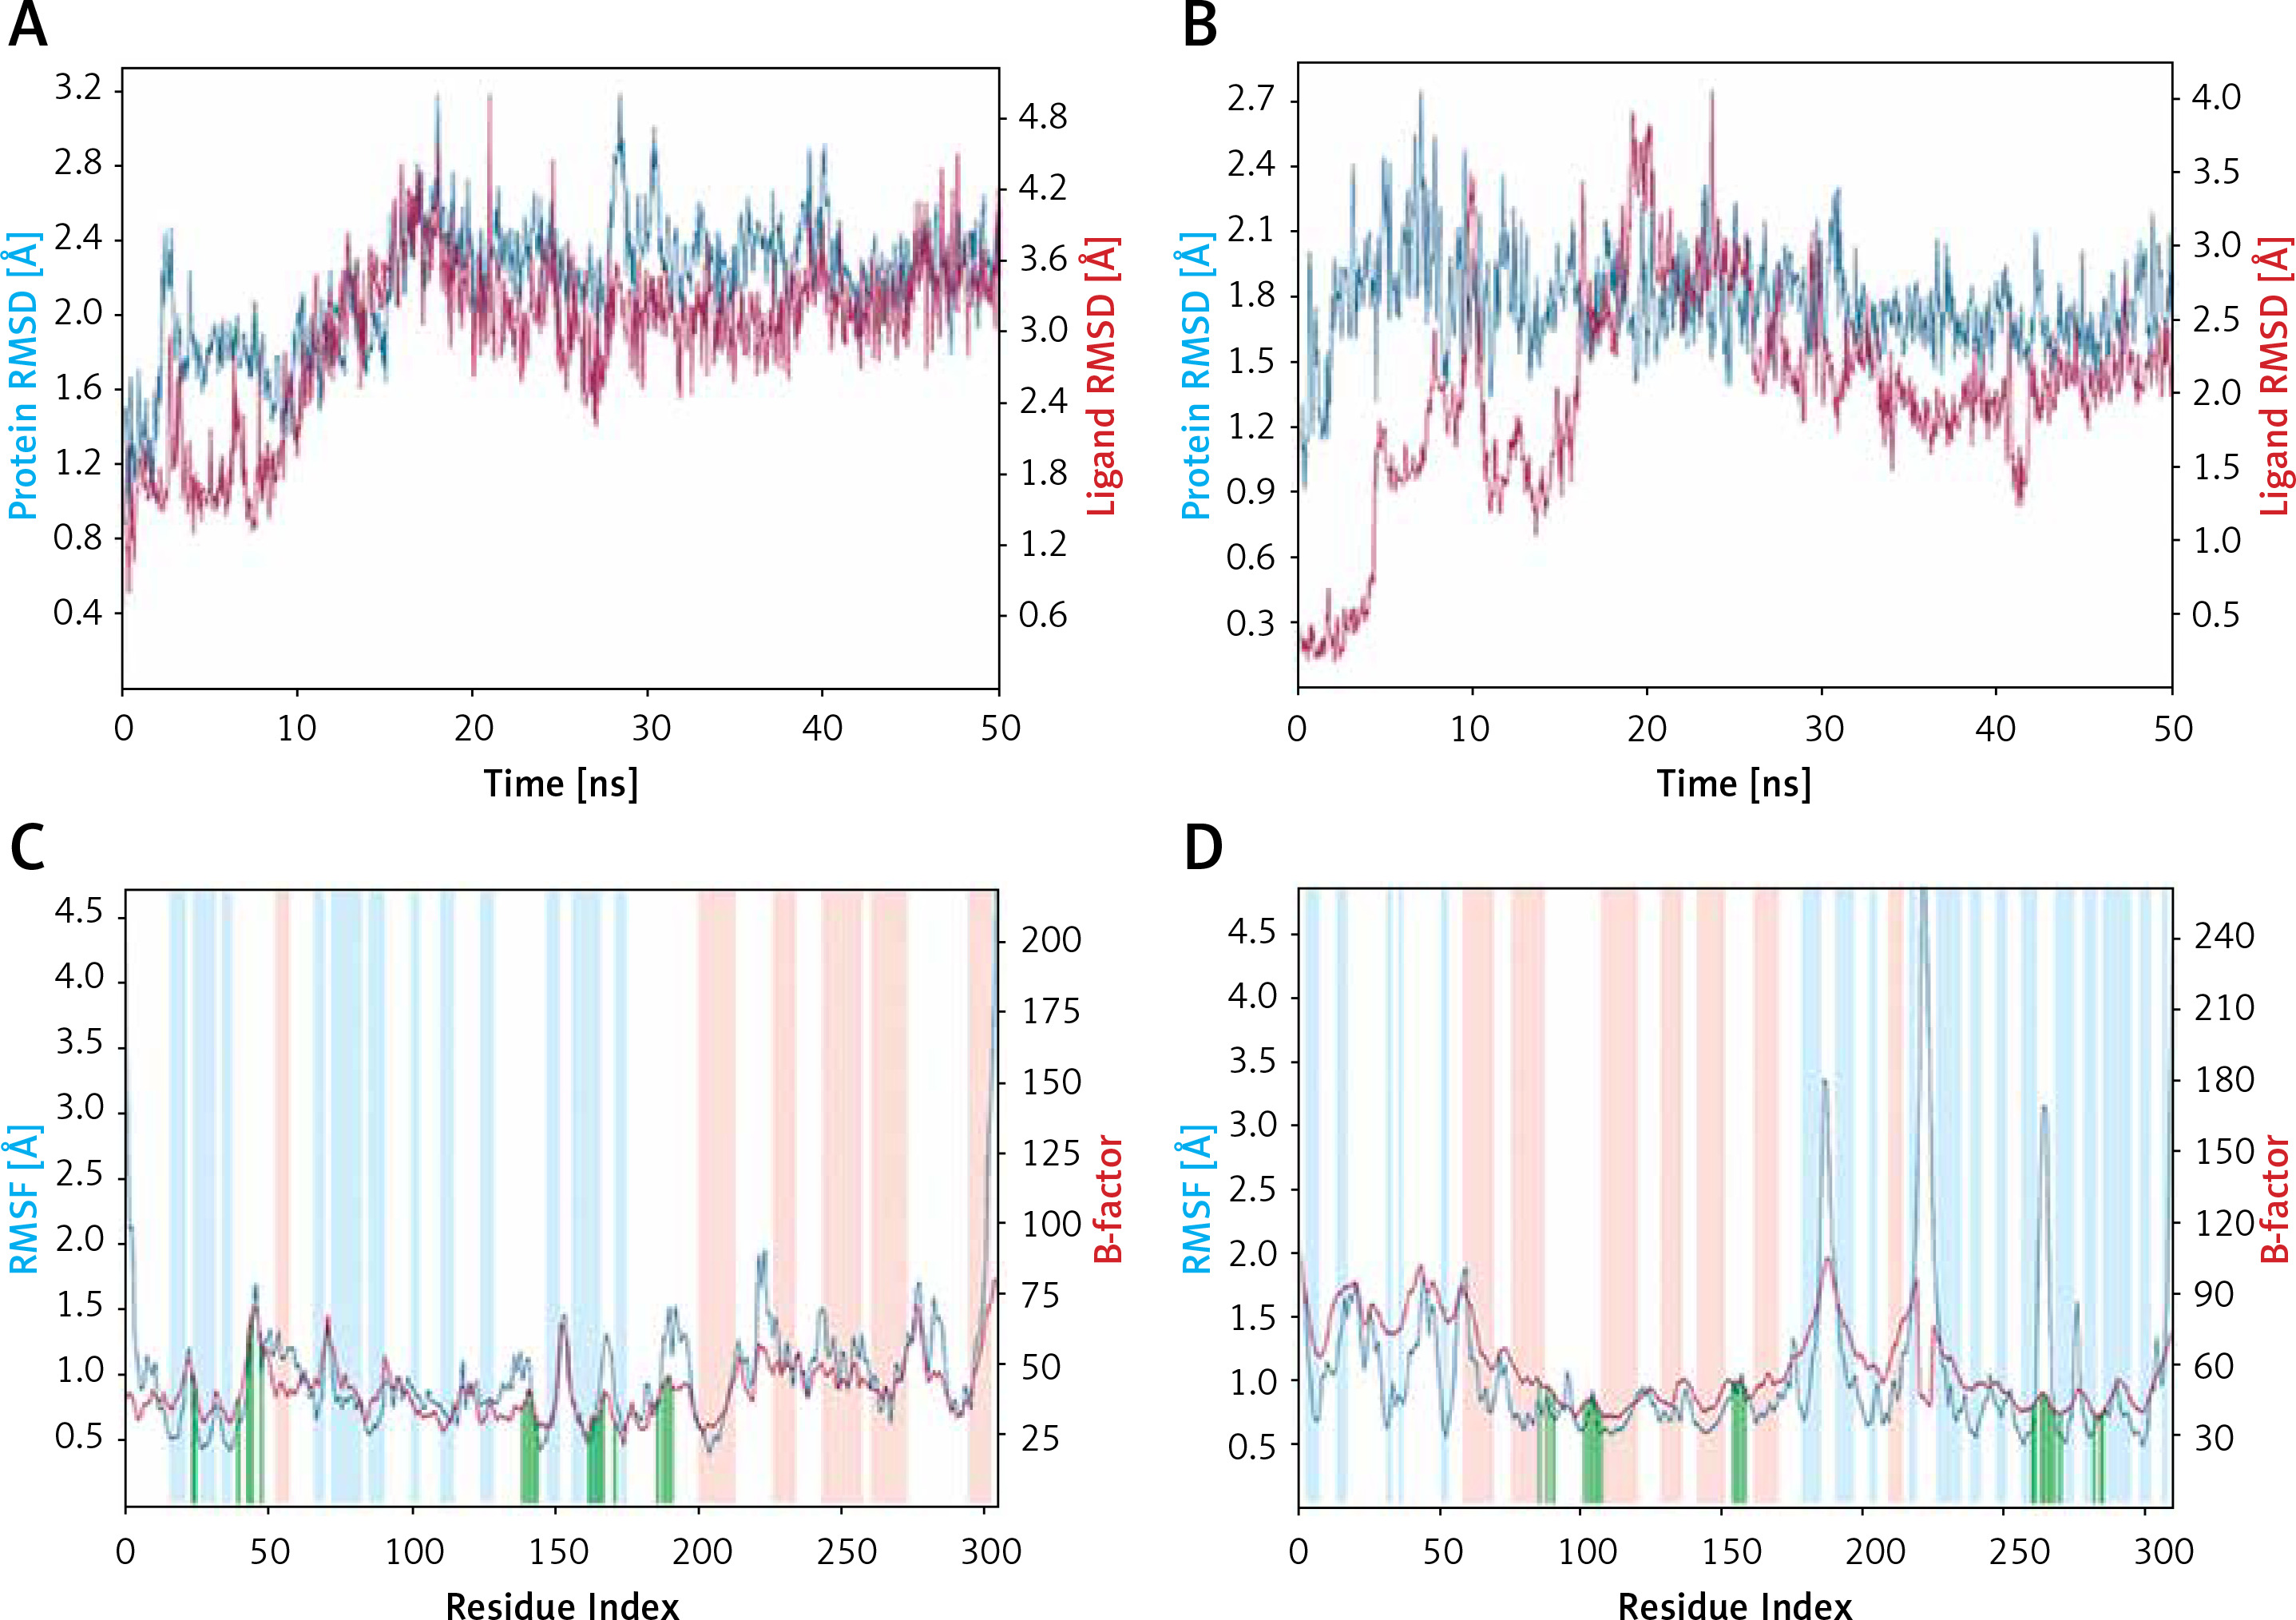
Molecular dynamics (MD) simulation analysis. A – Root mean square deviation (RMSD) of Mpro alone and in the presence of proanthocyanidin, B – RMSD of PLpro alone and in the presence of rhapontin, C – variation in root mean square fluctuation (RMSF) of Mpro in the presence of proanthocyanidin and comparison with the experimentally determined B-factor during X-ray crystallography, D – RMSF of PLpro in the presence of rhapontin and comparison with the experimentally determined B-factor during X-ray crystallography. In plots C and D, the vertical green lines shows the position of amino acid residue involved in the interaction with inhibitor. Also, light brown and teal colors indicate α-helical and β-sheet regions
Root mean square fluctuation (RMSF)
RMSF values of Mpro and PLpro were calculated to gain an insight into the fluctuation of side chains and hence local conformation of a protein during the simulation (Figures 3 C, D). The variation in RMSF of proteins (teal line) along their chain length was compared to their respective B-factors (brown line), which were determined experimentally during X-ray crystallography. Moreover, the vertical bars in light pink, teal and white color represent regions of the protein participating in the formation of α-helices, β-sheets and loops respectively. The vertical green lines on the X-axis show the position of amino acid residue forming an interaction with the protein.
As evident from Figure 3 C, the N- and C-terminals of Mpro tend to fluctuate more as they remain free from the rest of the protein. Overall, Mpro remained stable upon interacting with Proanthocyanidin as there were only minor fluctuations in the loop regions (white bars) of the protein. Similarly, the overall structure of PLpro in the presence of Rhapontin also remains consistent throughout the simulation, as evident from the minor fluctuations in the α-helices and β-sheets of PLpro. However, some significant fluctuations in PLpro were observed in the loop regions of protein due to the binding of a large molecule like Rhapontin (Figure 3 D).
Protein-ligand interaction analysis
An analysis of molecular interaction between Mpro and Proanthocyanidin during MD simulation revealed that the Mpro-Proanthocyanidin complex was mainly stabilized by hydrogen bonding, a minor contribution of hydrophobic interactions and water bridges (Figure 4 A). The catalytic residue His41 of Mpro interacted with Proanthocyanidin for about 50% of simulation through hydrogen bonding, hydrophobic interaction, and water bridges. Similarly, another catalytic residue of Mpro i.e., Cys145 formed a hydrogen bond and water bridges with Proanthocyanidin for 100% and 40% simulation time, respectively. Some other residues, such as Glu166, Thr190, and Gln192, formed a hydrogen bond with Proanthocyanidin for 90–100% simulation. The residues Pro168 and Gln189 were engaged in hydrophobic and hydrogen bonding for 50 and 40% simulation time (Figure 4 A). The total number of contacts between Mpro and Proanthocyanidin throughout the simulation was estimated in the range of 4–16, with an average of 9 contacts (Figure 4 B, upper panel). The behavior of amino acid residues in making interaction with Proanthocyanidin as a function of simulation is also depicted (Figure 4 B, lower panel). It appears that His41, Cys145, Glu166, Pro168, Gln189, Thr190, and Gln192 participated in the interaction with Proanthocyanidin for most of the simulation time.
Figure 4
Interaction pattern between proteins and their respective inhibitor as a function of simulation. A – Involvement of Mpro amino acid residues in forming different types of interaction with proanthocyanidin. B – Upper panel: The total number of contacts between Mpro and proanthocyanidin during simulation. Lower panel: the extent of amino acid residues forming contact with the inhibitor. C – Involvement of PLpro amino acid residues in forming different types of interaction with rhapontin. D – Upper panel: The total number of contacts between PLpro and rhapontin during simulation. Lower panel: the extent of amino acid residues forming contact with the inhibitor
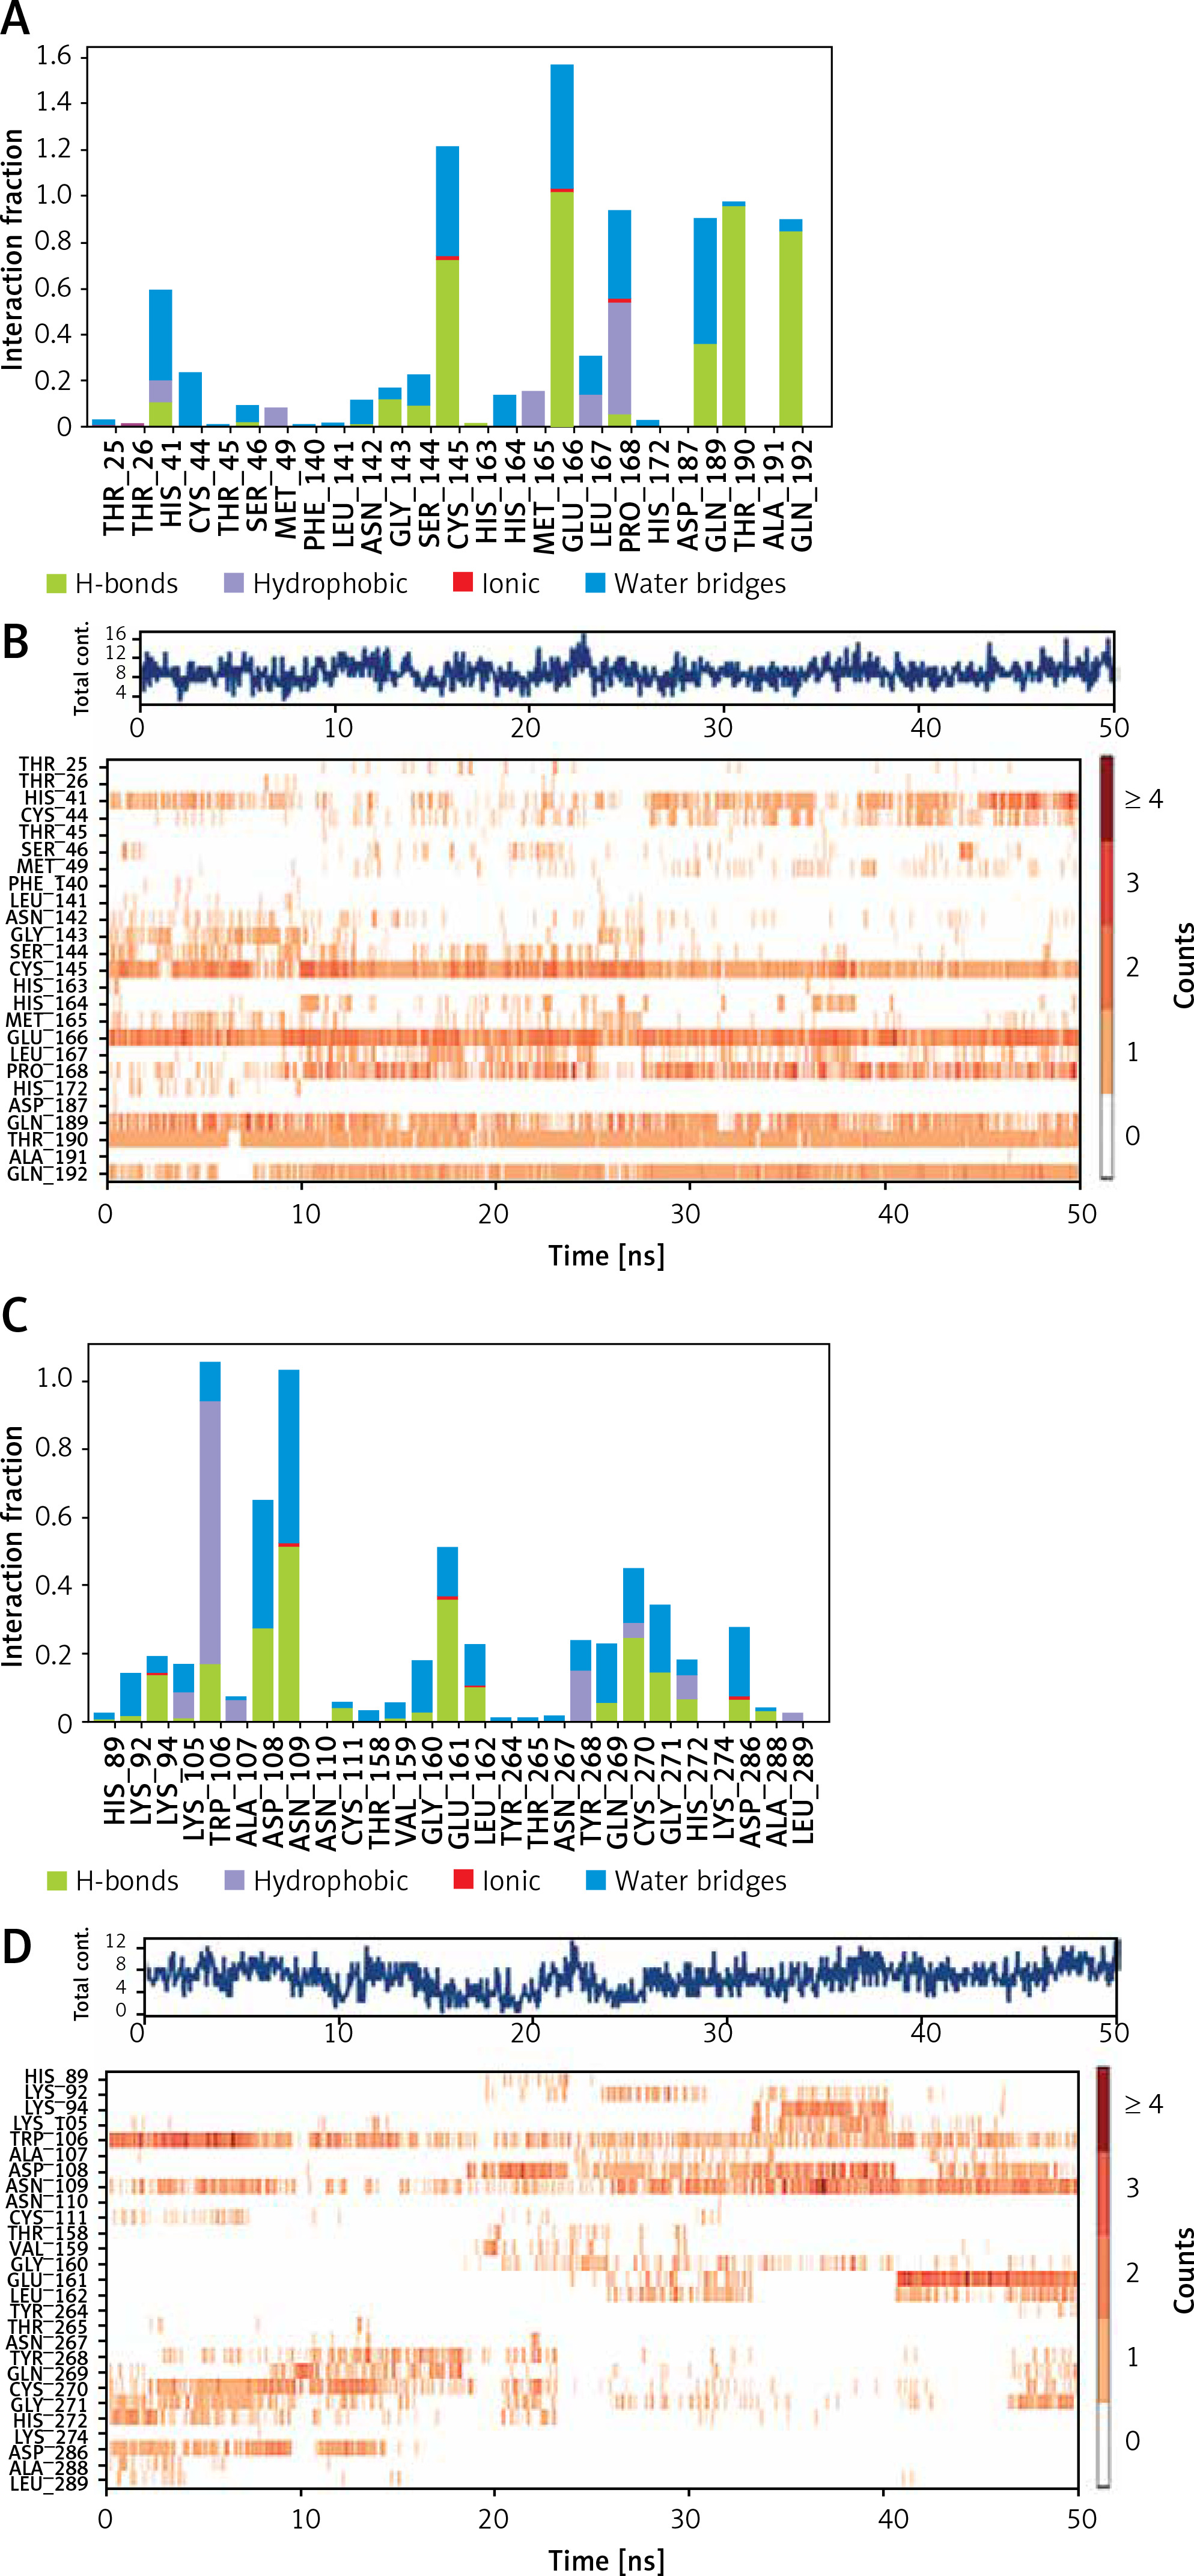
An insight into the MD simulation of PLpro-Rhapontin complex suggested that it was stabilized by hydrogen bonding, hydrophobic interactions, and a small contribution of water bridges (Figure 4 C). The catalytic residue Trp106 interacted with Rhapontin for about 95% of simulation time through hydrogen bonding, hydrophobic interaction, and water bridges. The residue Asp108 and Asn109 also contributed significantly in stabilizing the PLpro-Rhapontin complex by forming a hydrogen bond for 30% and 55% simulation time respectively. Other residues such as Glu161, Cys270, Gly271, and Asp286 also formed hydrogen bonds and water bridges with PLpro for more than 30% simulation time (Figure 4 C). The total number of contacts between Mpro and Proanthocyanidin throughout the simulation was estimated in the range of 1–14, with an average of 8 contacts (Figure 4 D, upper panel). The behavior of amino acid residues in making interaction with Rhapontin as a function of simulation is also depicted (Figure 4 D, lower panel). It was found that Trp106, Asp108, and Asn109 participated in the interaction with Rhapontin for most of the simulation time.
Secondary structure analysis
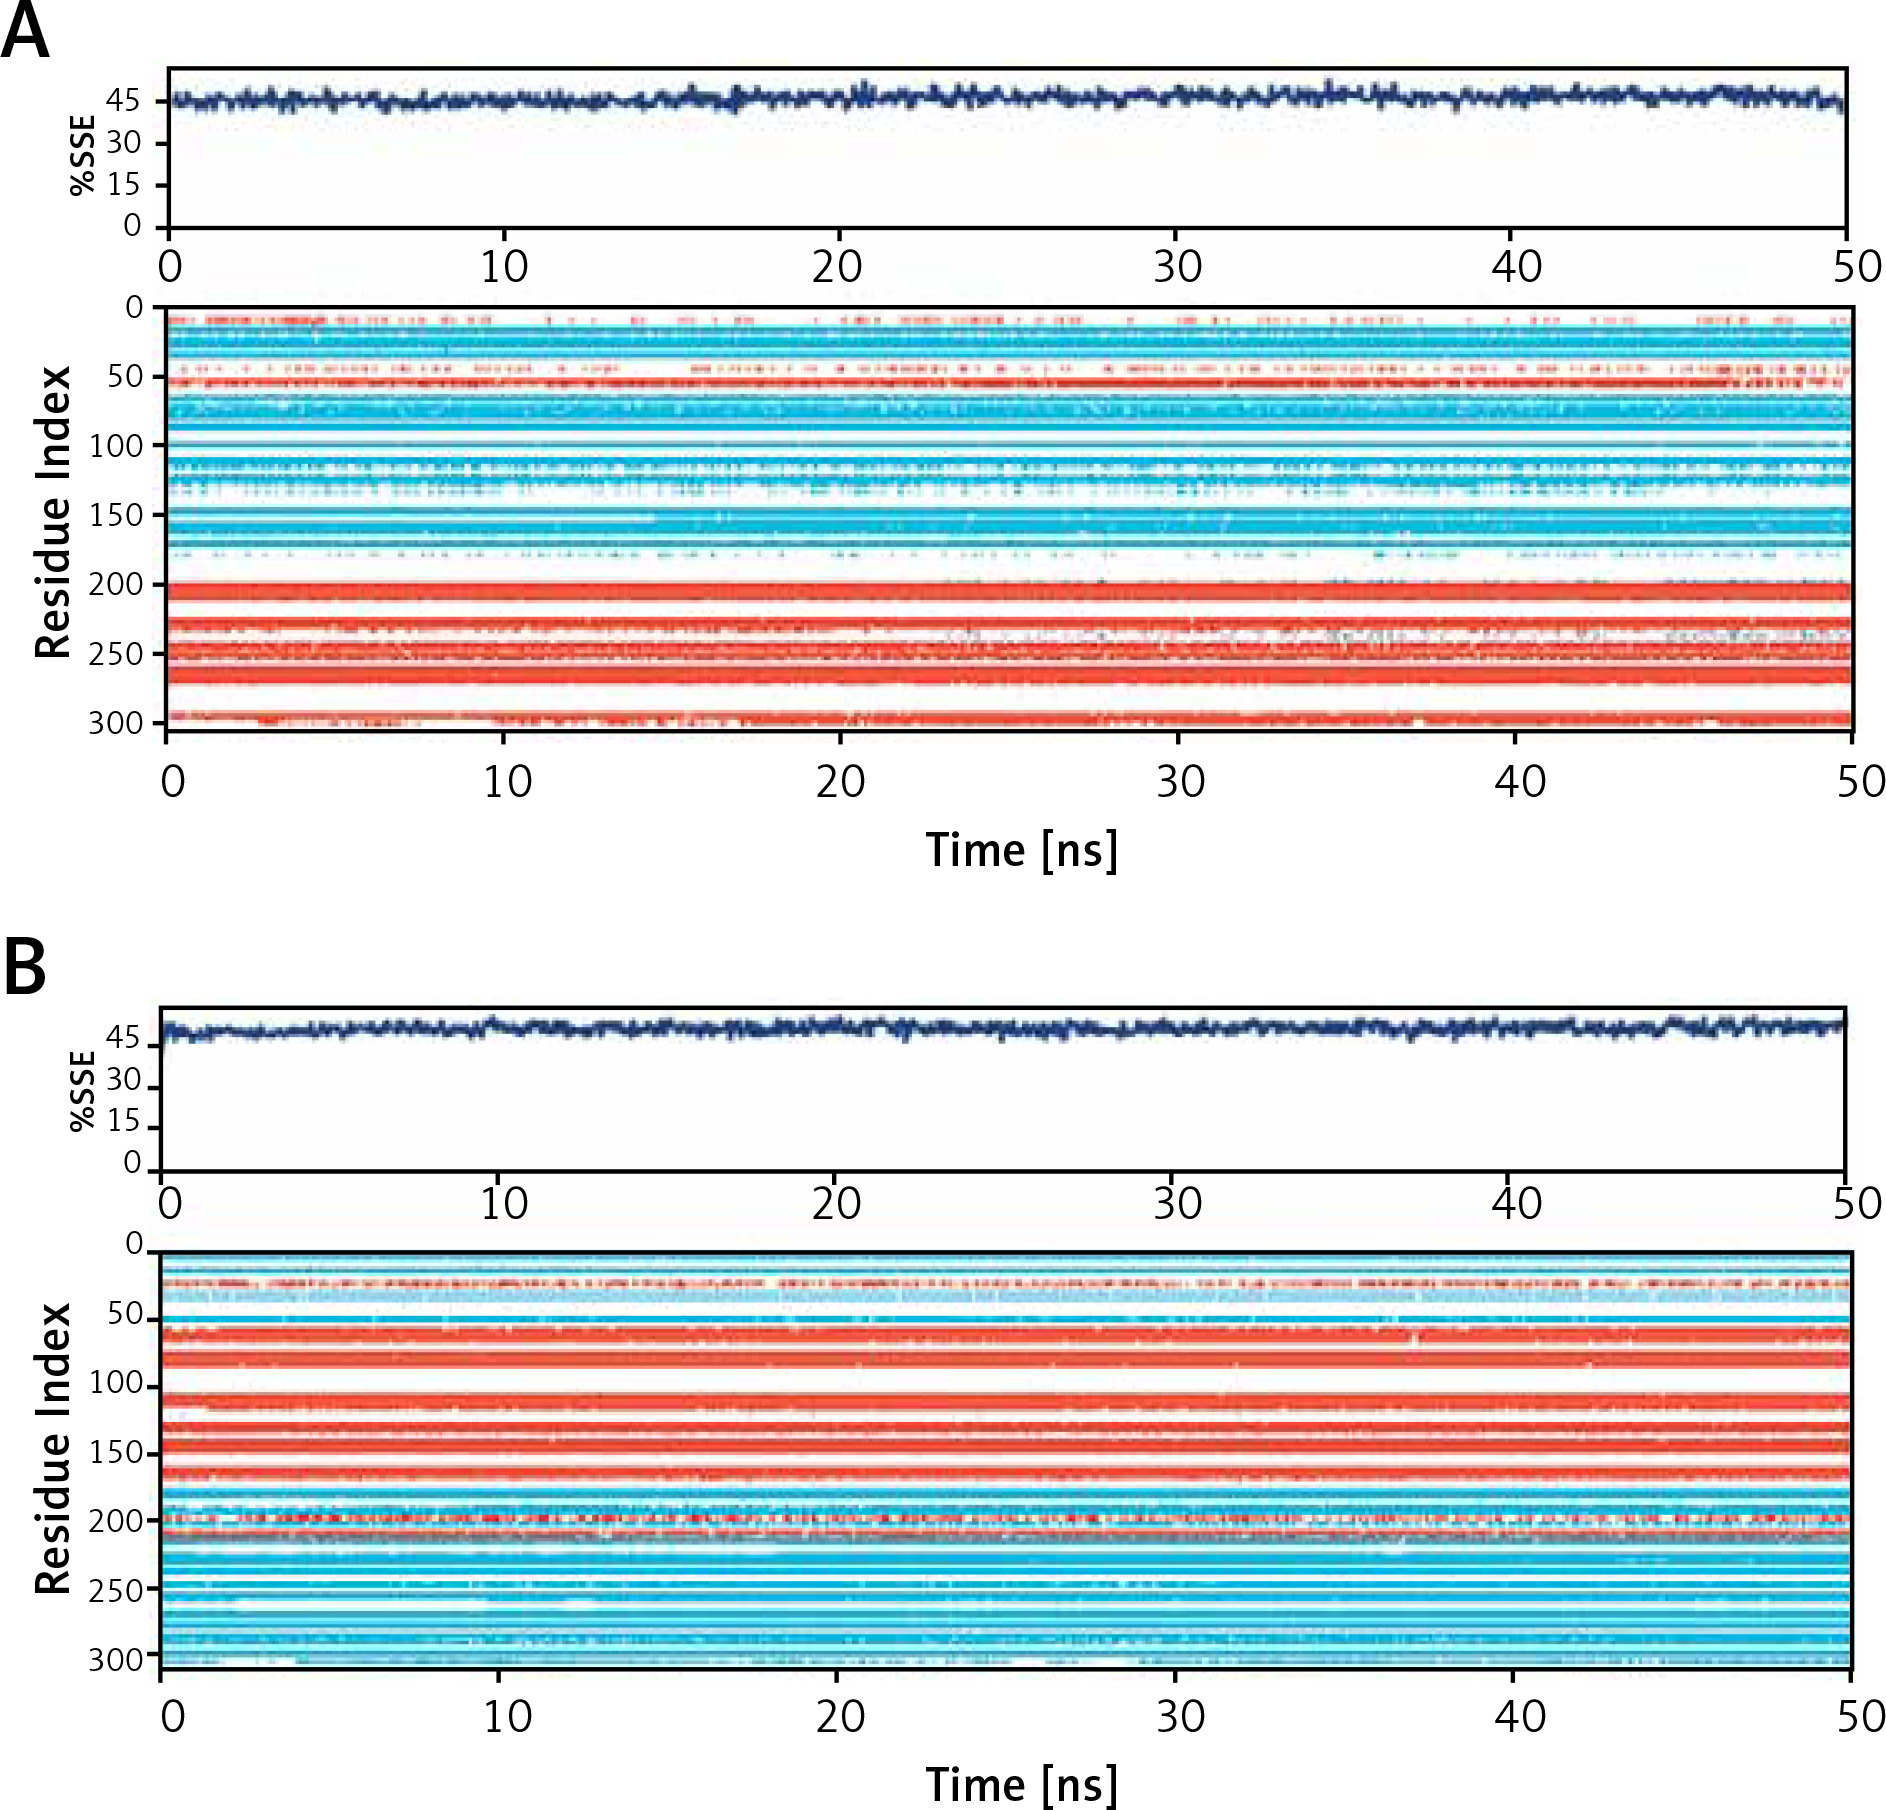
The binding of a ligand to a protein often leads to significant changes in protein’s secondary structure. Here, the changes in the secondary structure elements (SSE) in Mpro and PLpro upon binding their respective inhibitors i.e., Proanthocyanidin and Rhapontin, were monitored throughout the simulation (Figure 5). During MD simulation, the total SSE of Mpro bound with Proanthocyanidin was estimated to be 46% (α-helix = 21% and β-sheets = 25%), which was similar to the X-ray determined SSEs 52% comprising 27% α-helix and 25% β-sheets (Figure 5 A, upper panel). Similarly, the SSEs of PLpro bound with Rhapontin was determined to be 51% (α-helix = 24% and β-sheets = 27%) during MD simulation, which was similar to the X-ray determined SSEs 59% comprising 28% α-helix and 31% β-sheets (Figure 5 B, lower panel). Moreover, the contribution of individual amino acid residues in the formation of SSEs as a function of simulation time is also represented for Mpro (Figure 5 A, lower panel) and PLpro (Figure 5 B, lower panel). The results clearly show that the binding of inhibitors (Proanthocyanidin and Rhapontin) to proteins (Mpro and PLpro) did not significantly alter their SSEs.
Figure 5
Dependence of secondary structure element (SSE) of during simulation. Mpro-proanthocyanidin complex (A), and PLpro-rhapontin complex during simulation (B). Upper panel: Variation in SSE of proteins as a result of their respective inhibitor binding. Lower panel: Contribution of each amino acid residue in the formation of SSEs wherein α-helices are shown in light brown color and β-sheets are represented in teal color
Analysis of radius of gyration (rGyr) and solvent accessible surface area (SASA)
The radius of gyration (Rg) is a critical factor to access the folding state and overall conformation of a protein under different conditions. The rGyr values of Proanthocyanidin and Rhapontin were measures to assess the compactness of ligand bound to their respective proteins Mpro and PLpro as a function of simulation time (Figure 6 A). The rGyr of Mpro showed a consistent behavior throughout the simulation, while there was a small fluctuation in the rGyr of PLpro for the initial 10 ns. In the later part of the simulation (11–50 ns), the ligands’ rGyr was stabilized within acceptable limits. The average values of rGyr for Proanthocyanidin and Rhapontin were calculated as 4.42 and 5.50 Å, respectively.
Figure 6
Dependence of radius of gyration (rGyr) (A) and solvent accessible surface area (SASA) (B) of Mpro-proanthocyanidin and PLpro-rhapontin complexes as a function of simulation time
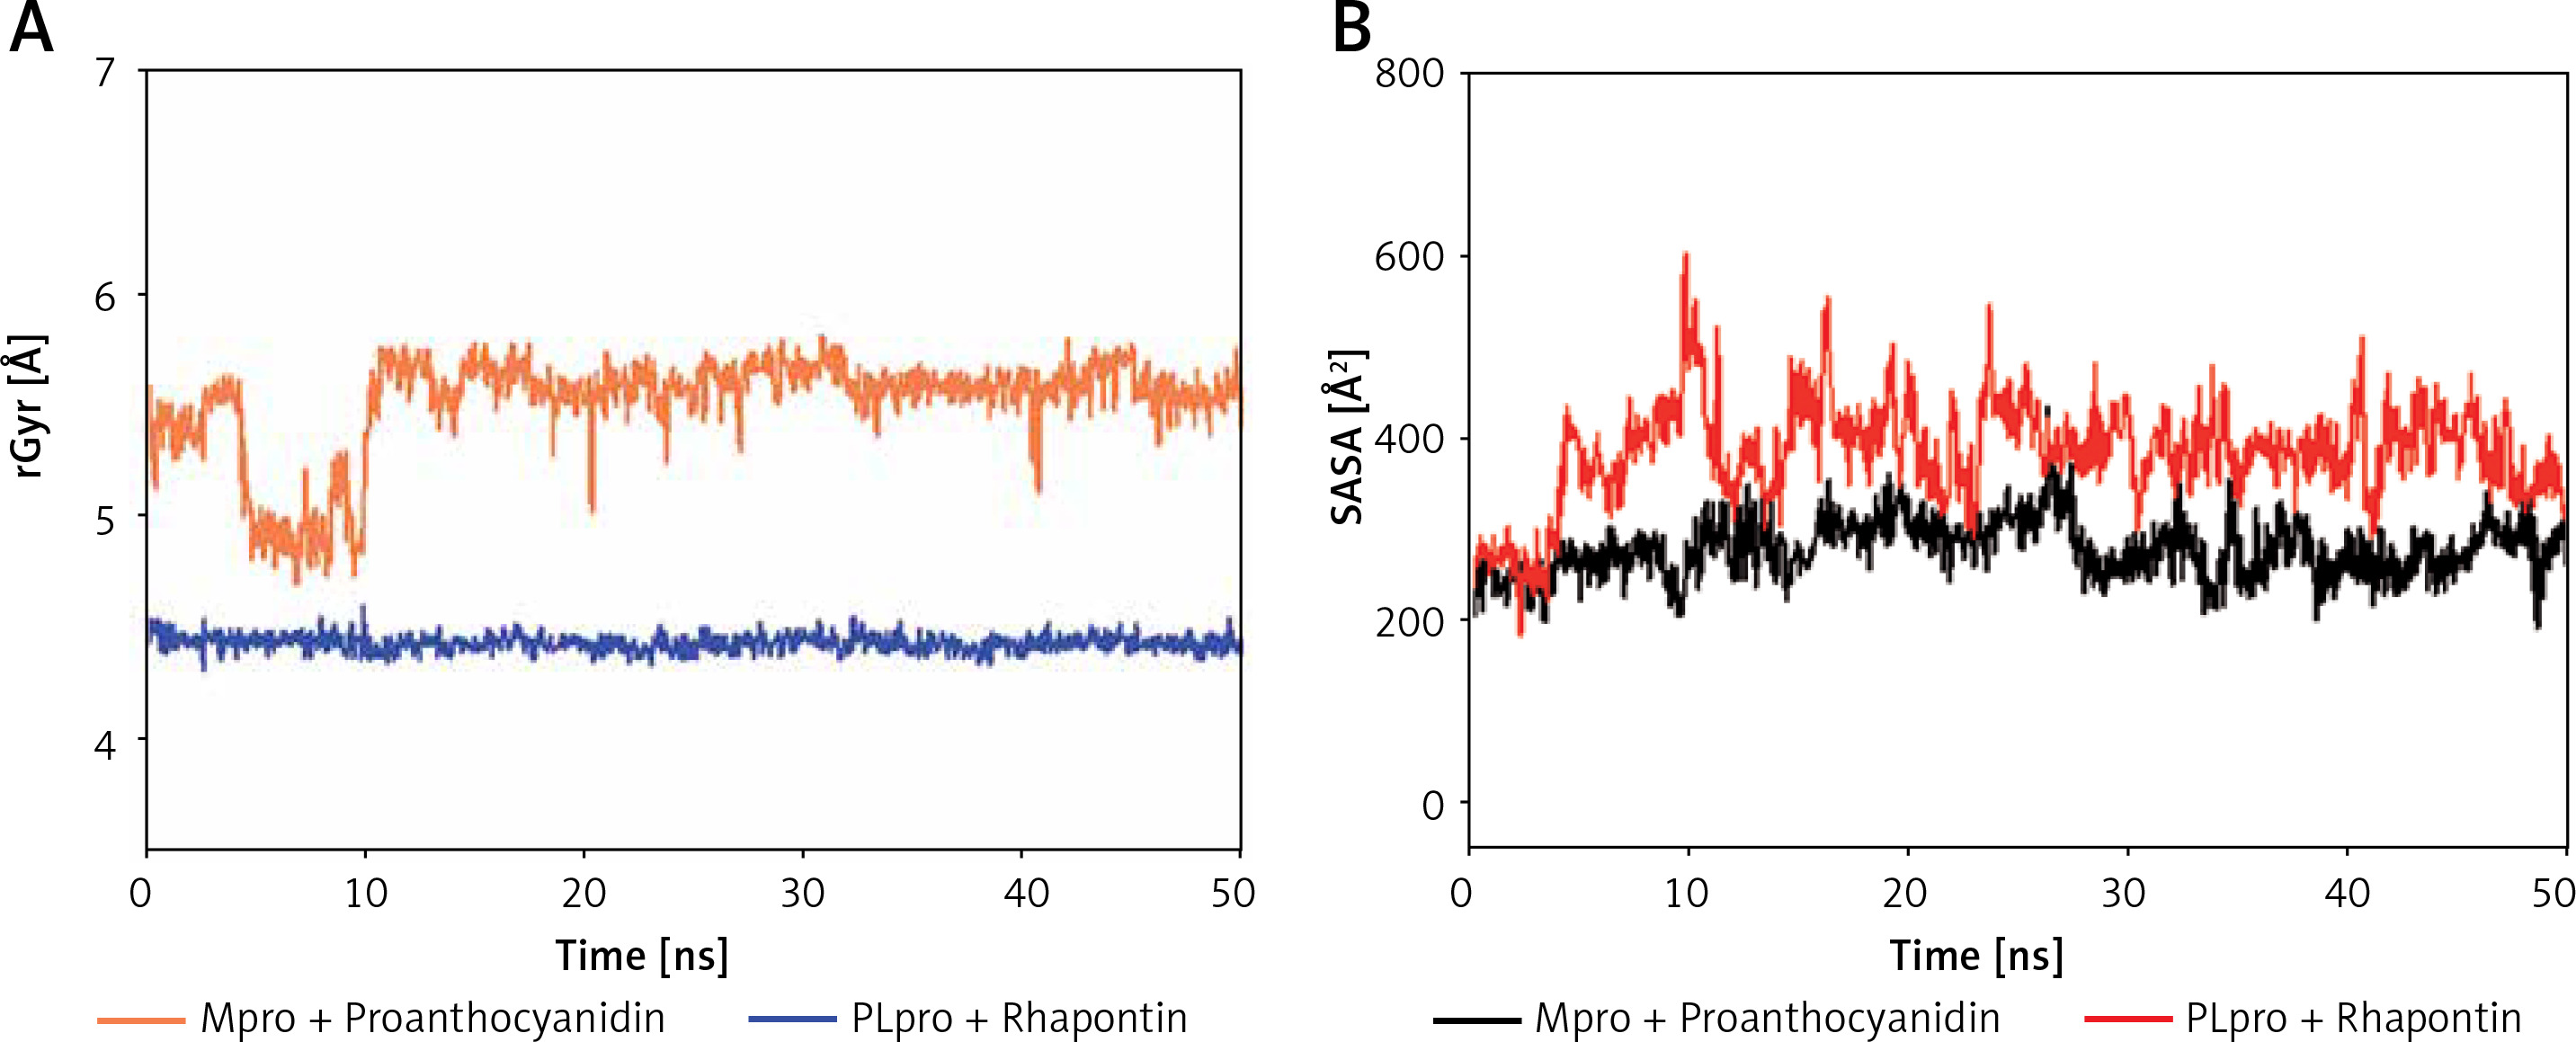
SASA is measured as the volume of protein exposed to the surrounding solvent. SASA of a protein behaves differently in different conditions and thus gives an insight into its conformational behavior. The dependence of SASA as a function of the simulation was evaluated to measure the exposure of Proanthocyanidin and Rhapontin, bound to Mpro and PLpro, respectively, to the solvent (Figure 6 B). SASA of Proanthocyanidin and Rhapontin showed a consistent behavior with fluctuations remained within acceptable limits throughout the simulation time. The average values of SASA of Proanthocyanidin and Rhapontin were estimated as 276.4 and 282.1 Å, respectively. The rGyr and SASA results confirm the stable nature of ligands Proanthocyanidin and Rhapontin bound at the substrate site of their respective proteins Mpro and PLpro.
Investigation of physicochemical and ADMET properties
The physicochemical and ADMET properties of Proanthocyanidin and Rhapontin were determined employing “QikProp (Schrodinger-2018, LLC, NY, USA)” and listed in Table III. The molecular weight of Proanthocyanidin and Rhapontin were within the acceptable range of 150–750 g/mol of a drug-like molecule. Other physicochemical properties such as the number of volume, rotatable bonds, hydrogen bond donor, and hydrogen bond acceptor of Proanthocyanidin and Rhapontin were higher than the acceptable range of an efficient drug-like molecule. The polarizability (QPpolrz), which defines the drug-like properties of any compound, was found to be 54.708 for Proanthocyanidin and 38.114 for Rhapontin (Table III).
Table III
Physicochemical and ADMET (absorption, distribution, metabolism, excretion, and toxicity) properties of proanthocyanidin and rhapontin
[i] Mol_MW – molecular weight, SASA – solvent accessible surface area, FOSA – hydrophobic component of SASA, FISA – hydrophilic component of SASA, PISA – polar component of SASA, WPSA – weakly polar component of SASA, donorHB – hydrogen bond donors, accptHB – hydrogen bond acceptor, QPpolrz – polarizability, QPlogPC16 – hexadecane/gas partition coefficient, QPlogPoct – octanol/gas partition coefficient, QPlogPw – water/gas partition coefficients, QPlogPo/w – octanol/water partition coefficients, QPlogS – solubility, CIQPlogS – conformation-dependent solubility, QPlogHERG – blockage of HERG K+ channels, QPPCaco – CACO permeability, QPlogBB – blood/brain partition coefficient, QPPMDCK – MDCK cell permeability, QPlogKp – skin permeability, QPlogKhsa – binding to human serum albumin.
The ADMET property, such as solvent accessible surface area (SASA) of Proanthocyanidin and Rhapontin, were within the acceptable range of 300–1000. In addition to SASA, the hydrophobic (FOSA) and hydrophilic (FISA), polar (PISA), and weakly polar (WPSA) components of SASA were within limits for Rhapontin. Similarly, Proanthocyanidin obeys the laws of a drug-like substance in terms of FOSA, PISA, and WPSA. The value of FISA for Proanthocyanidin was a little higher than the prescribed limit (Table III). The hexadecane/gas (QPlogPC16), octanol/gas (QPlogPoct), water/gas (QPlogPw), octanol/water (QPlogPo/w) partition coefficients, and solubility (QPlogS), conformation-dependent solubility (CIQPlogS), CACO permeability (QPPCaco), blood/brain partition coefficient (QPlogBB), and skin permeability (QPlogKp) of Rhapontin were within or close to the acceptable limits of a drug-like molecule. The values of blockage of HERG K+ channels (QPlogHERG), MDCK cell permeability (QPPMDCK), and binding to human serum albumin (QPlogKhsa) of Rhapontin were out of the range prescribed for a drug-like molecule.
Similarly, QPlogPC16 and QPlogPoct of Proanthocyanidin were marginally higher than the acceptable limit. The QPlogPw, QPlogPo/w partition coefficients, and solubility (QPlogS) of Proanthocyanidin were within the range of a drug-like molecule (Table III). The values of CIQPlogS, QPlogHERG, QPPCaco, QPlogBB, and QPPMDCK for Proanthocyanidin were not fit into the acceptable range. On the other hand, the values of QPlogKp and QPlogKhsa of Proanthocyanidin were within the prescribed limit of a drug-like molecule. Further, the human oral absorption (%) of Proanthocyanidin was 0, while Rhapontin was 40, a value characteristic of a drug-like molecule (Table III).
Discussion
The ongoing global COVID-19 pandemic has revealed the reality of our preparedness in fighting human coronaviruses. The outbreaks of SARS-CoV in 2003 and MERS in 2012 initiated extensive research in developing drugs against zoonotic coronaviruses, but still, no drugs are available in the market. One of the reasons might be the viral genome’s evolving nature, which limited the progression of initial findings to the clinical stages [29]. The fastest way to tackle this situation is to repurpose drugs available to treat other diseases since their dosages, side effects, and ADMET properties are well known. However, drug-repurposing’s main drawback is the drug’s inability to treat COVID-19 in a targeted manner. Moreover, the repurposed drug may behave in an unpredicted manner in the altered pathophysiological condition of COVID-19 patients. Thus, identifying novel inhibitors of SARS-CoV-2 from natural sources is a viable alternative as they are believed to be less toxic [30, 31].
In this study, we have adopted virtual screening as the principal idea in structure-based virtual screening [32]. In recent studies, Mpro and PLpro of SARS-CoV-2 have been illustrated as the best drug targets due to their significant participation in transcription and replication of virus genes and modulating the host’s innate immune system [33]. Mpro and PLpro have been reported to be indispensable for processing the polyprotein chain of SARS-CoV-2, which is translated from viral RNA [34]. Moreover, the availability of detailed protein structures, knowledge of enzymes’ drug-binding pockets, and conserved nature of these proteins amongst coronaviruses, make them ideal target for drug development purposes. Recently Jin et al. (2020) determined the first crystal structure of Mpro in complex N3 inhibitor to decipher a strategy that may be exploited in a rapid drug discovery endeavor [35]. The 3D structure of Mpro is composed of 306 amino acid residues with three different domains (I–III). The amino acid residues 8–101 encompass domain I, while amino acid residues 102–184 are present in domain II acquiring antiparallel beta structure. Domain III spanning amino acid residues 201–303 comprises five α-helices organized mainly into an antiparallel globular cluster, connected to domain II by an extended loop region (amino acid residues 185–200). The substrate-binding site of Mpro is positioned in between domain 1 and II in a deep pocket, lined with a Cys41-His145 catalytic dyad, as previously reported in Mpro of other coronaviruses [36]. In this study, we performed high-throughput virtual screening against Mpro, leading to the identification of Polymyxin B, Complanatuside, Kaempferol-3-O-glucosrhamanoside, Proanthocyanidin, Typhaneoside, and Amikacin as the most promising natural compounds against Mpro. Prime/MMGBSA of these compounds lead to the identification of Proanthocyanidin as the most potential compound in inhibiting Mpro. Proanthocyanidin interacted with key catalytic residues of Mpro such as His41, and Cys145 along with other prominent residues like Asn142, His163, Glu166, Gln189 and Thr190 of Mpro through hydrogen bonds and hydrophobic interactions. An analysis of Mpro from SARS-CoV (PDB ID: 1UK3) and SARS-CoV-2 (PDB ID: 6LU7) suggests that only 12 out of 306 amino acid residues i.e. 3.9 % differed between SARS-CoV and SARS-CoV-2 (Supplementary Figure S2). Most of the mutations in SARS-CoV-2 are synonymous in nature, and therefore did not affect the overall structure and function of Mpro. Interestingly, the amino acid residues such as Hie41, Asn142, Cys145, His163, Glu166, Gln189 and Thr190 of Mpro interacting with Proanthocyanidin were highly conserved in both SARS-CoV and SARS-CoV-2 (Supplementary Figure S3 A). Recently, Kumar and Roy (2020) have developed a QSAR model against SARS-CoV-2 Mpro to identify potent inhibitors by screening large databases [37]. They identified several features which may enhance the potency of Mpro inhibitors such as the frequency of O-S bond at topological distance 6, number of thiophene rings, compound’s shape and the length of acyclic chain. Conversely, features such as pyridine rings, presence of CH2X2 fragment, number of imides, and the presence of N-O fragment at topological distance 2 were detrimental to Mpro inhibition potential. An analysis of Proanthocyanidin confirmed that it lacks all the features of QSAR model which were detrimental to the inhibition of Mpro. Proanthocyanidins are condensed tannins possessing a plethora of pharmacological and biological properties [38]. In term of chemical composition, Proanthocyanidins are basically oligomeric flavonoids such as oligomers of catechin and epicatechin and their gallic acid esters. They are naturally present in flowers, nuts, fruits, barks, and numerous plants like apples, pine, cinnamon, aronia, cocoa, and grapes. Proanthocyanidins have been reported to possess antiviral, anti-microbial, anticancer, antioxidant, anti-diabetes, immunomodulatory activities in vitro [39]. Most notably, the antiviral activity of proanthocyanidins has been reported against herpes simplex virus-1 (HSV-1) [40], porcine reproductive and respiratory syndrome virus (PRRSV) [41], coxsackie B virus (CBV) [42], canine distemper virus (CDV) [42]. Moreover, Procyanidins have been reported to display moderate inhibition of SARS-CoV infection [43].
The 3D structure of SARS-CoV-2 PLpro resembles a thumb-palm-finger architecture of a right-hand, wherein the active site is located at the interface of palm and thumb subdomains and characterized by the presence of a catalytic triad Cys111-His272-Asp286. During catalysis, Trp106 also plays a significant role in stabilizing the transition-state intermediates [44, 45]. PLpro modulates the host’s innate immune response against the virus through its de-ubiquitin and de-ISGylating activities [46]. The N-terminal end of PLpro has a ubiquitin-like domain (UBL), which recognizes ubiquitin (Ub) and UBL protein ISG15 (Interferon-induced gene 15) tagged proteins with LXGG recognition sequence at their C-terminal end [45, 47, 48]. In this study, we have identified Rhapontin, Secoisolariciresinol diglucoside, Eriocitrin, Sophoricoside, Nadide, and (+)-Catechin as the most promising candidate natural compounds against PLpro. Prime/MMGBSA analysis led to the identification of Rhapontin as the most potential inhibitor of PLpro. Rhapontin interacted with the catalytic residues such as His272, and Asp286 of PLpro, along with Cys111 through hydrogen bonds, hydrophobic and van der Waals’ interactions. An analysis of PLpro from SARS-CoV (PDB ID: 2FE8) and SARS-CoV-2 (PDB ID: 6W9C) suggests that only 54 out of 316 amino acid residues i.e. 17.2 % differed between SARS-CoV and SARS-CoV-2 (Supplementary Figure S4). Most of the mutations in SARS-CoV-2 are synonymous in nature, and therefore did not affect the overall structure and function of PLpro. It is worth to note that, the amino acid residues such as Trp106, Gly271, Hie272 and Asp286 of PLpro forming hydrogen bonds and hydrophobic interactions with Rhapontin were highly conserved in both SARS-CoV and SARS-CoV-2 (Supplementary Figure S3 B). Previously, a QSAR model of PLpro inhibitor has been reported by Amin et al. (2020), wherein they showed that an active inhibitor of PLpro contains an aromatic ring and electronegative atoms [49]. Rhapontin fulfilled the criteria of QSAR model and emerged as a potent inhibitor of PLpro. Rhapontin or rhaponticin is a stilbene-type glycoside abundantly found in medicinal plants of the Rheum genus (Polygonaceae). Rhapontigenin, the aglycone form of rhapontin, is the biologically active form displaying various activities such as antioxidant, anti-fungal, anti-thrombotic, anti-inflammatory effect and anti-proliferative activity [50].
Further, the stability of protein-inhibitor complexes was evaluated by performing MD simulation. MD simulation is a primary tool in computational chemistry to get comprehensive information on the fluctuations and conformational changes of proteins and ligands in a time-dependent manner [51]. The parameters such as RMSD, RMSF, Rg, and SASA indicates that the Mpro-Proanthocyanidin, and PLpro-Rhapontin complexes are stable in nature [52–54]. In addition, in silico methods have been established for the prediction of drug-likeness properties of any compound under computer-aided discovery. A high-quality drug candidate should possess appropriate efficacy against target proteins and display good ADMET properties [55]. ADMET analysis also proves that Proanthocyanidin and Rhapontin possess all the qualities of a potent drug molecule.
In conclusion, in the present study, a natural compound library (L1400, available at Selleck Inc.) has been screened virtually, targeting Mpro and PLpro proteases of SARS-CoV-2. On the basis of molecular docking and free energy calculations, Proanthocyanidin and Rhapontin are identified as the most effective inhibitors of Mpro and PLpro, respectively. The stability and dynamics of Mpro-Proanthocyanidin and PLpro-Rhapontin complexes have been established by performing molecular dynamics simulation. Moreover, the physicochemical and ADMET properties of Proanthocyanidin and Rhapontin revealed that Rhapontin has almost all the properties of a drug-like molecule, while Proanthocyanidin could serve as a scaffold for the development of a potent drug molecule. The compounds identified here could potentially inhibit viral proteases, however, they are not approved drugs for treating any disease. The limitation of this study is that it is a purely computational study and does not include any data on the functional validation of docking results in vitro or in vivo. Thus, the results of this study require in vitro, ex vivo and in vivo validation for the tested natural compounds (Proanthocyanidin and Rhapontin) before clinical usage.