Introduction
Heart failure (HF), caused by the insufficient supply of oxygenated blood to the heart and thereby resulting in hypertrophied heart without normal functions, is a major cause of death in the world, especially in an aging population [1]. Multiple complications such as myocardial infarction [2] are presented in the setting of HF, with the number of affected subjects reaching more than 40 million globally [3]. Many novel drugs and new treatment methods for HF have been studied and applied in clinical treatment [4, 5]. Early detection of HF is critical for the management of this debilitating disease [6], but the involved molecular mechanisms are not completely understood and biomarkers for early diagnosis remain controversial.
In 2014, Oka et al. [7] elaborated on the pathology and molecular mechanisms of HF: angiogenesis increased the endothelium-derived NO release, resulting in degradation of regulator of G-protein signalling 4 (RGS4), and activated the PI3Kγ/Akt/mTORC1 (phosphatidylinositol 3-kinase/Akt/mammalian target of rapamycin C1) pathway, which finally induced myocardial hypertrophy. Then, hypertrophic responses inversely induced myocardial angiogenesis by overexpressed vascular endothelial growth factors (VEGFs) and by inhibition of the PI3Kγ/Akt/mTORC1 pathway. Also, there is obvious accumulation of p53 in hypertrophied myocardium of HF [7–9]. Biochemical markers that have been validated and are usually used in diagnosis and prognosis of HF mainly contain B-type natriuretic peptide and N-terminal pro-B-type natriuretic peptide [10–12]. In addition, single nucleotide polymorphisms (SNPs) have been reported to be significantly correlated with HF [13, 14]. Despite intensive study in HF pathogenesis and therapies, the incidence and recurrence rate remain high, resulting in physical suffering and economic costs [15].
In the present study, using the microarray GSE76701 datasets, differentially expressed genes (DEGs) were firstly identified. Then, via construction of the enrichment analysis, protein-protein interaction (PPI) network, and drug-mRNA-miRNA interaction network, the analysis of mRNA profiles allowed us to better understand the effect of DEGs and related miRNA on the potential pathogenesis of HF.
Material and methods
Data sources and preprocessing
Gene profiles of GSE76701 [16] were obtained from the National Centre of Biotechnology Information (NCBI) Gene Expression Omnibus database (GEO). GSE76701 was processed on Affymetrix Human Genome U133 Plus 2.0 Array (GPL570). GSE76701 contained 4 HF and 4 normal controls, and the mRNA was isolated from left ventricular tissue for microarray analysis.
For preprocessing, text files (.txt) from GSE76701 were collected, and probe IDs were converted to gene symbols according to the annotation file. When multiple probes matched the same gene symbol, the average value of the probes was taken as the gene expression level. Unmatched probes were excluded from this study.
Screening of differentially expressed genes
For DEGs between HF and control, the p-value and logarithmic fold change (log2FC) were calculated using a freely available limma package (http://bioconductor.org/packages/release/bioc/html/limma.html, version 3.26.9) [17]. DEGs were determined by the threshold of p-value < 0.05 and |log2FC| > 0.585.
Bidirectional hierarchical clustering analysis of differentially expressed genes
Hierarchical clustering is usually used to discover the closest associations that exist between gene profiles and samples [18]. Generally, even in the same tissue, there are significant differences in gene profiles between disease states and normal. To analyse whether these DEGs would segregate the samples into 2 distinct clusters, bidirectional hierarchical clustering was conducted by ‘pheatmap’ package (version 1.0.8) using Euclidian distance function [19].
Enrichment analyses of differentially expressed genes
Based on the Cytoscape plug-in ClueGO + CluePedia [PMID: 19237447], the target protein was analysed for GO function [PMID: 10802651], and the GO biological process with significance threshold was set to P.adjust ≤ 0.01 was selected. Then, Cytoscape was used for a functional network map construction of the target protein.
Pathway enrichment analysis was applied by clusterProfiler in R package (version 3.2.11). In this study, Fisher’s exact test was adopted to evaluate important pathways based on the Kyoto Encyclopedia of Genes and Genomes (KEGG) [20, 21]. Pathways with a p-value less than 0.01 were determined to be statistically significant.
Protein-protein interaction network and module analysis
In order to analyse the interaction between DEG-related proteins, the Search Tool for the Retrieval of Interacting Genes (STRING) database (version 10.0, http://www.string-db.org/) was used to obtain the PPI relationships [22]. The relationships whose required confidence (combined score) was greater than 0.4 were selected to build the network using Cytoscape software. Topological features such as degree centrality (DC), betweenness centrality (BC), and closeness centrality (CC) were further analysed using a CytoNCA plugin (version 2.1.6) [23]. According to the score ranking of nodes, important proteins (hub protein) were identified [24]. Taking into account the fact that the resulting network was too large, the MCODE plugin (version 1.4.1) was applied to analyse the subnetwork of the PPI network [25]. Subnetworks with scores higher than 5 based on the default threshold (Degree Cutoff: 2, Node Score Cutoff: 0.2, K-Core: 2, Max. Depth: 100) were retained for further analysis. Genes with the most links with other genes were considered to be the hub genes [26], while we used a cut-off degree value range of 25–30, and combined top 5–10 ranking was used as the criteria to identify these hub genes according to previous description [27].
Target miRNA of the differentially expressed genes
The miRWalk 2.0 database was applied to acquire all the target miRNAs of DEGs [28]. Then, 7 databases (miRWalk, RNA22, miRanda, Targetscan, miRDB, miRMap, and miRBridge) were added to assist in predicting interactions between DEGs and miRNAs. According to the miRWalk 2.0 database, miRNAs that appeared in at least 7 databases were chosen as the target miRNAs. Finally, the intersection of DEGs and related miRNA was taken to obtain the miRNA-mRNA regulatory relationship pairs. Based on the DEG and related miRNA, enrichment analysis was performed by clusterProfiler package.
Drug-gene interaction prediction
Potential drugs targeting key DEGs confirmed by network module analysis were searched using the drug-gene interaction database (DGIdb, http://dgidb.genome.wustl.edu/) [29] with the following values: Preset Filter: FDA Approved + Antineoplastic; Advanced Filters: Source Databases: FDA and DrugBank; Gene categories: All; Interaction Types: All. All the drug-gene relationship pairs related to the predicted gene, and the regulatory miRNAs were employed to construct an miRNA-gene-drug regulatory network map using Cytoscape network construction software (version: 3.2.0, http://www.cytoscape.org/).
Results
Identification of differentially expressed genes
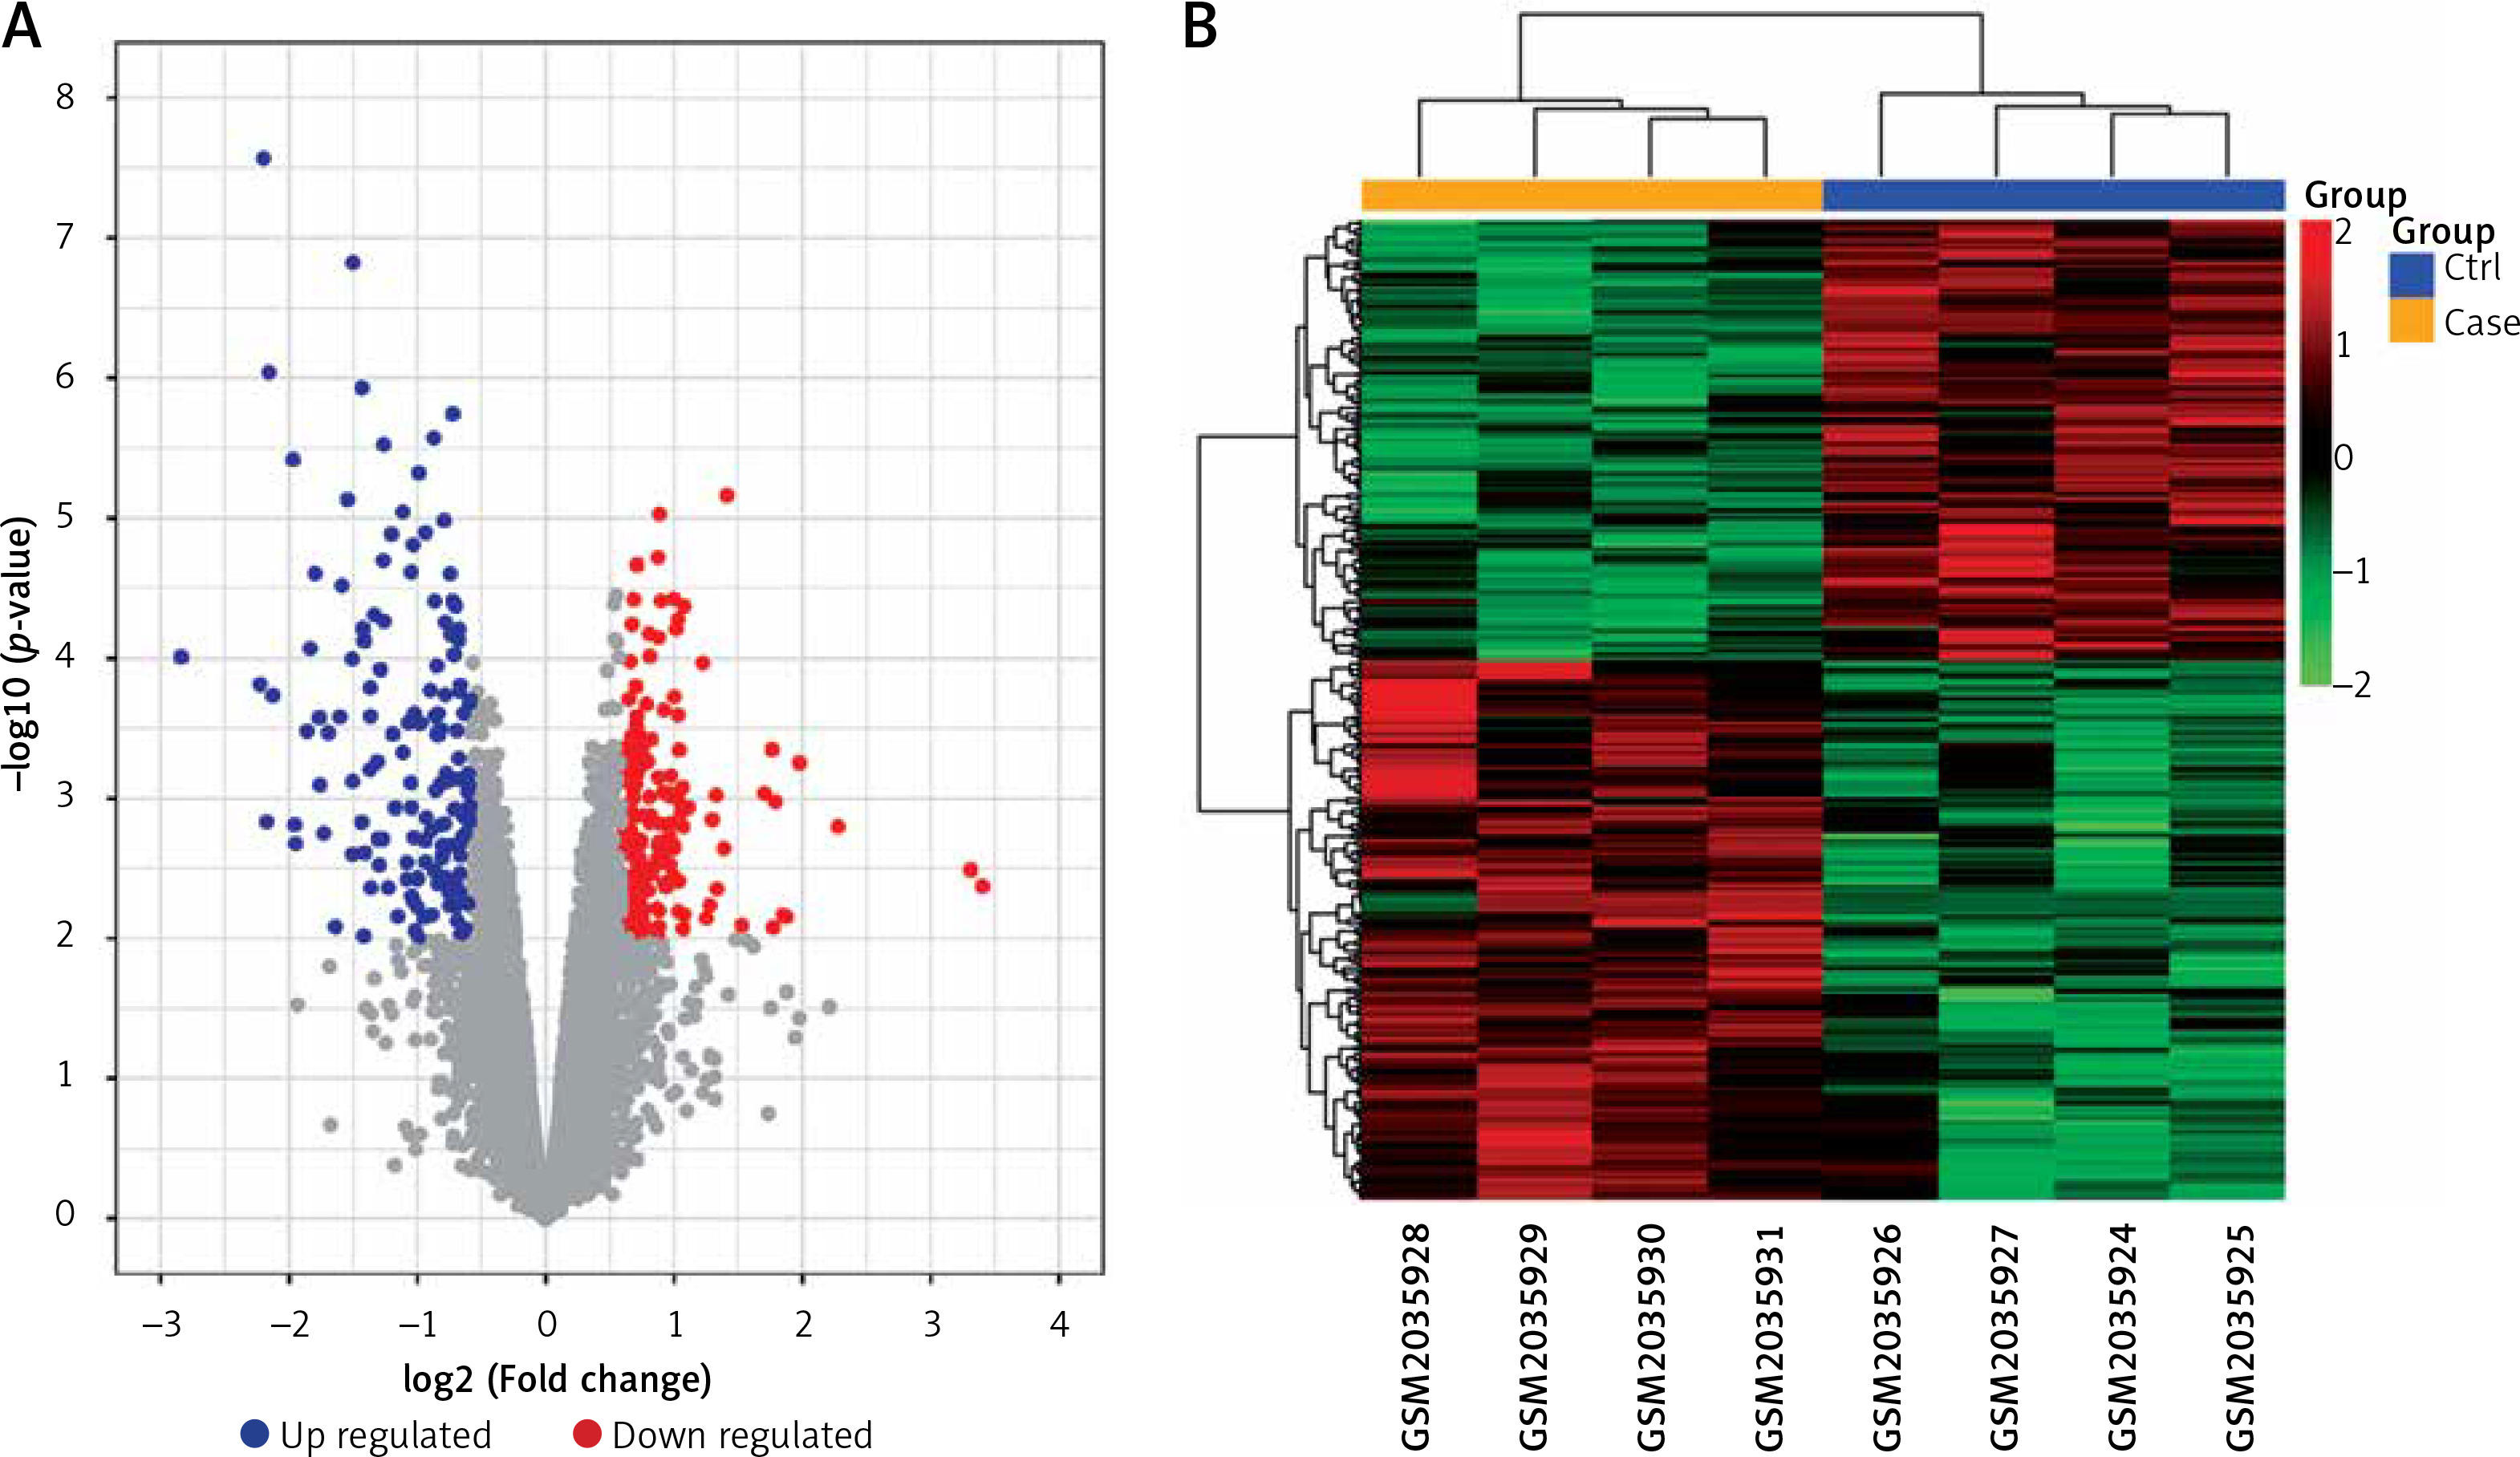
After normalising the raw data and transforming the probe ID to gene symbol, 21,655 mRNAs were obtained for GSE76701. DEGs were determined with the threshold of p-value and |log2FC|. There were 489 DEGs in GSE76701, including 271 up- and 218 down-regulated genes. Volcano plots show the distribution of the 489 genes in Figure 1 A.
Figure 1
Volcano plot (A) and Heatmap (B) of DEGs between control and heart failure (HF) samples. A – exhibit the DEGs. X-axis: log2FC; Y-axis: the log-transformed p-values. A total of 489 differential mRNAs were divided in to 271 up(red)- and 218 down(blue) regulated mRNAs in GSE76701. B – column on the top of the heatmap represents, respectively, the HF group (yellow) and the control group (blue). Upregulated and downregulated genes were respectively marked in green and red
Bidirectional hierarchical clustering analysis
Based on the DEGs, bidirectional hierarchical clustering analysis was conducted. As shown in cluster heat maps (Figure 1 B), there are distinctive expressed change patterns in the HF and normal. DEGs further segregated the samples into 2 distinct groups.
Functional enrichment analysis of differentially expressed genes
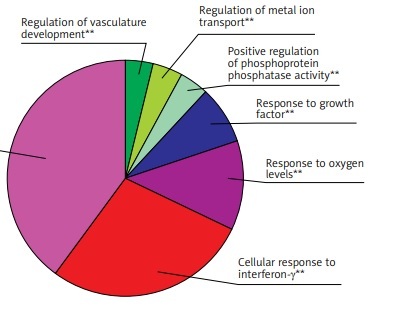
GO function enrichment analysis was performed to elucidate the functions of the differential mRNA. The 271 up-regulated mRNAs were subjected to ClueGO analysis, and a total of 25 GO terms were enriched (Figure 2 A), while the pie graph shows 7 categories of functional enrichment according to the Kappa coefficient (Figure 2 B).
Figure 2
Functional enrichment analysis of upregulated DEGs. A – X-axis represents the percentage of enriched genes among the functional term-related genes, and the Y-axis gives the name of the GO term and is consistent with the pie graph. The number on the right side of the bar shows the number of related genes enriched in the relevant GO function term in the list of uploaded genes. * represents a p-value between 0.01 and 0.05, while ** represents p < 0.01. B – Functionally enriched pie graph, which represents the ratio of 3 groups of GO function. C – ClueGO Functional Network Diagram of upregulated DEGs. The dot is a GO function term. The larger the p-value, the larger the size of the dot. The 2-point connection represents the correlation between the functions, and the larger the kappa coefficient, the thicker the line. Multicolour dots represent multiple GO functions
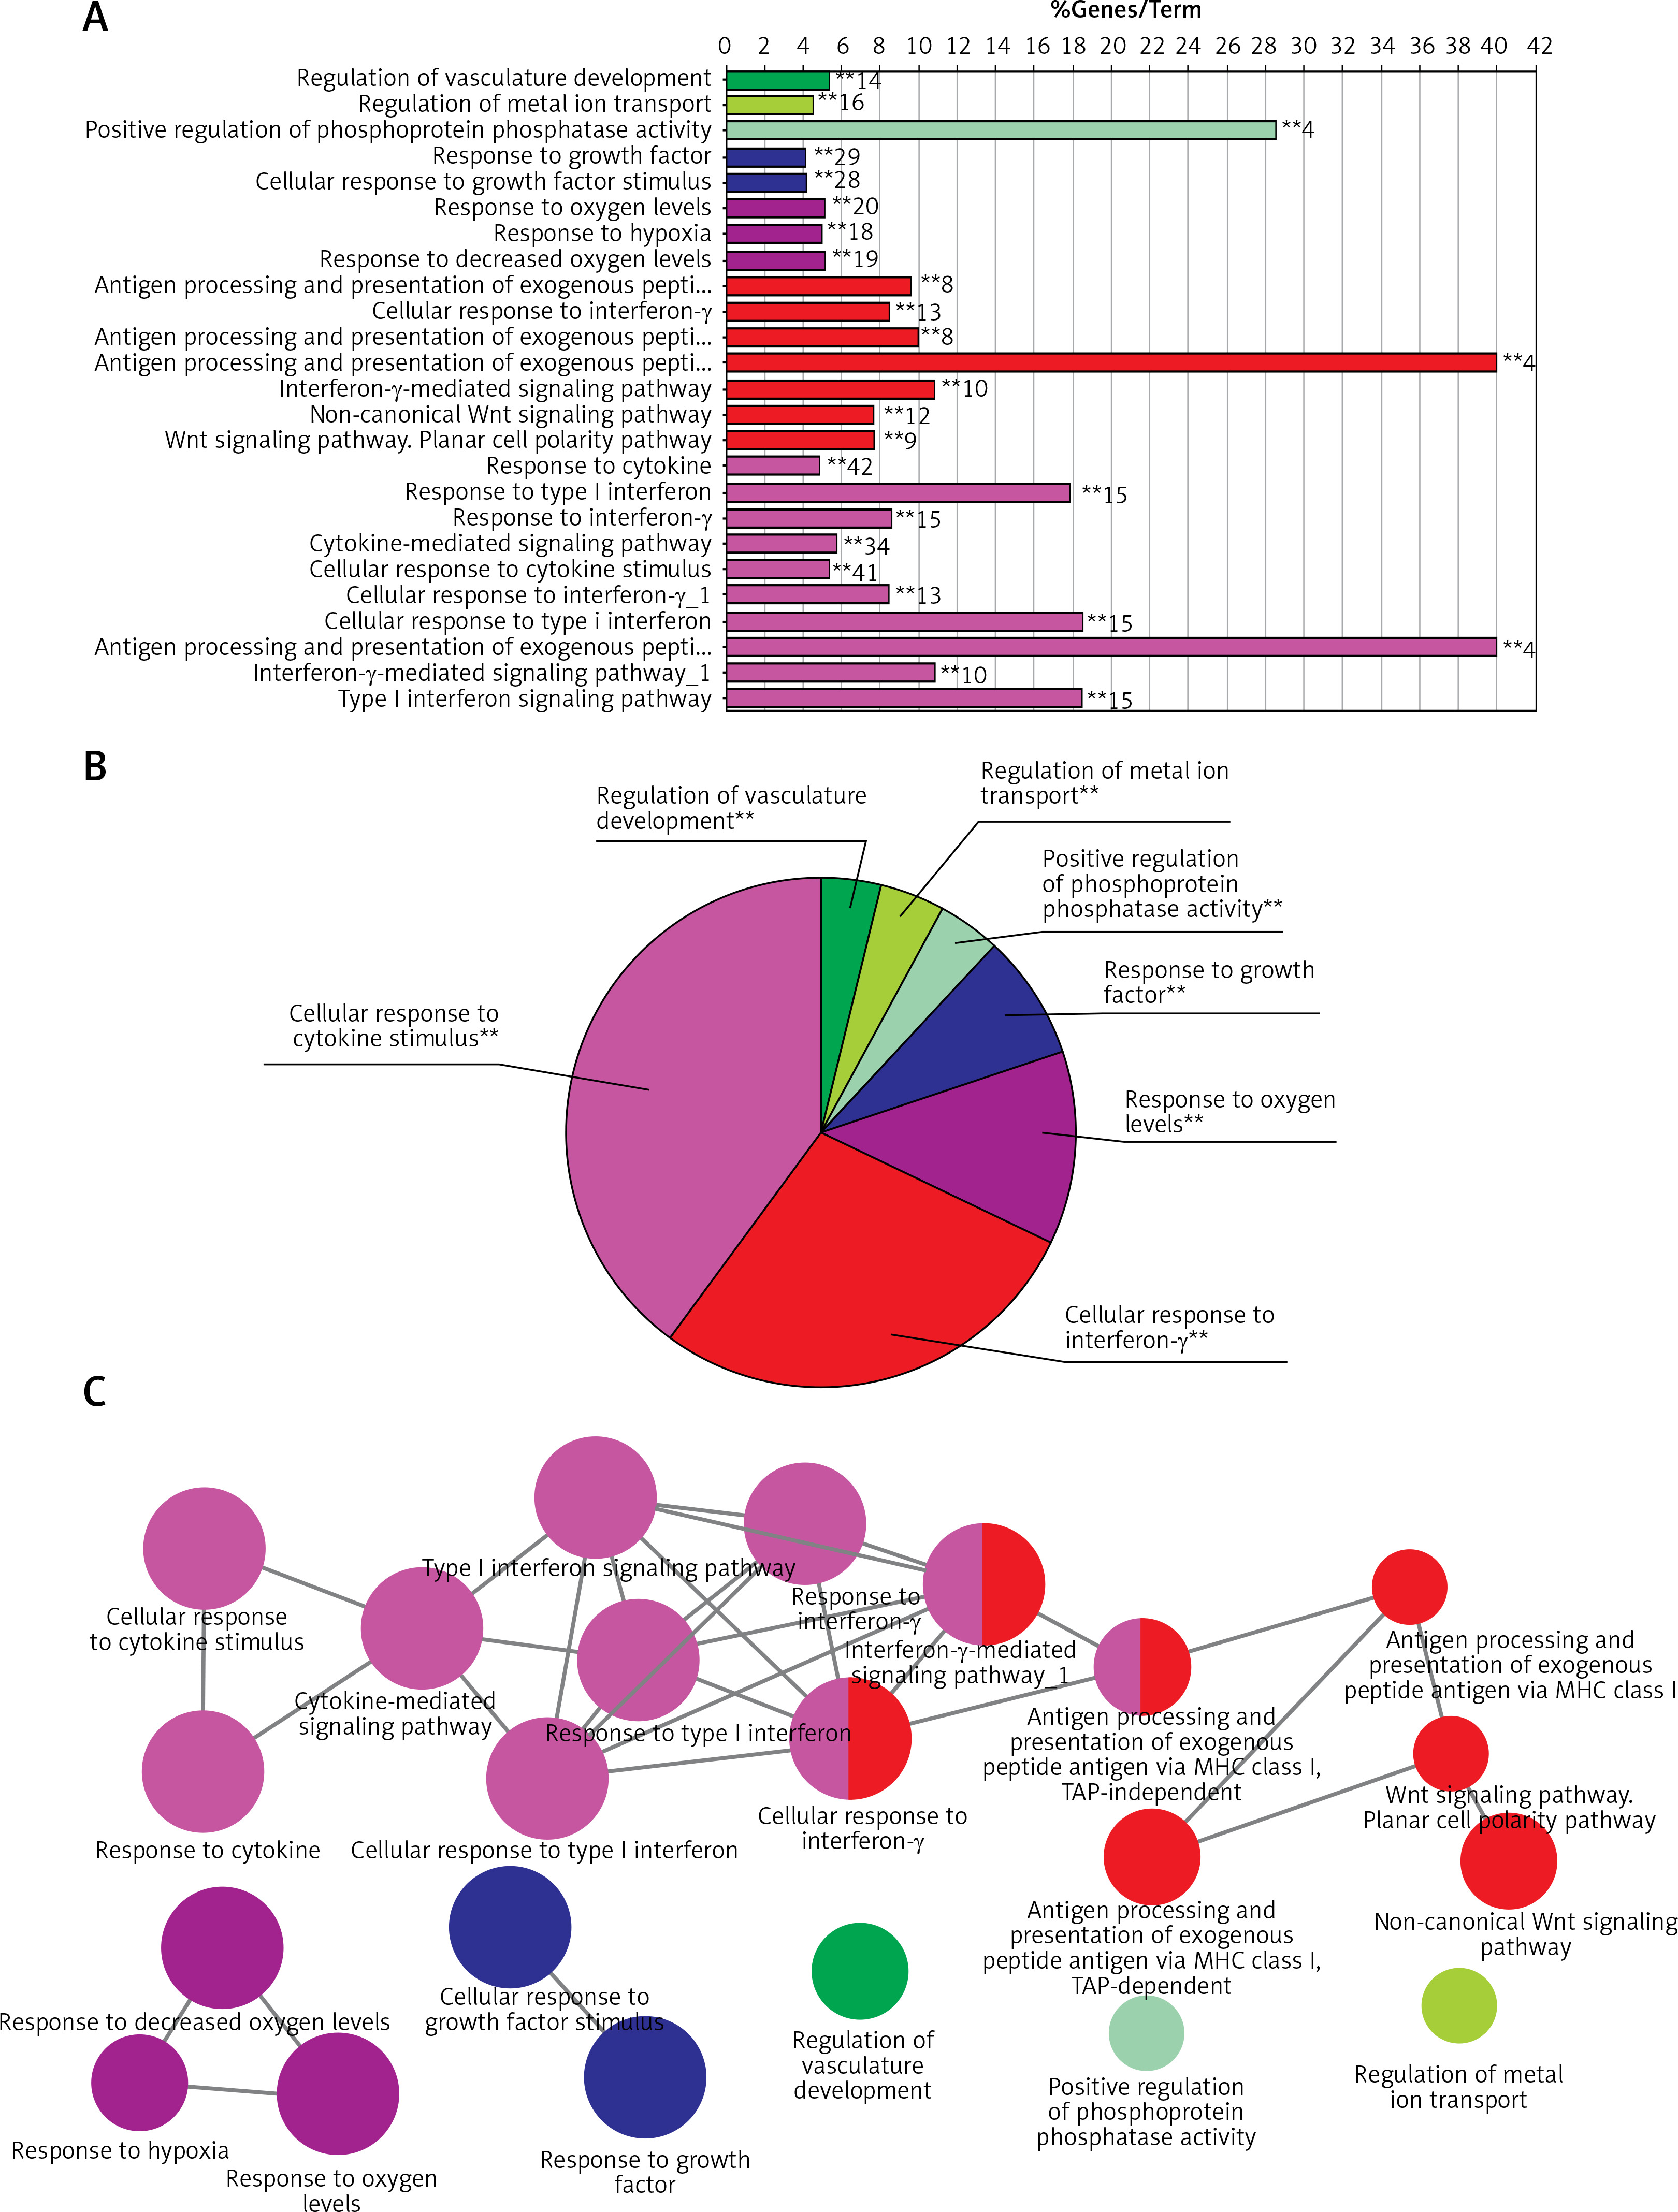
The GO functional network diagram of upregulated genes is also shown (Figure 2 C). The 85 genes of the functional network were co-enriched in 25 significant GO functional terms. The seven main function terms include cytokine stimulated response, cell response to interferon γ, response to oxygen levels, growth factor response, vascular system development regulation, positive regulation of phosphoprotein phosphatase activity, and metal ion transport regulation.
The 218 downregulated mRNAs were also subjected to clueGO analysis, and a total of 3 GO terms were enriched (Figure 3 A), while the pie graph shows 2 categories of functional enrichment according to the Kappa coefficient (Figure 3 B).
Figure 3
Functional enrichment analysis of downregulated DEGs from GSE76701. A – Downregulated DEGs between HF and control were functionally classified via GO analysis. X-axis represents the percentage of enriched genes among the functional term-related genes, and the Y-axis gives the name of the GO term and is consistent with the pie graph. The number on the right side of the bar is the number of related genes enriched in the relevant GO function term in the list of uploaded genes. * represents a p-value between 0.01 and 0.05, while ** represents p < 0.01. B – Functionally enriched pie graph, which represents the ratio of 2 groups of GO function. C – ClueGO Functional Network Diagram of downregulated genes. Red label corresponding to the dot is the enriched differential gene. The dot is a GO function term. The larger the p-value, the larger the size of the dot. The 2-point connection represents the correlation between the functions, and the larger the k coefficient, the thicker the line. Multicolour dots represent multiple GO functions
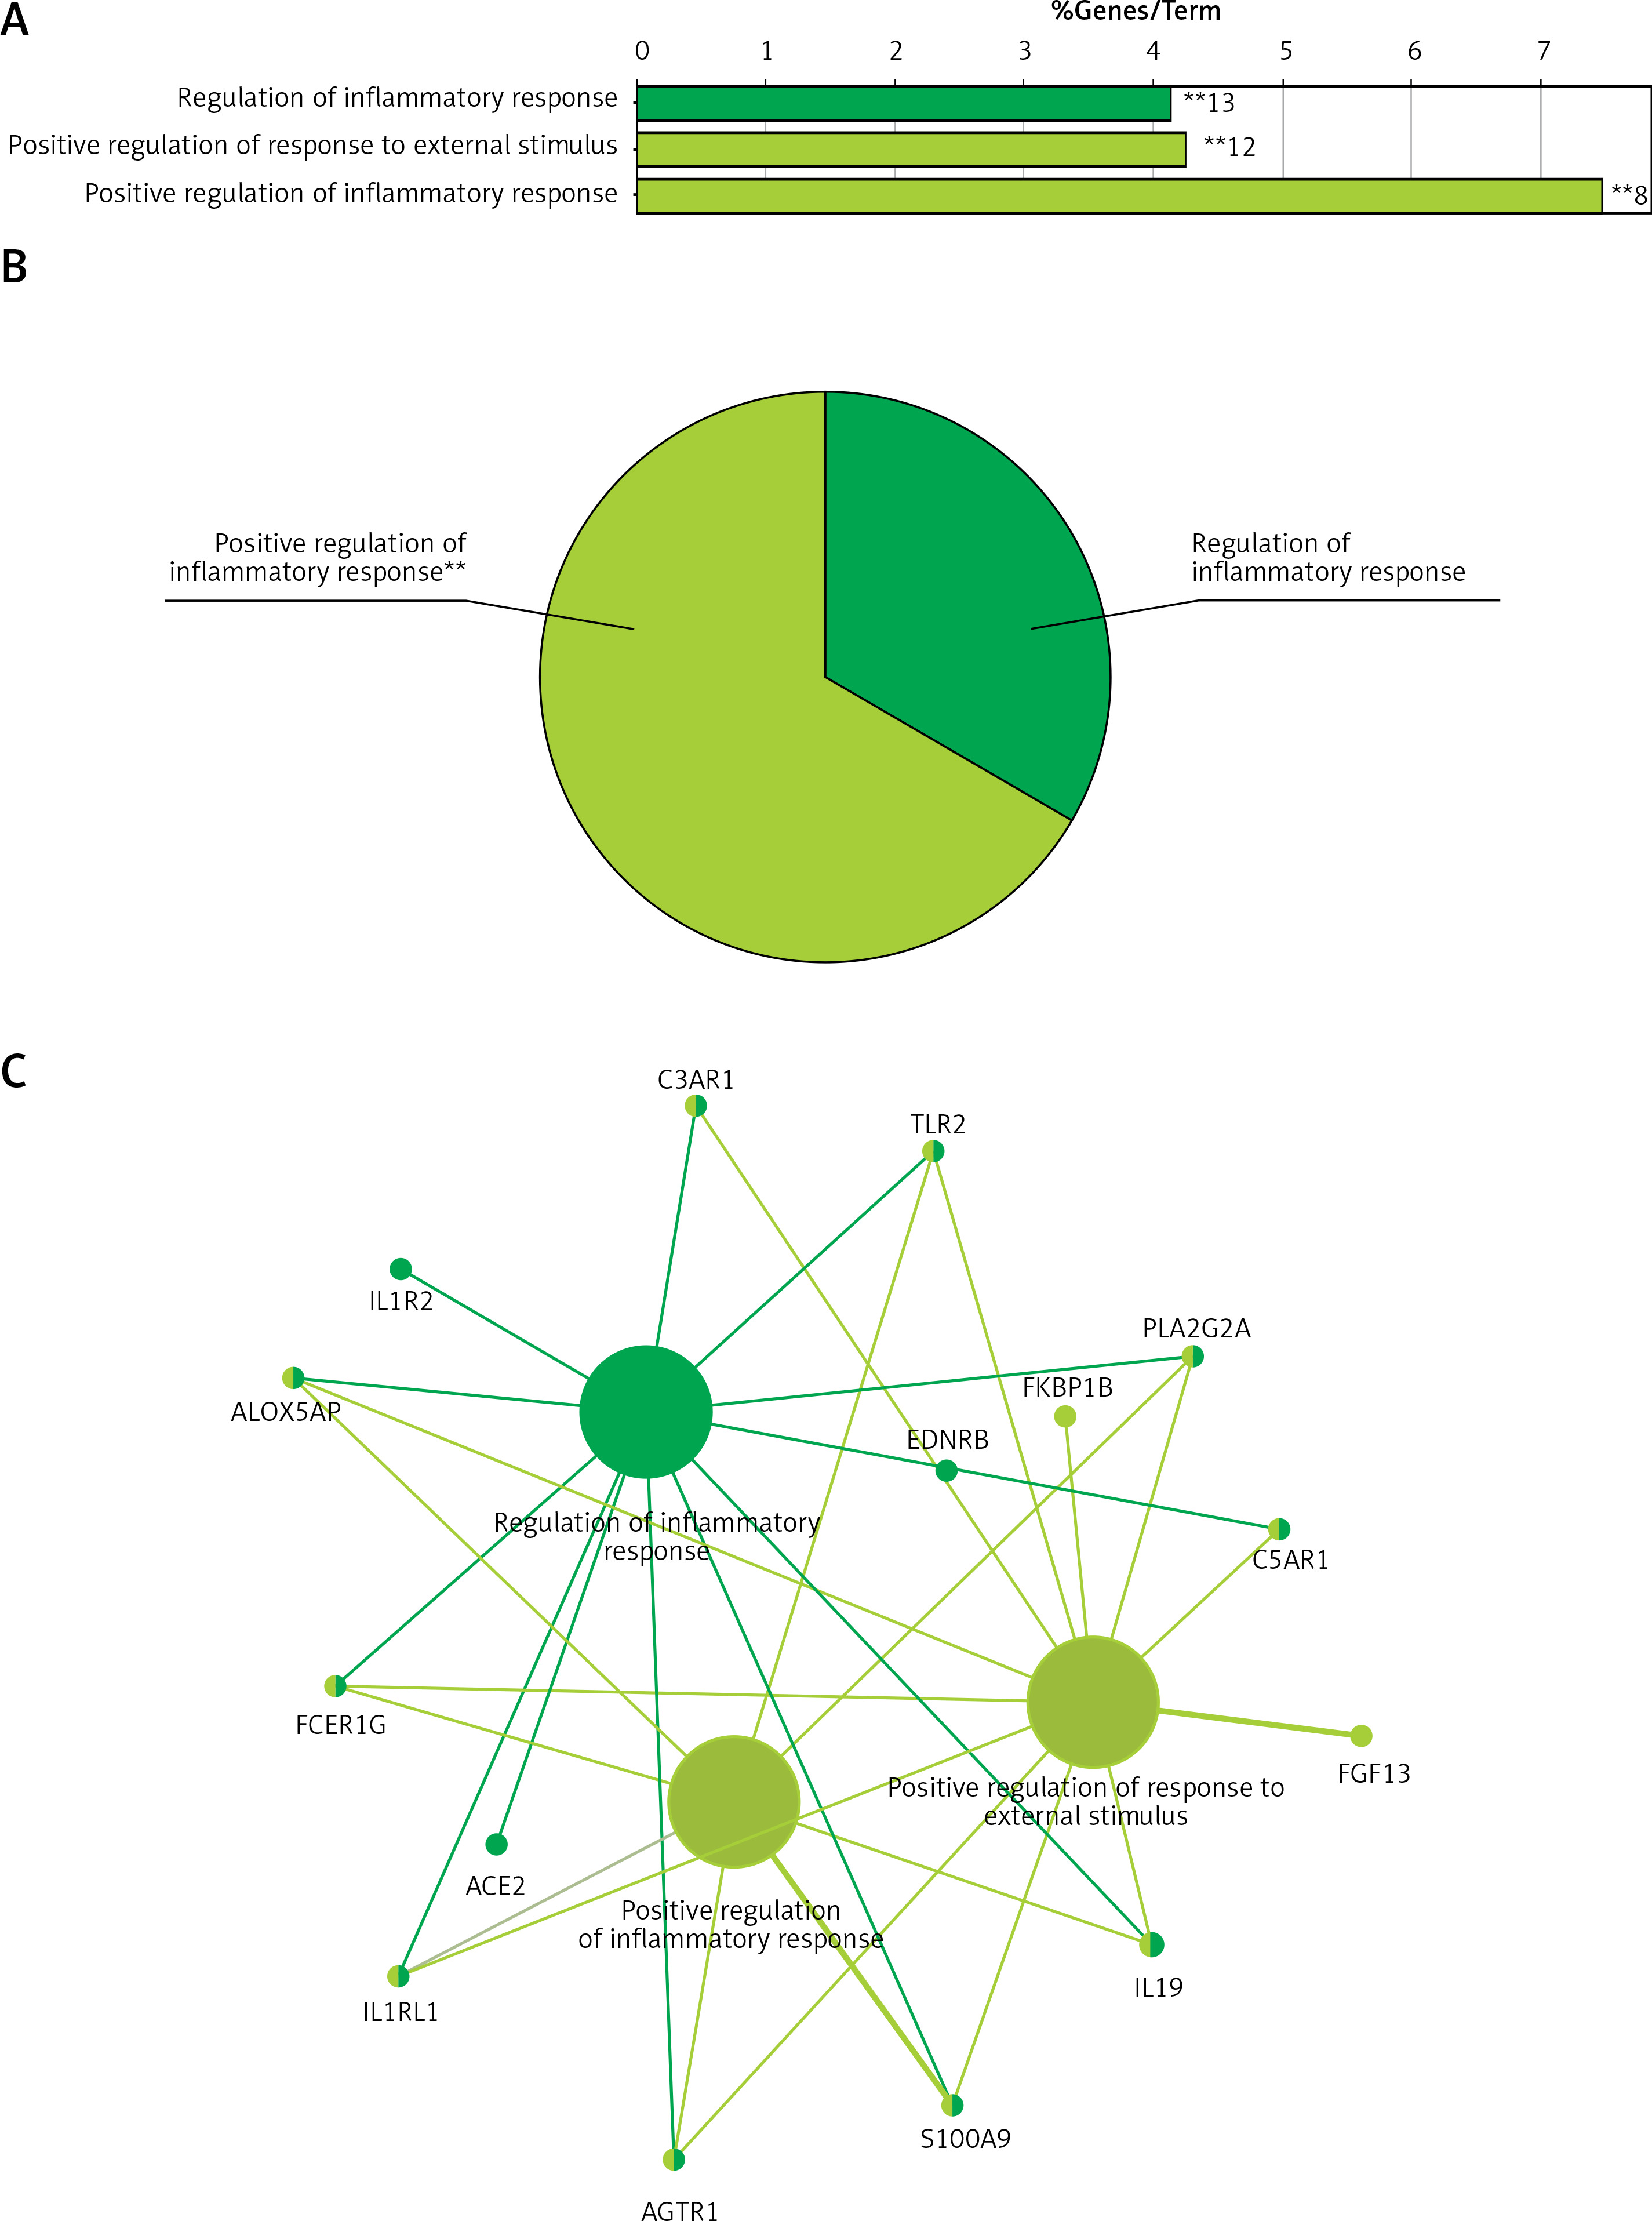
The GO functional network diagram of upregulated genes is also shown (Figure 3 C). The 15 genes of the functional network were co-enriched in 3 significant GO functional terms. The two main function terms include the regulation of inflammatory response and the positive regulation of inflammatory response.
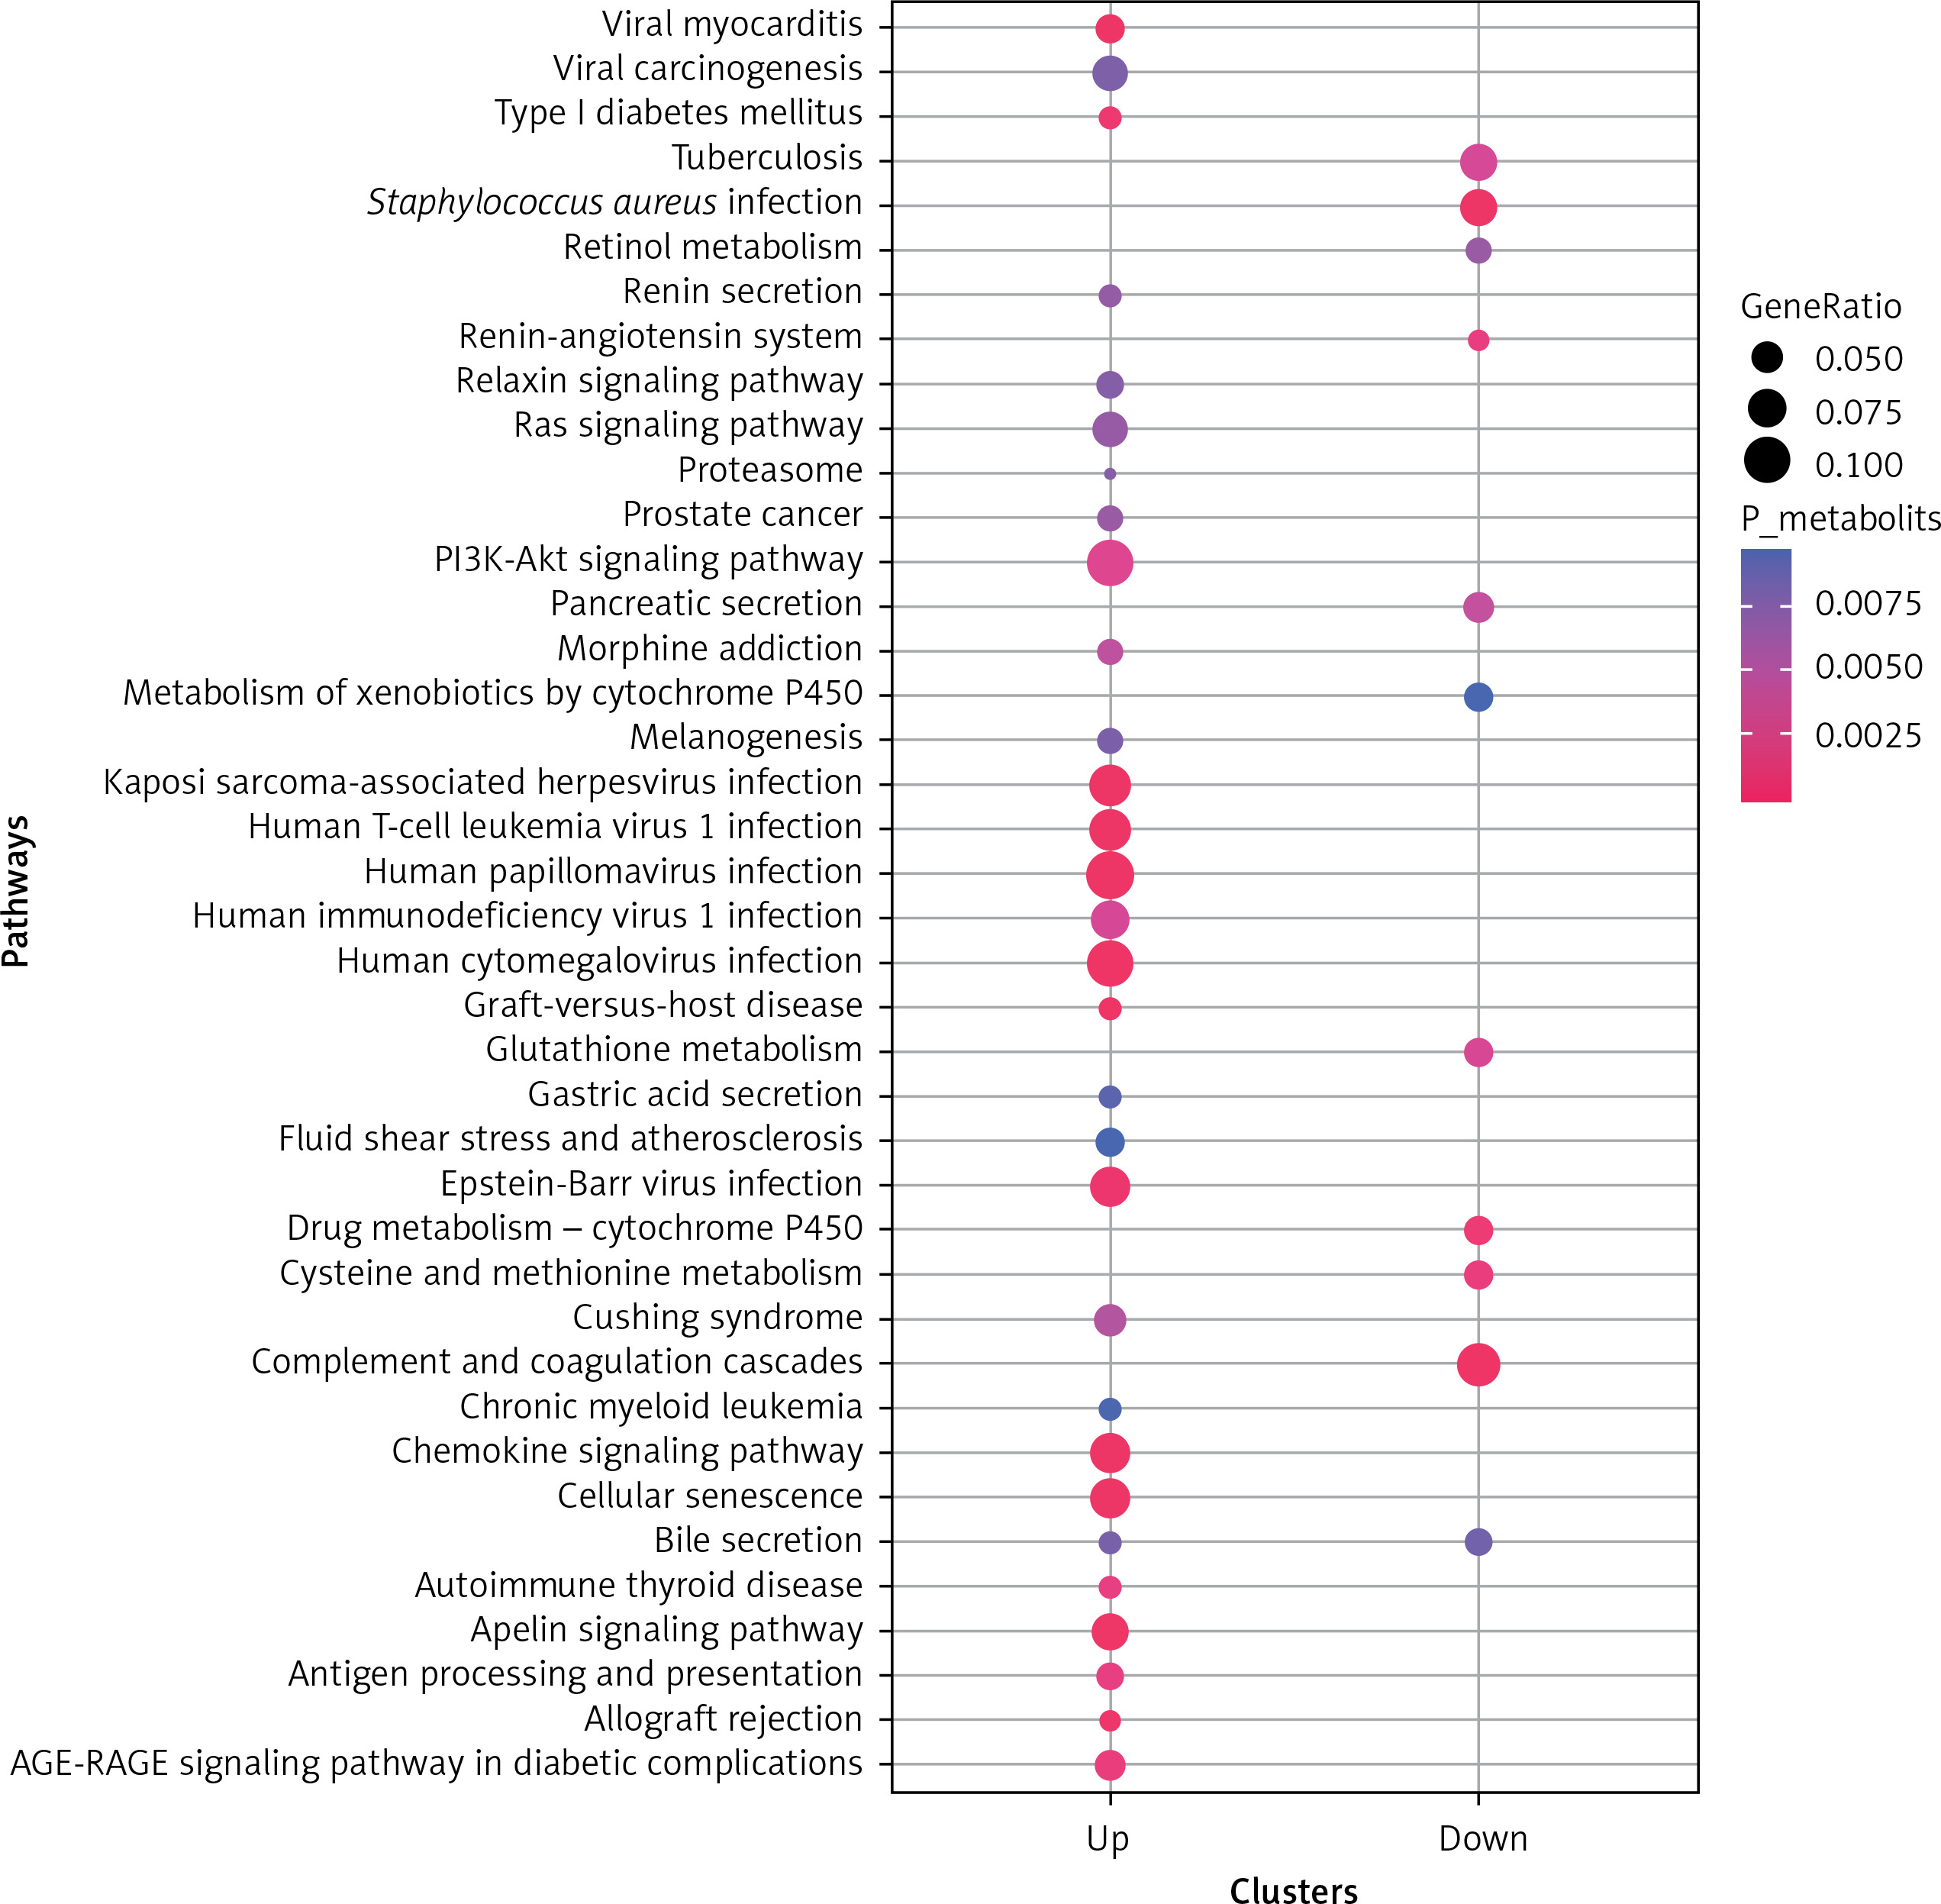
KEGG pathway enrichment analysis was also performed (Figure 4), and a total of 41 significant pathways were enriched, including 30 upregulated gene-enriched pathways and 11 downregulated gene-enriched pathways. The upregulated genes were mainly enriched in human cytomegalovirus infection, viral myocarditis, and Kaposi’s sarcoma-associated herpesvirus infection. The down-regulated genes were mainly enriched in pathways such as complement and coagulation cascade, Staphylococcus aureus infection, and drug metabolism-cytochrome P450.
Figure 4
The bubble diagrams of Kyoto Encyclopedia of Genes and Genomes (KEGG) pathway on differentially expressed mRNA. X-axis represents upregulated or downregulated enriched gene entries. Y-axis represents KEGG pathways. The size of dots represents the ratio of the number of enriched genes to the total number of uploaded genes, and the larger the ratio, the larger the dot. The colour gradation from blue to red suggests that the p-values becomes smaller, and the significance is higher
Protein-protein interaction network and module analysis of differentially expressed genes
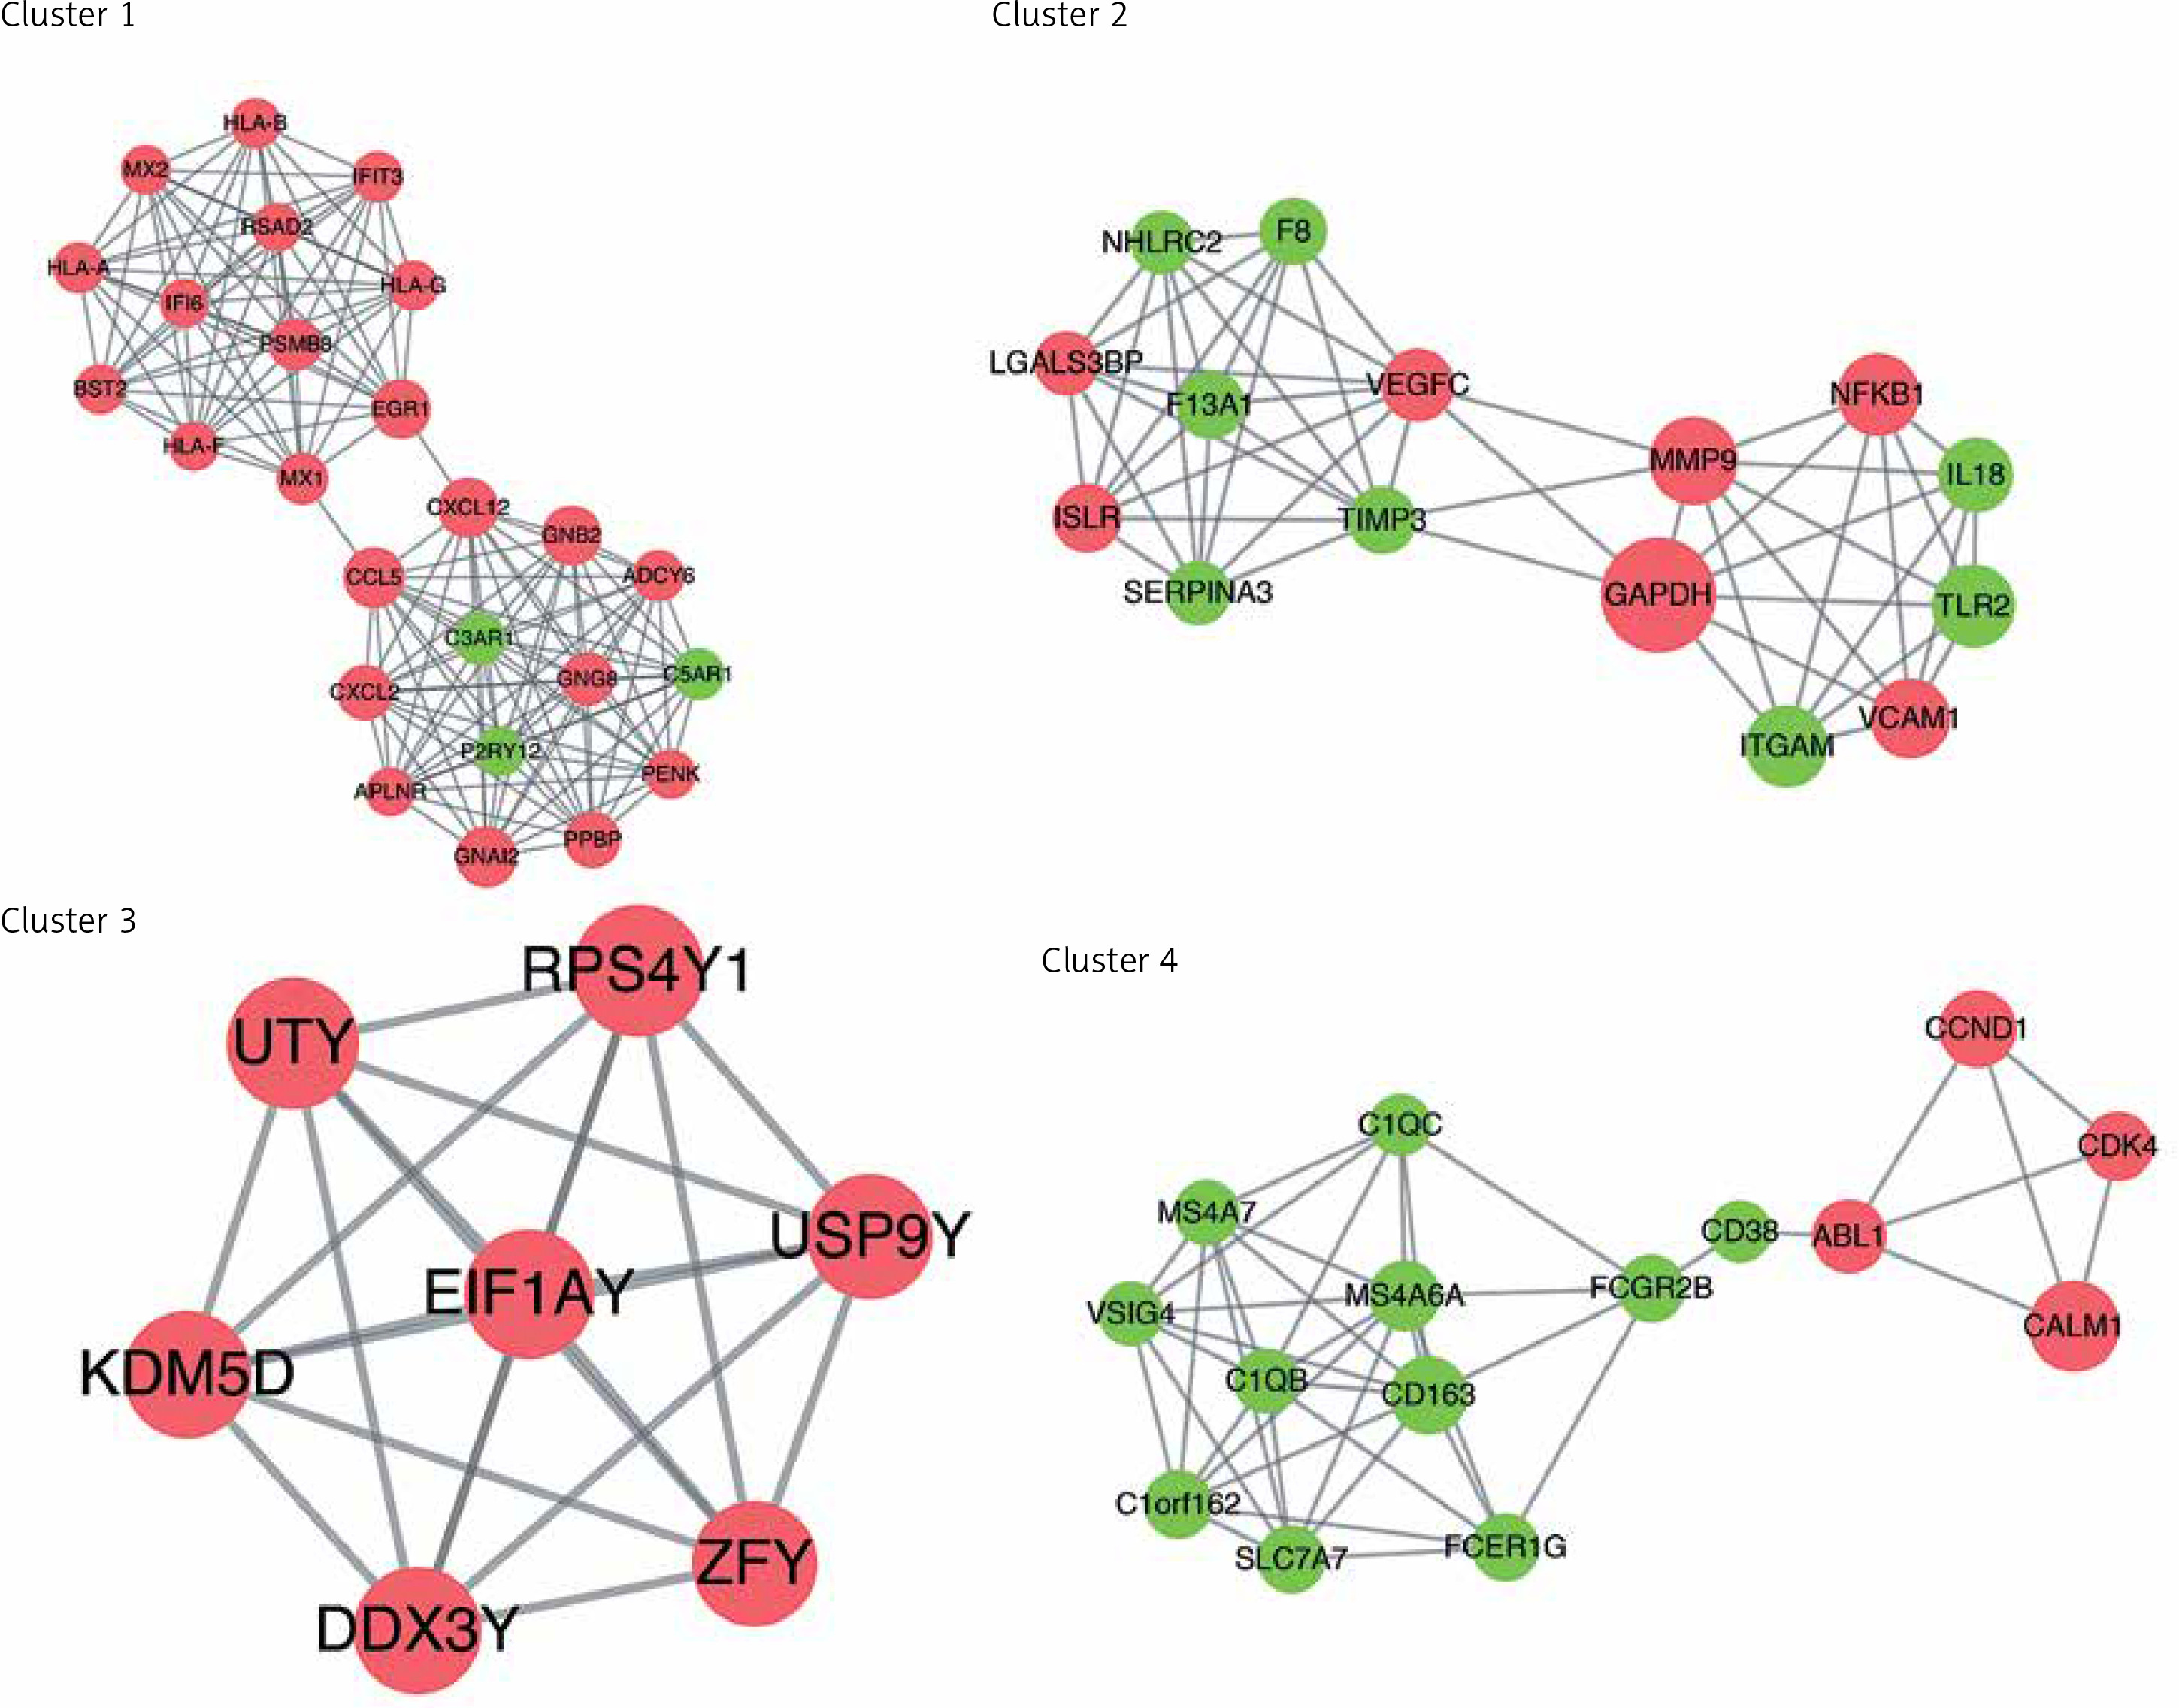
In order to analyse the interaction between genes, STRING software was applied to establish the PPI network. A total of 997 interaction pairs and 306 nodes were contained in the PPI network, with the threshold of combined score > 0.4. Based on the topological properties, the top 5 genes with the degrees higher than 28 were chosen as the hub genes, namely glyceraldehyde-3-phosphate dehydrogenase (GAPDH), calmodulin 1 (CALM1), matrix metallopeptidase 9 (MMP9), chemokine (C-C motif) ligand 5 (CCL5), and guanine nucleotide-binding protein G(i) α-2 (GNAI2). After analysing the PPI network by MCODE plugin, a total of 16 subnetworks were obtained. Figure 5 shows the top 4 subnetworks with scores greater than 5. Cluster 1 covered 25 genes and 146 relationship pairs with the highest score of 12.167, including 2 hub genes: GNAI2 and CCL5. Cluster 2, with the score of 7.571, also contained 2 hub genes: MMP9 and GAPDH. CALM1 was found in cluster 4 and showed the highest association with others. There was no hub gene in cluster 3. All the hub genes were upregulated compared to normal samples.
Figure 5
Sub-PPI network constructed from differential mRNA from GSE76701. Cluster 1 contains 25 genes and 146 edges with a score of 12.167; cluster 2 contains 15 genes and 53 edges with a score of 7.571; cluster 3 contains 7 genes and 21 edges with a score of 7; cluster 4 contains 15 genes and 43 edges with a score of 6.143. Pink represents upregulation, green represents downregulation. The size of the circle represents the degree of association of the node genes. The larger the dot, the greater the degree of genetic association
Target miRNA of the differentially expressed genes
The miRWalk 2.0 database was used to predict the target miRNA of DEGs; as a result, 15 relationship pairs appeared in at least 7 databases. After removing the repeats, 15 miRNAs and 9 mRNAs were obtained. Next, these 9 mRNA-involved pathways in the above analysis were screened out as the regulation pathway for the 15 miRNAs. A total of 27 pathways were screened out (Table I).
Table I
Targeted miRNAs were mainly enriched in 27 Kyoto Encyclopedia of Genes and Genomes pathways
Drug-gene interaction prediction analysis
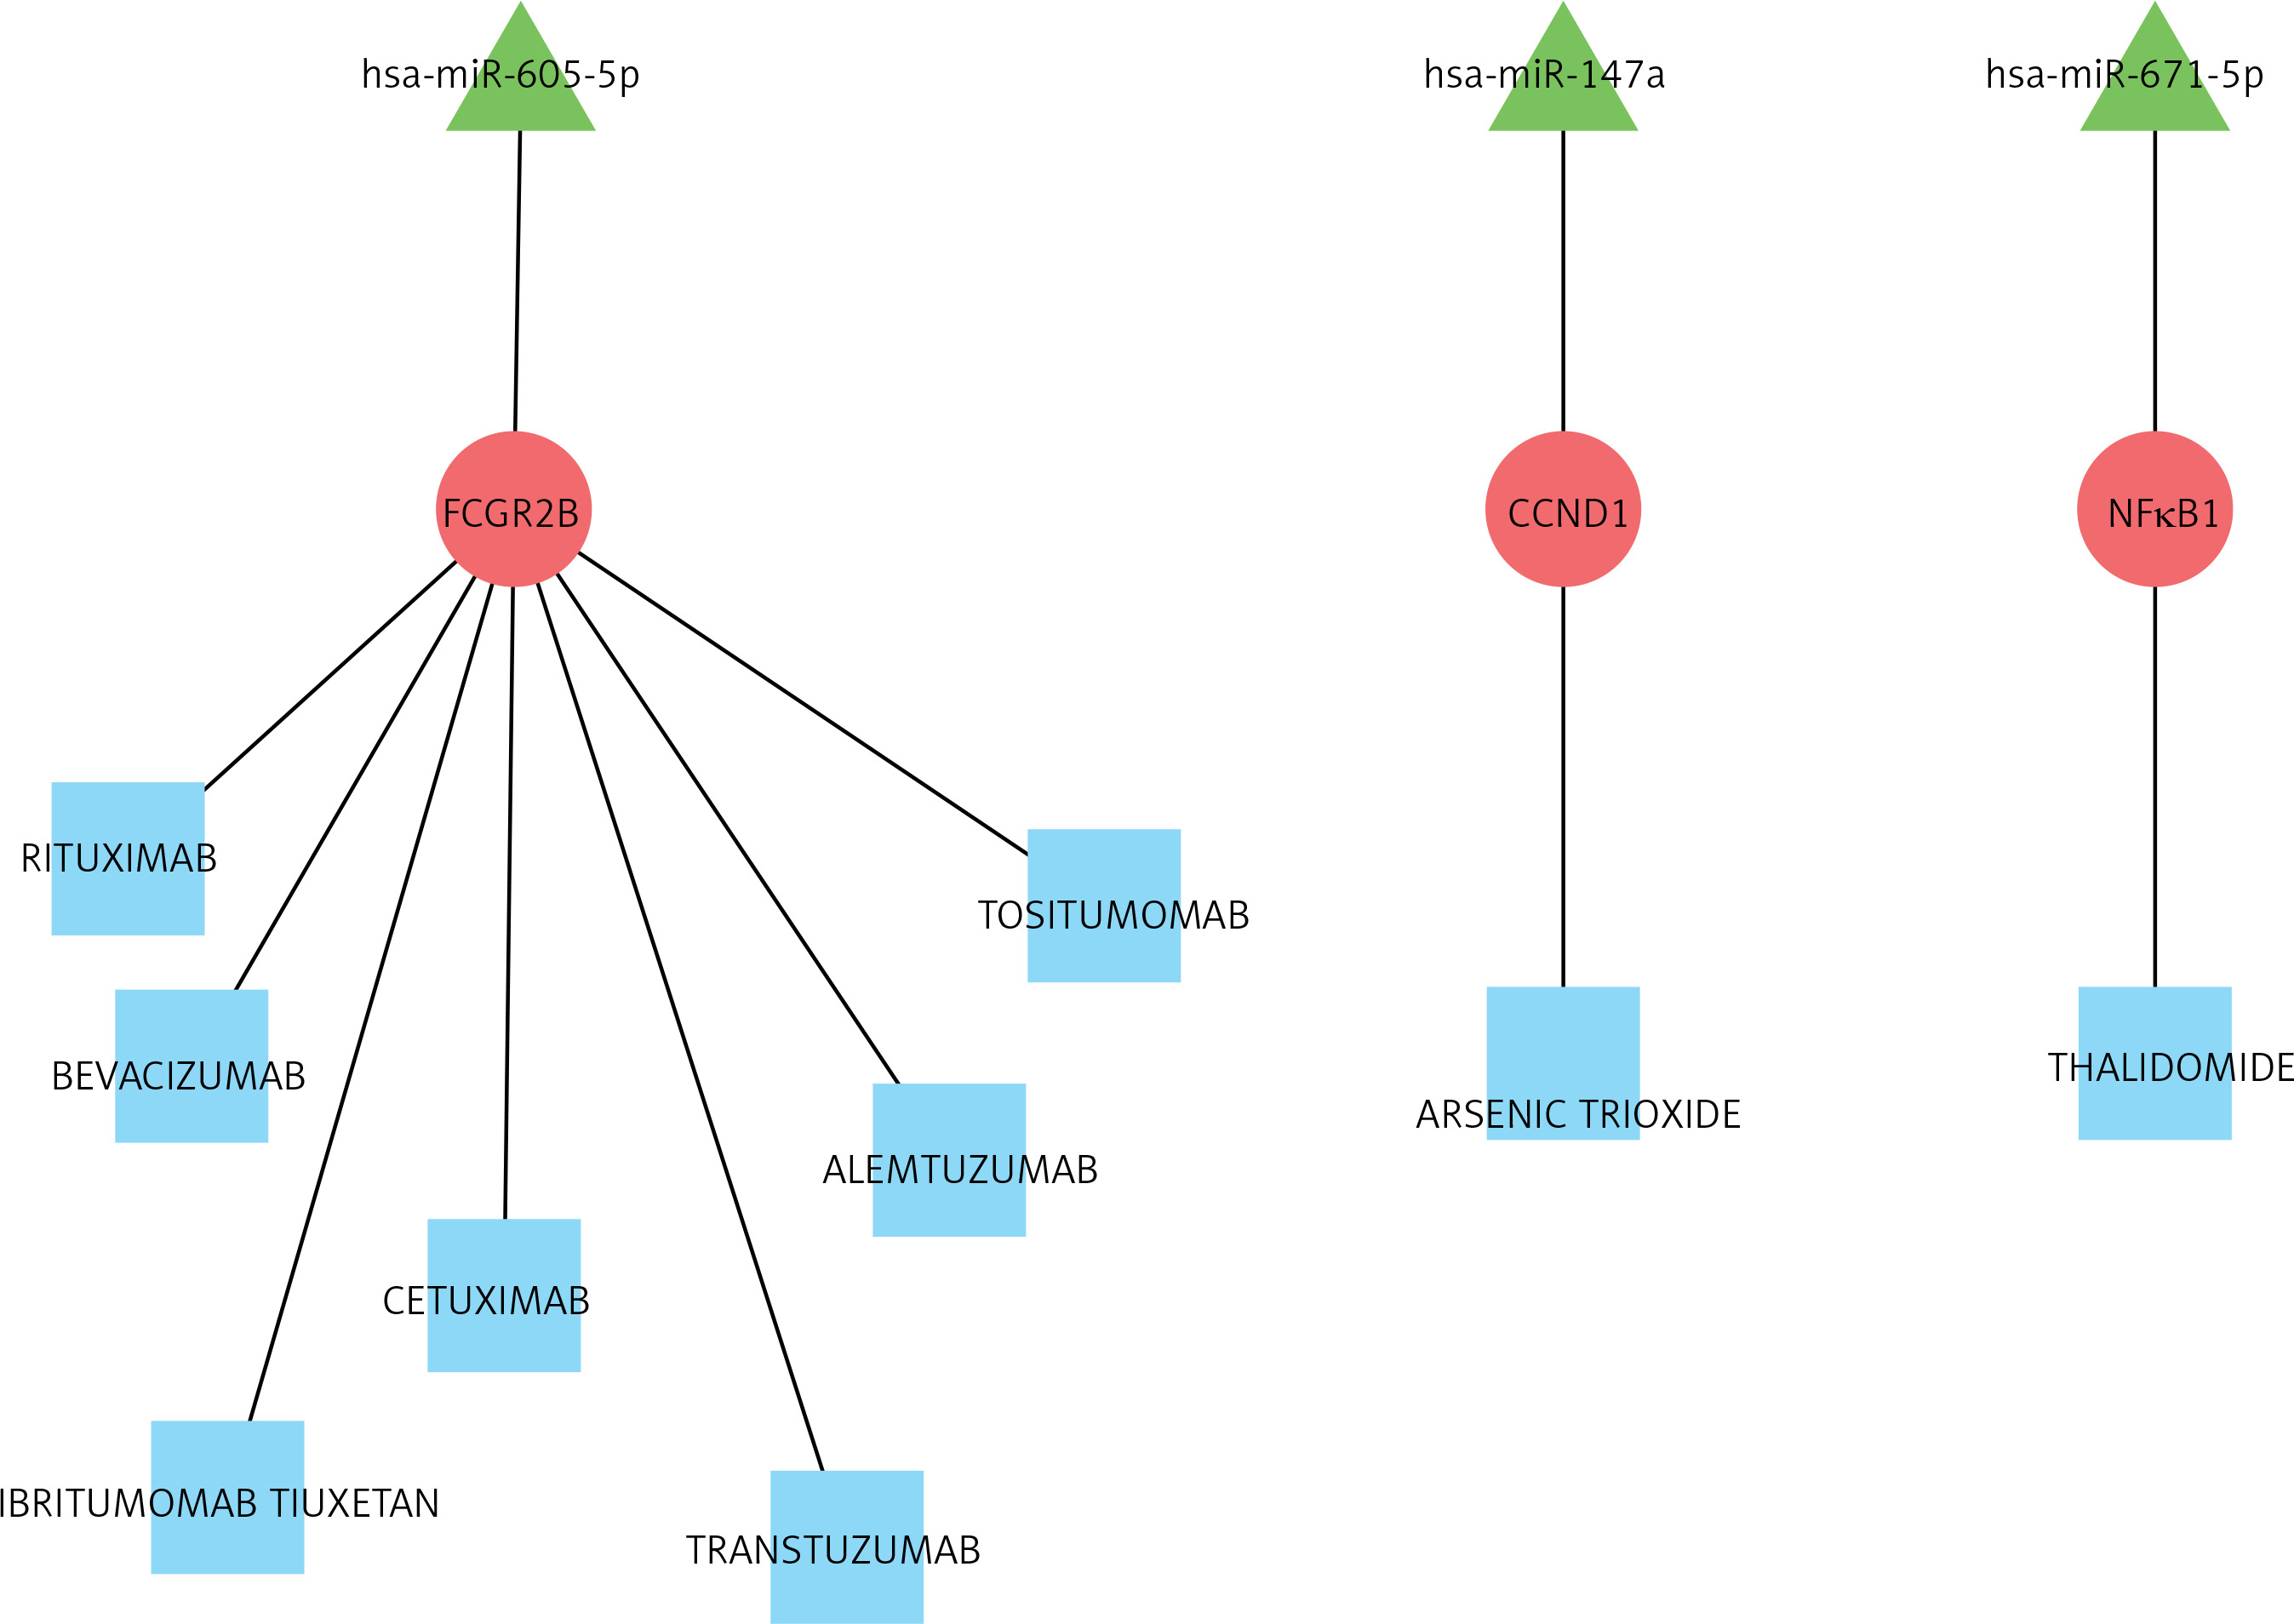
For the drug-gene association prediction analysis, 9 drugs and 3 related genes were obtained. Moreover, 3 miRNAs of these 3 genes were also included, and the regulatory relationship network of drug-mRNA-miRNA was constructed (Figure 6). According to the drug-mRNA-miRNA network, FCGR2B, CCND1, and NF-κb, as well as corresponding miRNA-605-5p, miRNA-147a, and miRNA-671-5p, were identified as the drug targets of HF.
Discussion
Due to its high morbidity and mortality, HF has always been a hotspot of medical attention. Biochemical markers that have been validated and are usually used in the diagnosis and prognosis of HF mainly contained B-type natriuretic peptide and N-terminal pro-B-type natriuretic peptide [10]. Despite intensive study in HF pathogenesis and therapies, the incidence and recurrence rate remain high, resulting in physical suffering and economic costs [15]. Therefore, a lot of evidence indicates that novel gene and molecules play an important role in the cardiovascular system and provide a new perspective into the pathophysiology as well as pharmacological targets of HF. Analysis of DEG of HF has been widely used to reveal the potential pathogenesis, which also enabled the extraction of targets for therapeutic strategies [30, 31]. Furthermore, Hu et al. identified key proteins and lncRNAs in hypertrophic cardiomyopathy based on integrated network analysis [32]. In the present study, gene expression profiles were analysed by means of bioinformatics, including function and pathway enrichment, PPI, and drug-mRNA-miRNA interaction networks. According to the results of mRNA profiles, a total of 489 DEGs were verified between HF and control, which mainly enriched in type I interferon and leukocyte migration according to molecular function. Significantly increased levels of GAPDH, GALM1, MMP9, CCL5, and GNAL2 were found in the HF setting and were identified as the hub genes based on the PPI network. Furthermore, according to the drug-mRNA-miRNA network, FCGR2B, CCND1, and NF-κb, as well as corresponding miRNA-605-5p, miRNA-147a, and miRNA-671-5p, were identified as the drug targets of HF.
Matrix metallopeptidase 9 (MMP-9) is an enzyme that belongs to the zinc-metalloproteinase family, taking part in the degradation of the extracellular matrix. It is known that MMPs are closely related to left ventricular function after myocardial infarction, and the activity of MMPs tends to cause endocardial endothelial-myocyte disconnection, thereby resulting in myocardial contractile dysfunction [33]. In MMP-9 knockout HF mice, attenuated myocardial contractile dysfunction was observed [34]. Moreover, by monitoring of the plasma levels of MMPs, individuals with high levels of MMP-9 expression appeared to have a major risk of developing congestive HF [35]. Furthermore, reduced cardiac MMP-9 level was found in ischaemic HF mice (left coronary artery permanent ligature) treated with a neutralising CCL5 monoclonal antibody, and a shrink infarct size was confirmed [36]. Consistent with the above reports, herein we found that the MMP9 and CCL5 were significantly upregulated compare with controls.
Furthermore, in recently published study, Wang et al. [37] analysed the gene expression profile GSE57338 involving 117 ischaemic cardiomyopathic HF and 136 control samples with various bioinformatics approaches. The DEGs were categorised by several relationships, such as interferon regulatory factor 1 (IRF1)-CCL5, which were revealed in the transcription factor microRNA target gene regulatory network. Wang et al. also stated that CCL5 may participate in HF progression via protein ubiquitination and CCL5 may participate in HF via IRF1-CCL5 interaction. Herein, we also found that CCL5 might be implicated in the progression of HF, which is consistent with the study by Wang et al.
In HF-related literature, Gapdh was the most frequently used reference gene in quantification of gene expression [38, 39]. Based on the geNorm and Normfinder algorithms, the most stable reference genes between HF and control tissues of mouse, rat, and human were Rpl32 and Polr2a, rather than Gapdh [40]. In our study, there was a significant difference in the expression of Gapdh between HF and the normal group. Ca2+ is arguably the most important second messenger in cardiac muscle, and the changes in the intracellular Ca2+ concentration have both acute and chronic effects on cardiac function. Ca2+/calmodulin-dependent protein plays an important role in cardiac hypertrophy and HF [41]. Many mutation sites of CALM1 have been reported to be associated with HF. For example, chronic heart failure (CHF) in patients carrying the CC genotype of rs3814843 on the CALM1 gene had greater risk of sudden cardiac death and all cause death [42]. A mutation in CALM1 (p.Phe90Leu) encoding calmodulin causes sudden cardiac death in childhood and adolescence [43]. However, the change in the expression of CALM1 has not been specifically reported.
Moreover, miRNAs could regulate gene expression at the post-transcriptional level [44]. Functional miRNA studies revealed that many miRNAs had a great impact on the pathological mechanism related to HF, such as vascular remodelling, cardiac fibrosis, and hypertrophy [45]. Based on the global miRNA profile of ventricles of HF mice, decreased expression of miR-1 and miR-133a induced upregulation of target genes, resulting in cardiac hypertrophy. Also, a large number of miRNAs appeared to have an upregulated pattern in different stages of HF [46]. By analysing the circulating miRNAs of 39 normal control, 30 HF, and 20 dyspnoeic patients, miR-423-5p was especially accumulated in HF and determined as a strong diagnostic biomarker of HF, with an area under the receiver operator characteristics (ROC) curve of 0.91 [47]. Actually, the relationships of differentially expressed miRNA and aetiology of HF have been validated by abundant literature in larger patient groups [48–50]. We found herein that miRNA-147a could be an interacted miRNA for HF prediction. According to a previous study [51], miRNA-147a was involved in the macrophage activation during the pathogenesis process of ischaemia heart disease; therefore, the cardiac-related miR-147a is somehow consistent with our obtained results. For miR-671-5p, Wong et al. [52] recently identified that miR-671-5p and another 7 miRNAs could distinguish HF from healthy controls, which is consistent with our study. However, there is no report on the role of miRNA-605-5p on the HF, which gave us a new enlightenment for HF study.
In conclusion, taken together, our results indicated that hub genes GAPDH, GALM1, MMP9, CCL5, and GNAL2 were significantly increased in HF. miRNA-605-5p, miRNA-147a, and miRNA-671-5p were predicted as the drug target-interacted gene-miRNA of HF.