Introduction
Alzheimer’s disease (AD) is a neurodegenerative disease with amyloid beta protein plaques and tau protein hyperphosphorylation causing neurogenic fiber tangles as the main pathological manifestation [1]. It is divided into two main categories, “sporadic AD (typical AD)” and “atypical AD”. Sporadic AD is common in the elderly and most typically presents clinically as a slowly progressive amnesic disorder that can eventually evolve into a multi-domain dementia in which amnesia predominates. The non-amnesic phenotype, on the other hand, is characterized mainly by dysfunction in the visual, language, executive, behavioral and motor domains and is most often seen in younger adults [2]. There are a number of hypotheses that explain the pathogenesis of AD; however, Grobler et al. noted that the most dominant of these pathophysiologic hypotheses include the amyloid-β (Aβ), inflammatory, vascular, and infectious hypotheses [3]. Research supports that myelin damage may even predate Aβ lesions in AD [4]. Increasing evidence suggested that the peripheral anion site of AChE contributes to Aβ aggregation and neurotoxicity in AD, offering prospects for developing multifunctional anti-AD agents [5]. Concurrently, as confirmed by the studies, the cholinergic circuitry, a vital subcortical-cortical network in the brain, is progressively disrupted in AD, even in its early stages [6, 7]. This evidence supports the cholinergic hypothesis of AD and has accelerated the development of drugs, specifically acetylcholinesterase inhibitors. Several drugs in this class have been approved by the U.S. Food and Drug Administration as primary therapeutic agents for AD, which increase synaptic acetylcholine levels to relieve symptoms [8, 9]. Despite the progress that has been made in these studies, the exact pathogenesis is still in the exploratory stage. The risk factors that contribute to its development are clearer, including vascular dysfunction [10], sleep disturbances [11], and gender differences [12]. This neurodegenerative disease is the leading cause of dementia in the elderly population and affects approximately 240,000 people worldwide [13]. As it is characterized by progressively increasing cognitive deficits, language impairment, memory impairment, performance impairment, and personality-behavior changes, AD can lead to a decreased quality of life, increased dependency, and increased cost of care for patients [14–18]. In addition, AD patients often suffer from neuropsychiatric symptoms such as depression, apathy, and hallucinations, thus placing a heavier burden on the patients themselves and their families [19]. Therefore, an in-depth understanding of the mechanisms, metabolic pathways, and gene targets associated with AD can help us treat the disease and alleviate the heavy burden it brings.
Through the analysis, we found a close correlation between AD and the oxidative phosphorylation (OXPHOS) pathway. Mitochondrial OXPHOS is a crucial mechanism for energy production in eukaryotic cells and is central to cellular metabolism [20]. Based on its energy supply role and its involvement in cellular metabolism, it also plays a very important role in the development of diseases. Among cardiac diseases, cardiomyopathy and heart failure are common manifestations of mitochondrial diseases caused by defects in the mitochondrial OXPHOS system [21]. In neurodegenerative diseases, OXPHOS also plays a crucial role. On the one hand, oxidative stress involving OXPHOS is an essential factor for Aβ protein accumulation and tau protein hyperphosphorylation [22–24], and on the other hand, mitochondria are more susceptible to oxidative stress due to their role as sites of the ATP-generating electron transport chain and major sources of ROS [25, 26], and thus mitochondrial respiratory abnormalities have been seen in several neurodegenerative disorders, including AD and Parkinson’s disease [27]. During the development of these diseases, brain glucose metabolism deteriorates in a region-specific and progressive manner; that is, the primary energy supply is converted from OXPHOS to glycolysis (metabolic reprogramming) [28]. Metabolic reprogramming leads to widespread defective impairment of cellular metabolism, ultimately causing cellular dysfunction. If this process occurs in immune cells of the brain (e.g. microglia), it leads to the development of neuroinflammation and ultimately promotes the development of AD [29].
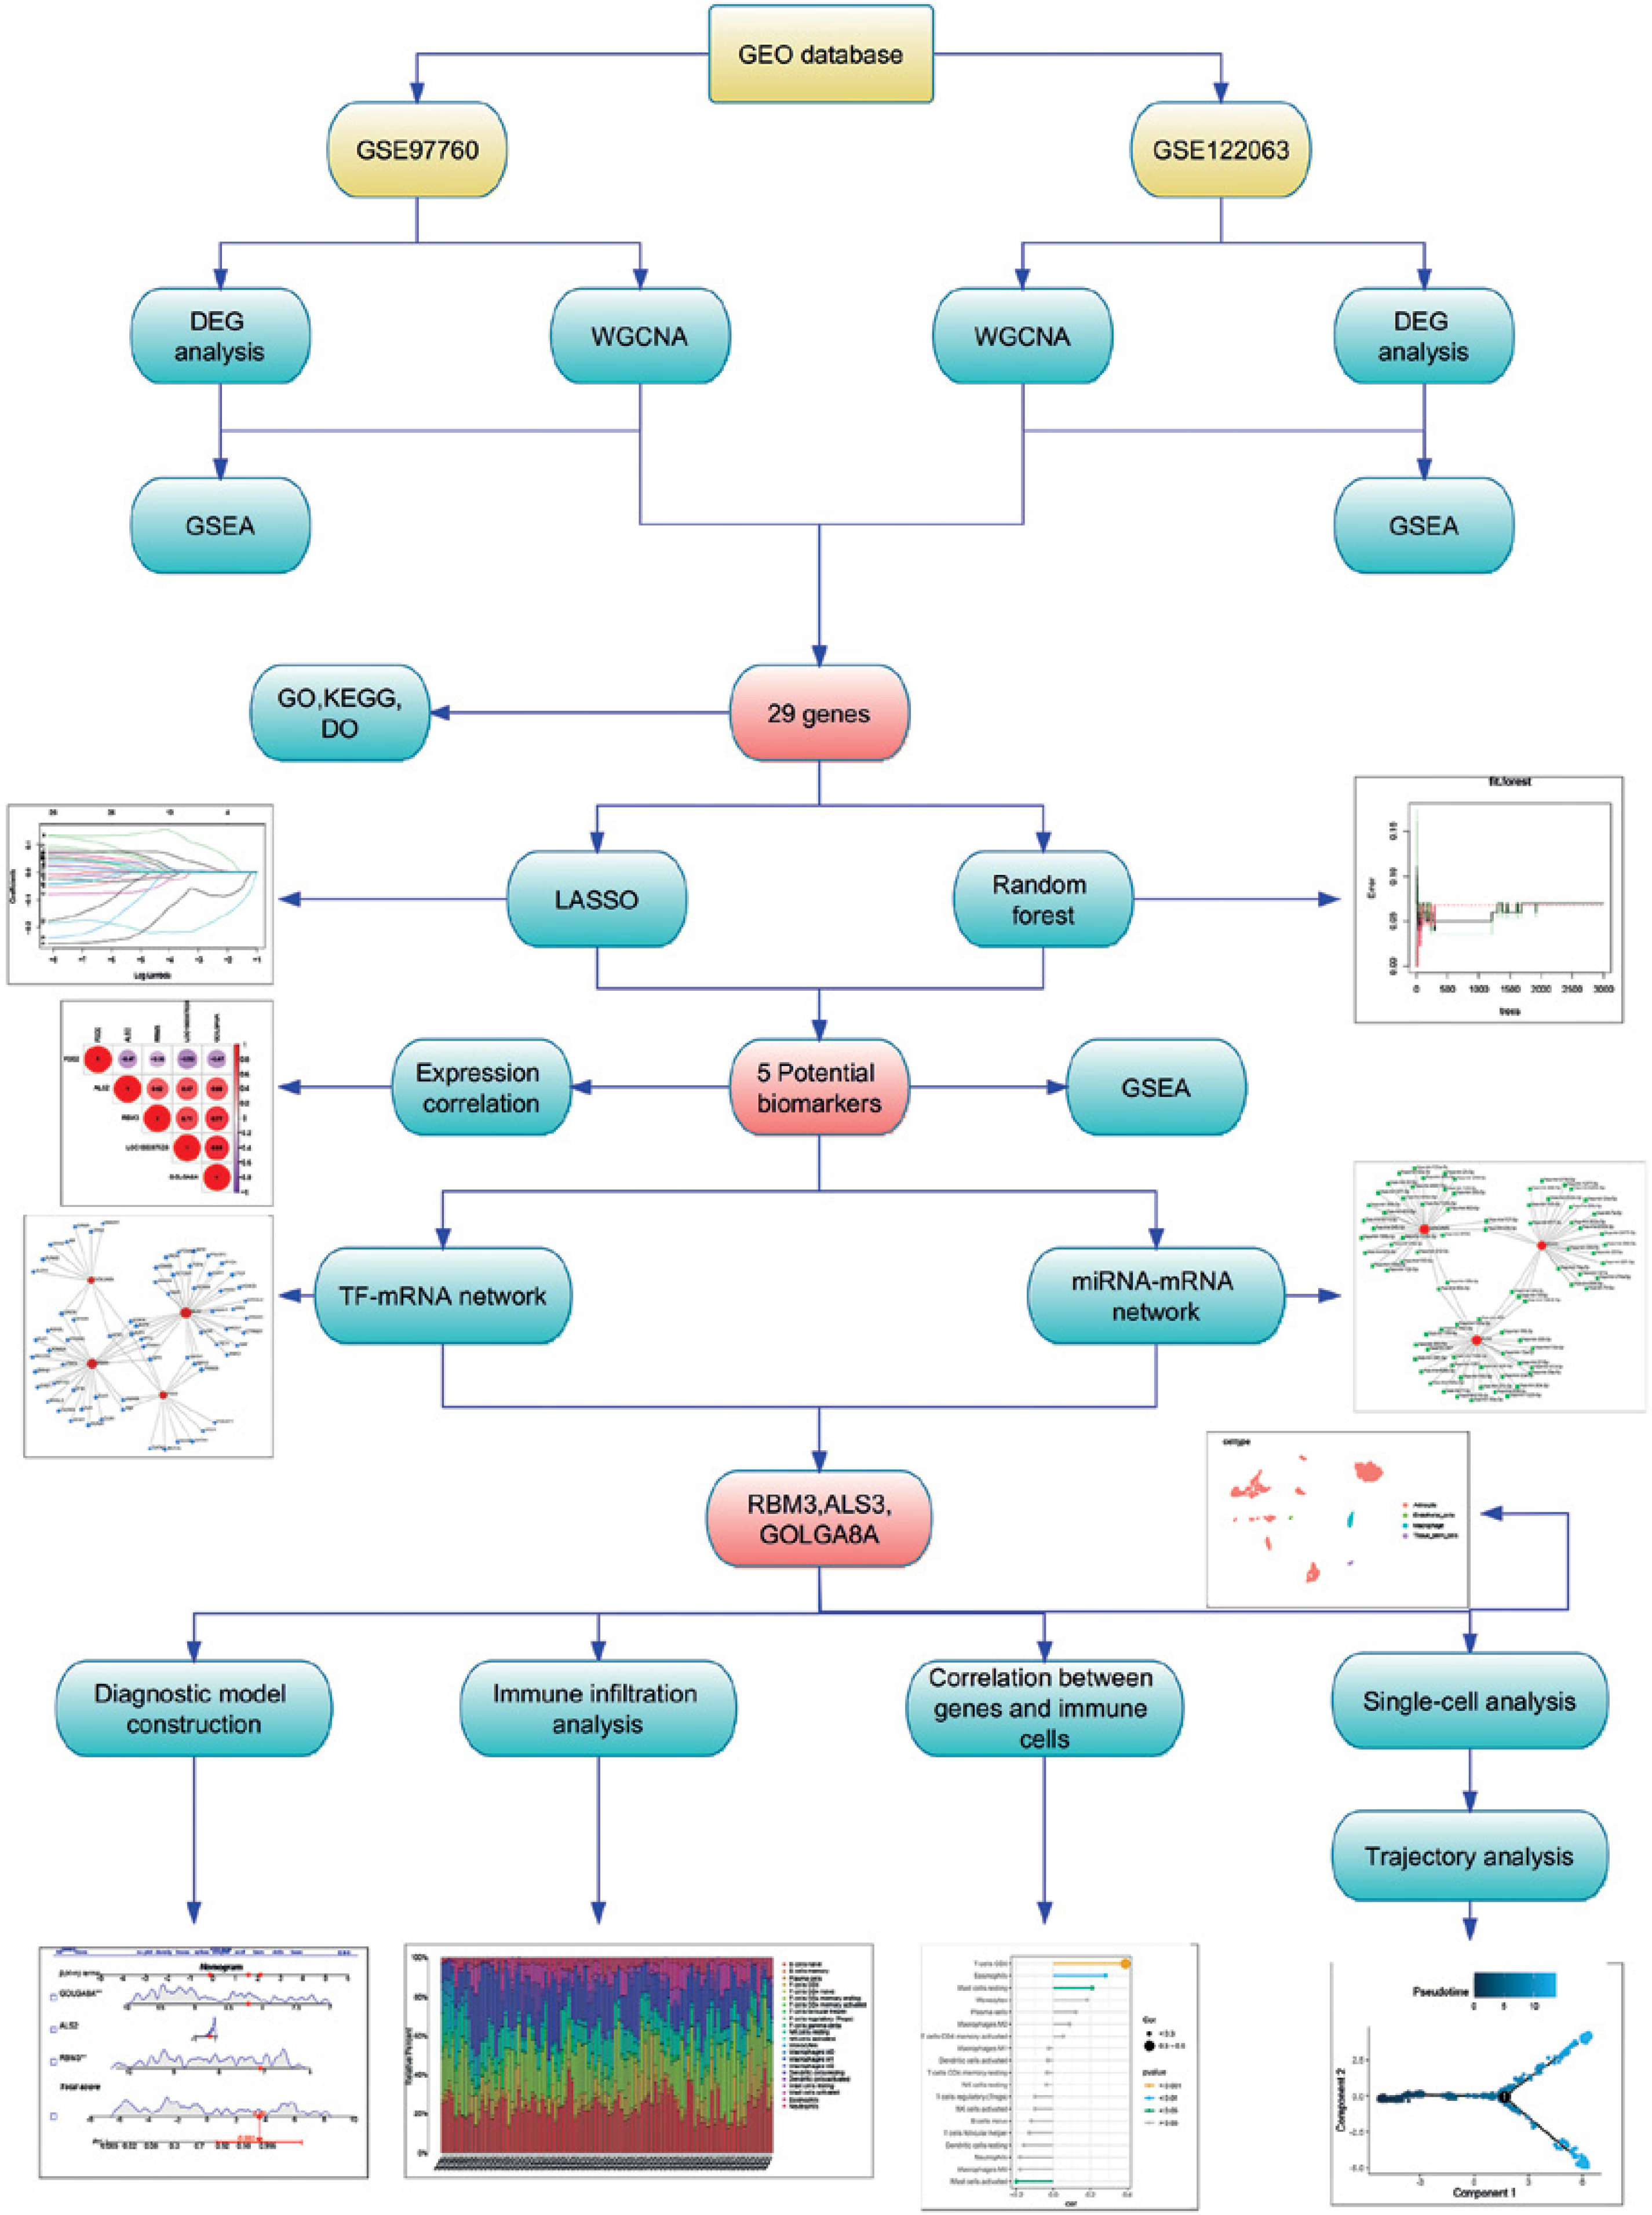
The aim of this study is to reveal the potential driver genes for the occurrence of AD through multi-omics analysis and to develop unique biomarkers accordingly. Figure 1 illustrates the workflow of this study.
Material and methods
Transcriptome data and scRNA-seq (single-cell RNA sequencing) data acquisition
Gene expression files for AD were obtained from the NCBI
Gene Expression Omnibus public database (GEO) (https://www.ncbi.nlm.nih.gov/). The GEO datasets GSE122063 and GSE97760 were chosen. Samples from GSE97760 were extracted from peripheral blood. Samples from GSE122063 were extracted from the frontal and temporal cortex. After excluding 36 patients with vascular dementia, a total of 56 samples with AD and 44 healthy controls were retained in the GSE122063 dataset. A total of 9 samples with AD and ten healthy controls were retained in the GSE97760 dataset. The scRNA-seq data of 1 AD sample and 1 healthy control (GSM4996463 and GSM4996462) of GSE164089 were obtained from the GEO database.
Differential expression analysis
We replicated the DEG analysis with AD datasets (GSE122063 and GSE97760) to confirm the differentially expressed genes (DEGs). In R (version 4.2.2), the limma and GSEABase packages were used for DEG identification and GSEA. Between the control group and AD group, the screening criteria for DEGs were a p-value < 0.05 and |log2(fold change)| > 1.
Screening of co-expressed genes of AD-related pathways by weighted gene co-expression network analysis
Using the GSEA database, we selected 10 potentially pathways relevant to AD, including GOBP_RESPONSE_TO_OXIDATIVE_STRESS (https://www.gsea-msigdb.org/gsea/msigdb/human/geneset/GOBP_RESPONSE_TO_OXIDATIVE_STRESS) [30], GOBP_INTRINSIC_APOPTOTIC_SIGNALING_PATHWAY (https://www.gsea-msigdb.org/gsea/msigdb/human/geneset/GOBP_INTRINSIC_APOPTOTIC_SIGNALING_PATHWAY) [31], HP_NEUROINFLAMMATION (https://www.gsea-msigdb.org/gsea/msigdb/human/geneset/HP_NEUROINFLAMMATION) [32], HALLMARK_OXIDATIVE_PHOSPHORYLATION (http://www.gsea-msigdb.org/gsea/msigdb/human/geneset/HALLMARK_OXIDATIVE_PHOSPHORYLATION) [28], and BIOCARTA_HSP27_PATHWAY (https://www.gsea-msigdb.org/gsea/msigdb/human/geneset/BIOCARTA_HSP27_PATHWAY) [33]. The WGCNA package in R software was used to construct a gene co-expression network to examine the co-expression relationships between genes and pathways [34]. We removed an abnormal sample based on cluster trees. To construct the similarity matrix, we calculated the correlation coefficient between each gene pair. We chose an appropriate soft threshold to transform the similarity matrix into an adjacency matrix, ensuring the construction of a scale-free network. Then, the average network connectivity for each gene was calculated using a topological overlap matrix (TOM). Genes with similar expression profiles were grouped into the same module using the blockwiseModules function and dynamic tree cutting. Different modules are characterized by different colors. Module eigengene (ME) is the first main component of each module’s gene expression profile. We also calculated module membership (MM), gene significance (GS), and modules with AD-related pathways, and then visualized the network of feature genes. Finally, AD target genes were identified by intersecting WGCNA-derived significant module genes with DEGs from GSE122063 and GSE97760.
GO, DO, KEGG analyses
We used the clusterProfiler R package to perform GO (Gene Ontology), KEGG (Kyoto Encyclopedia of Genes and Genomes) and DO (Disease Ontology) analyses of the functions of the genes obtained from the intersection. A p-value < 0.05 was set as the filtering criterion for the three analyses mentioned above. GO analysis was conducted to identify target gene-related cellular components (CCs), molecular functions (MFs) and biological processes (BPs). DO analysis was used to identify diseases in which target genes are frequently involved. Additionally, we screened signaling pathways enriched by potential targets using KEGG enrichment analysis.
Cerebral cortex marker screening in AD patients by machine learning algorithms
Two machine learning algorithms were used for this study: LASSO regression analysis and random forest analysis. Firstly, we used the glmnet package to perform the LASSO regression analysis. In addition, a random forest analysis was performed using the randomForest package and genes with a MeanDecreaseGini > 2 were selected. The intersection genes derived from two machine learning algorithms are considered potential cortex biomarkers for patients with AD.
Correlation analysis and GSEA of potential biomarkers
Using the corrplot package, we analyzed the correlation between the expression of potential biomarkers. Further, gene set enrichment analyses (GSEA) were performed on the biomarkers to better understand their functions.
Single-cell data processing and cell annotation
Seurat objects were created from scRNA-seq data using the R software package Seurat 4.2.1 [35], which was also utilized for normalization, grouping, differential gene expression analysis, and visualization. Integration was performed using the Harmony package by removing batch effects for different samples. First, we conducted quality control on the scRNA-seq data by deleting clusters with fewer than three cells, cells with at least 20% mitochondrial genes, and cells with no more than 50 genes mapped. Then, the different cell clusters were obtained based on the first 2000 differential genes by descending and removing batch effects by principal component analysis (PCA) and the Harmony algorithm. The clustering analysis was done based on the FindClusters and FindNeighbors functions in the Seurat package, and the results were visualized using the RunUMAP function. Different cell clusters were annotated using the SingleR package. By the subset() function, various cells from AD and control samples were extracted for differential gene expression analysis.
Trajectory analysis of single cells
The Monocle package (version 2.22.0) in R software (version 4.1.3) was used to create single-cell pseudotime trajectories of astrocytes. First, two samples of astrocytes were selected from the annotated cell subpopulations. Then, we applied the newCellDataSet() function to create a new object. Genes with mean expression < 0.1 were removed and the remaining genes were used for trajectory analysis. The reduceDimension() function was applied to reduce the dimension and we set the appropriate parameters (reduction_method = DDRTree and max_components = 2). Immediately after, we used the plot_cell_trajectory() function to cells for sorting and visualization. We calculated the significance of changes in potential biomarkers with pseudotime by using the differentialGeneTest() function with parameters set to a q value<0.1 and visualized them with the plot_pseudotime_heatmap() function.
Construction of the miRNA-mRNA and TF-mRNA network
Investigating the relationship between miRNAs and potential biomarkers, transcription factors and potential biomarkers is essential for understanding the regulatory mechanisms and functions of potential biomarkers. In addition, we used this network to find the most crucial potential biomarkers that are interlinked among the biomarkers. Based on the NetworkAnalyst 3.0 platform (https://www.networkanalyst.ca/NetworkAnalyst/), we used the ChEA database to enrich potential biomarker-associated transcription factors (TFs), and used the TarBase database to enrich potential biomarker-associated miRNAs.
Construction of the potential biomarker-based nomogram
A nomogram was used to predict the relationship between gene expression and prevalence in a population. We selected potential biomarkers that were linked in both the TF-target gene network and the miRNA-target gene network for the construction of the nomogram. The rms package was used to construct a nomogram based on the potential biomarker. Subsequently, the expression of potential biomarkers was used to predict AD prevalence in the population.
Immune infiltration and immune cell correlation analyses
The CIBERSORTx website (https://cibersortx.stanford.edu/) was used to analyze the level of infiltration of 22 different immune cells in the cerebral cortex and blood tissue of patients. Then, we performed a correlation analysis of the 22 immune cells infiltrating the cerebral cortex of AD patients to better understand how the immune system changes.
Correlation analysis of key potential biomarkers and immune cell infiltration
The Spearman coefficient was used to investigate the correlation between key potential marker genes and immune cell infiltration further, to identify which immune cells they have a significant connection with, and to try to determine how key potential marker genes play an essential role in AD by regulating immune cell infiltration.
Results
Identification of DEGs in the cerebral cortex and peripheral blood of AD patients
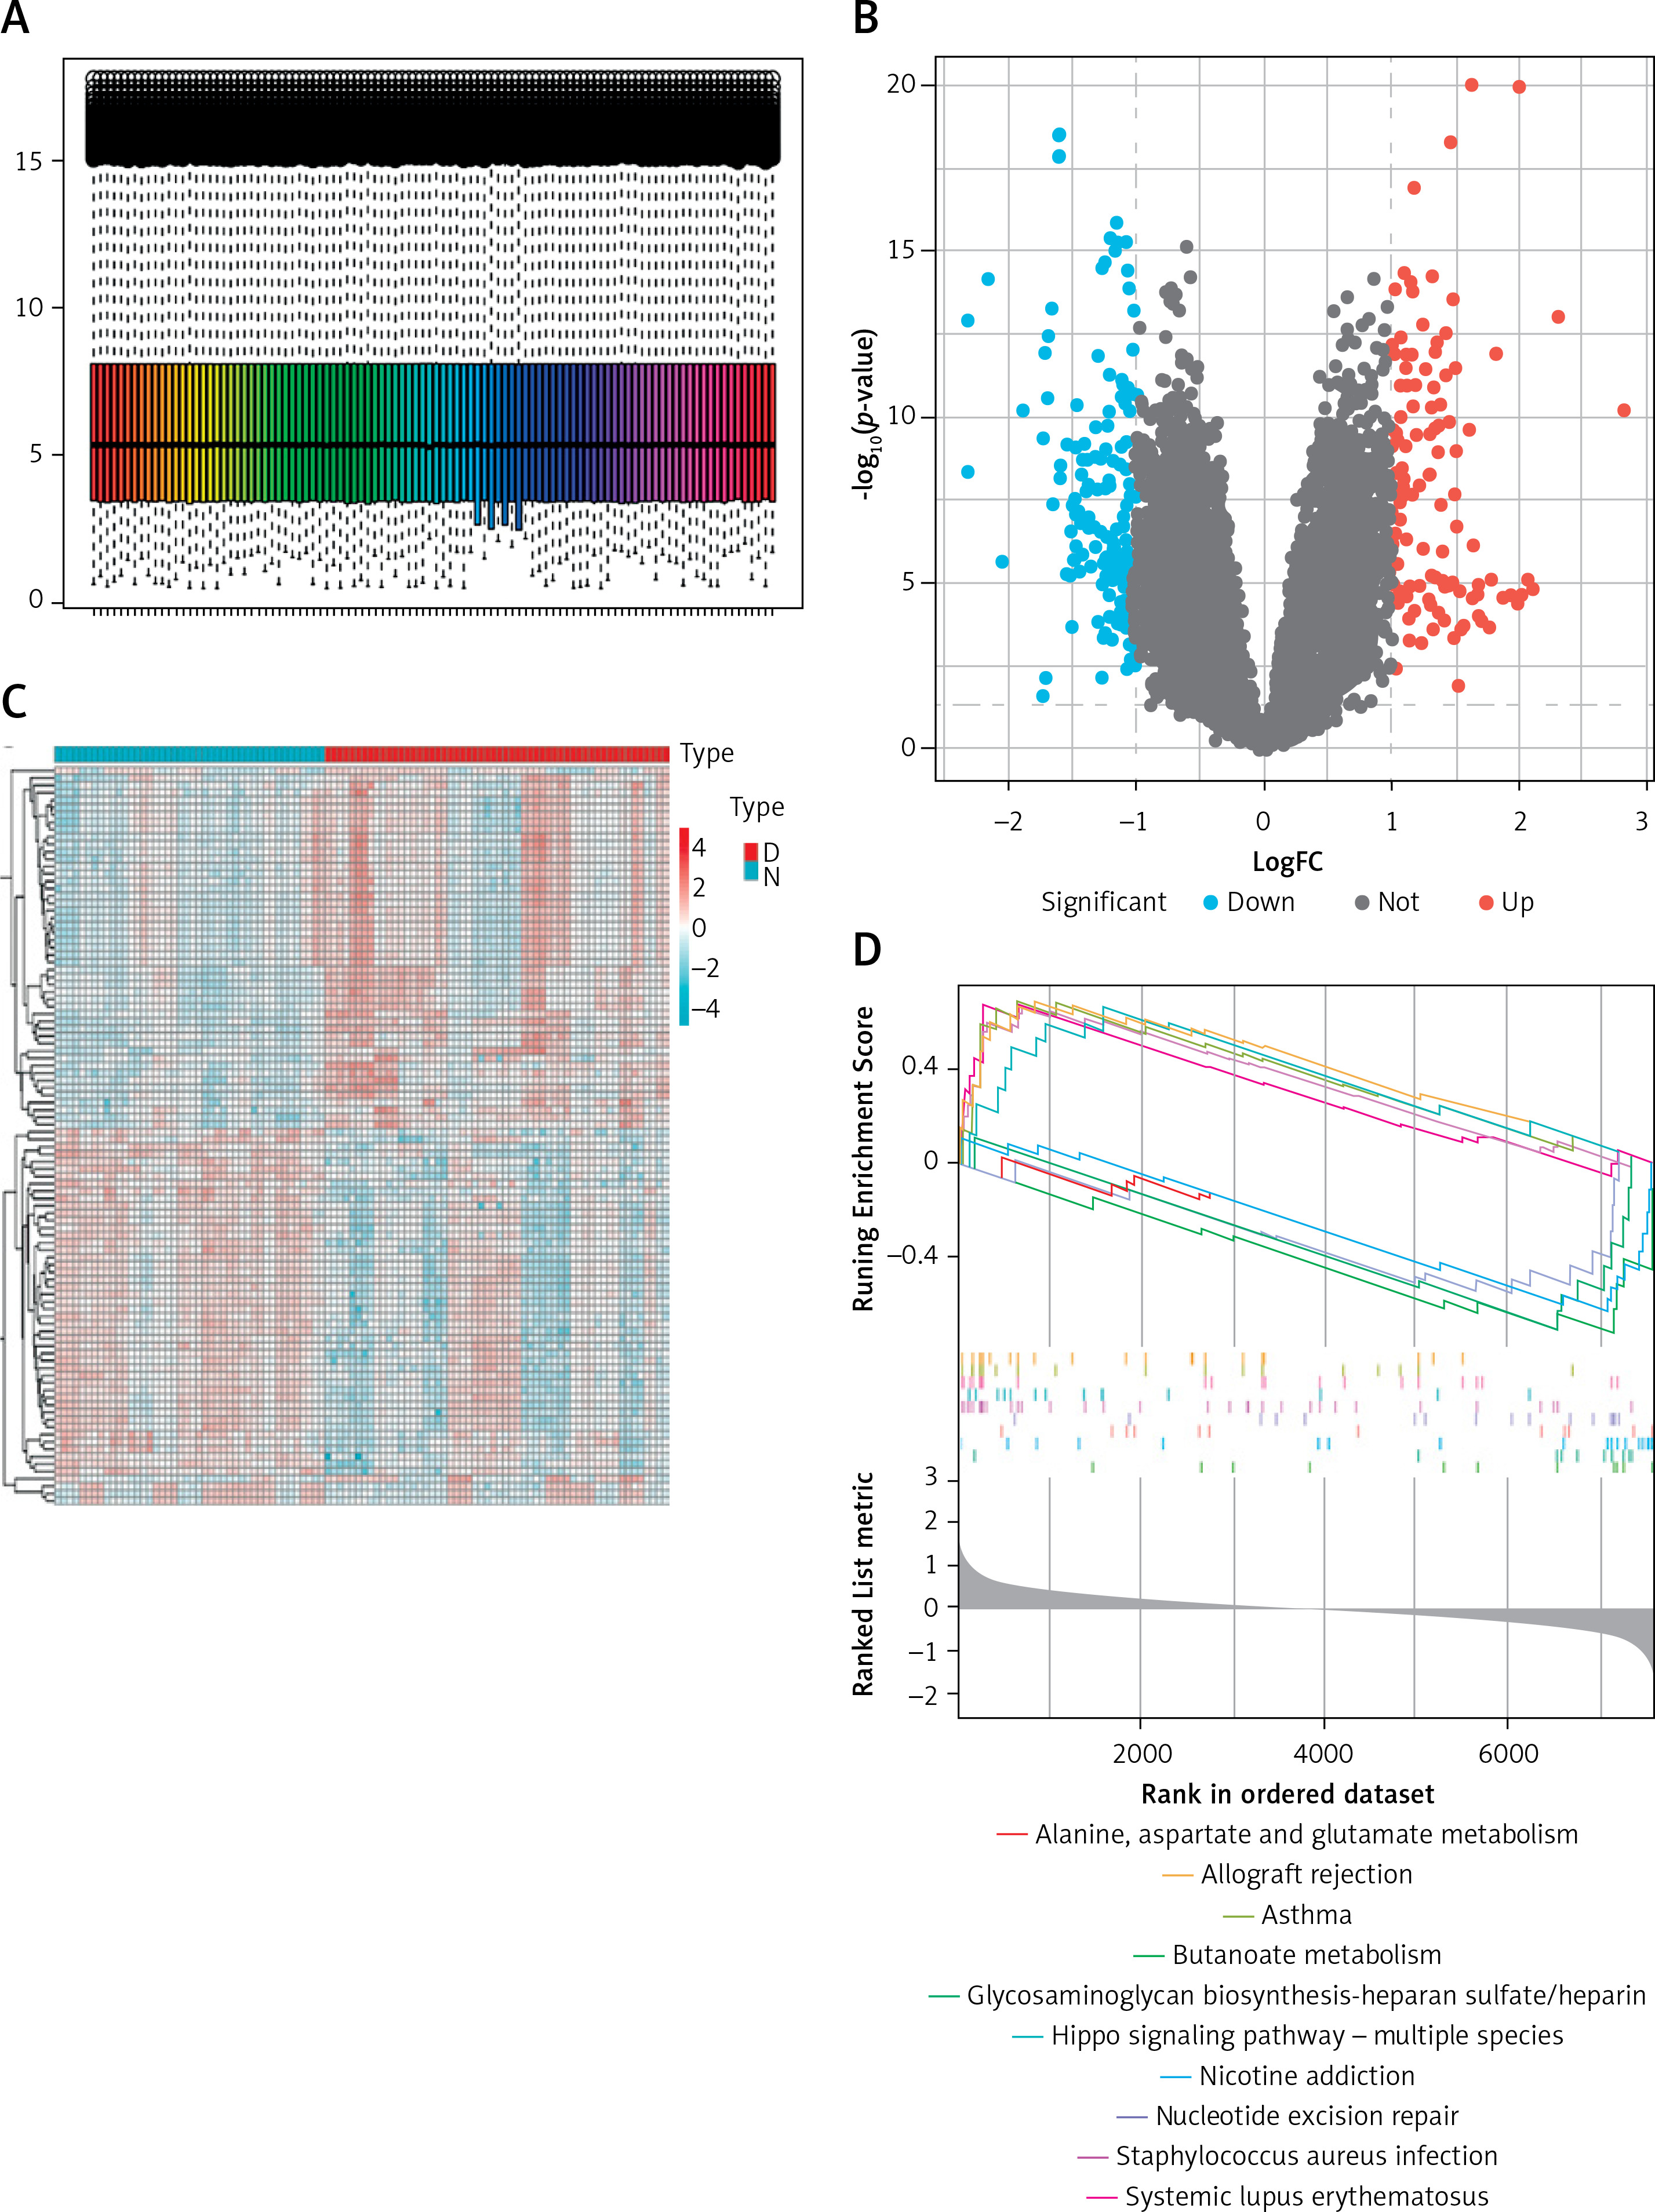
First, the sample was standardized to obtain 307 and 2862 DEGs in the cerebral cortex (Figure 2 A) and peripheral blood (Supplementary Figure S1 A) of patients with AD. Among the DEGs in the cerebral cortex, 118 genes were up-regulated and 189 genes were down-regulated. Meanwhile, among the DEGs in peripheral blood, 1283 genes were down-regulated and 1579 genes were up-regulated. This DEG information was displayed as a volcano plot (Figure 2 B, Supplementary Figure S1 B). Two heatmaps of the top 100 DEGs were plotted (Figure 2 C, Supplementary Figure S1 C). Subsequently, GSEA of the 307 and 2862 DEGs yielded nucleotide excision repair, alanine, aspartate and glutamate metabolism pathways, the hippo signaling pathway – multiple species and cell cycle, and RNA degradation pathways (Figure 2 D, Supplementary Figure S2 D).
Figure 2
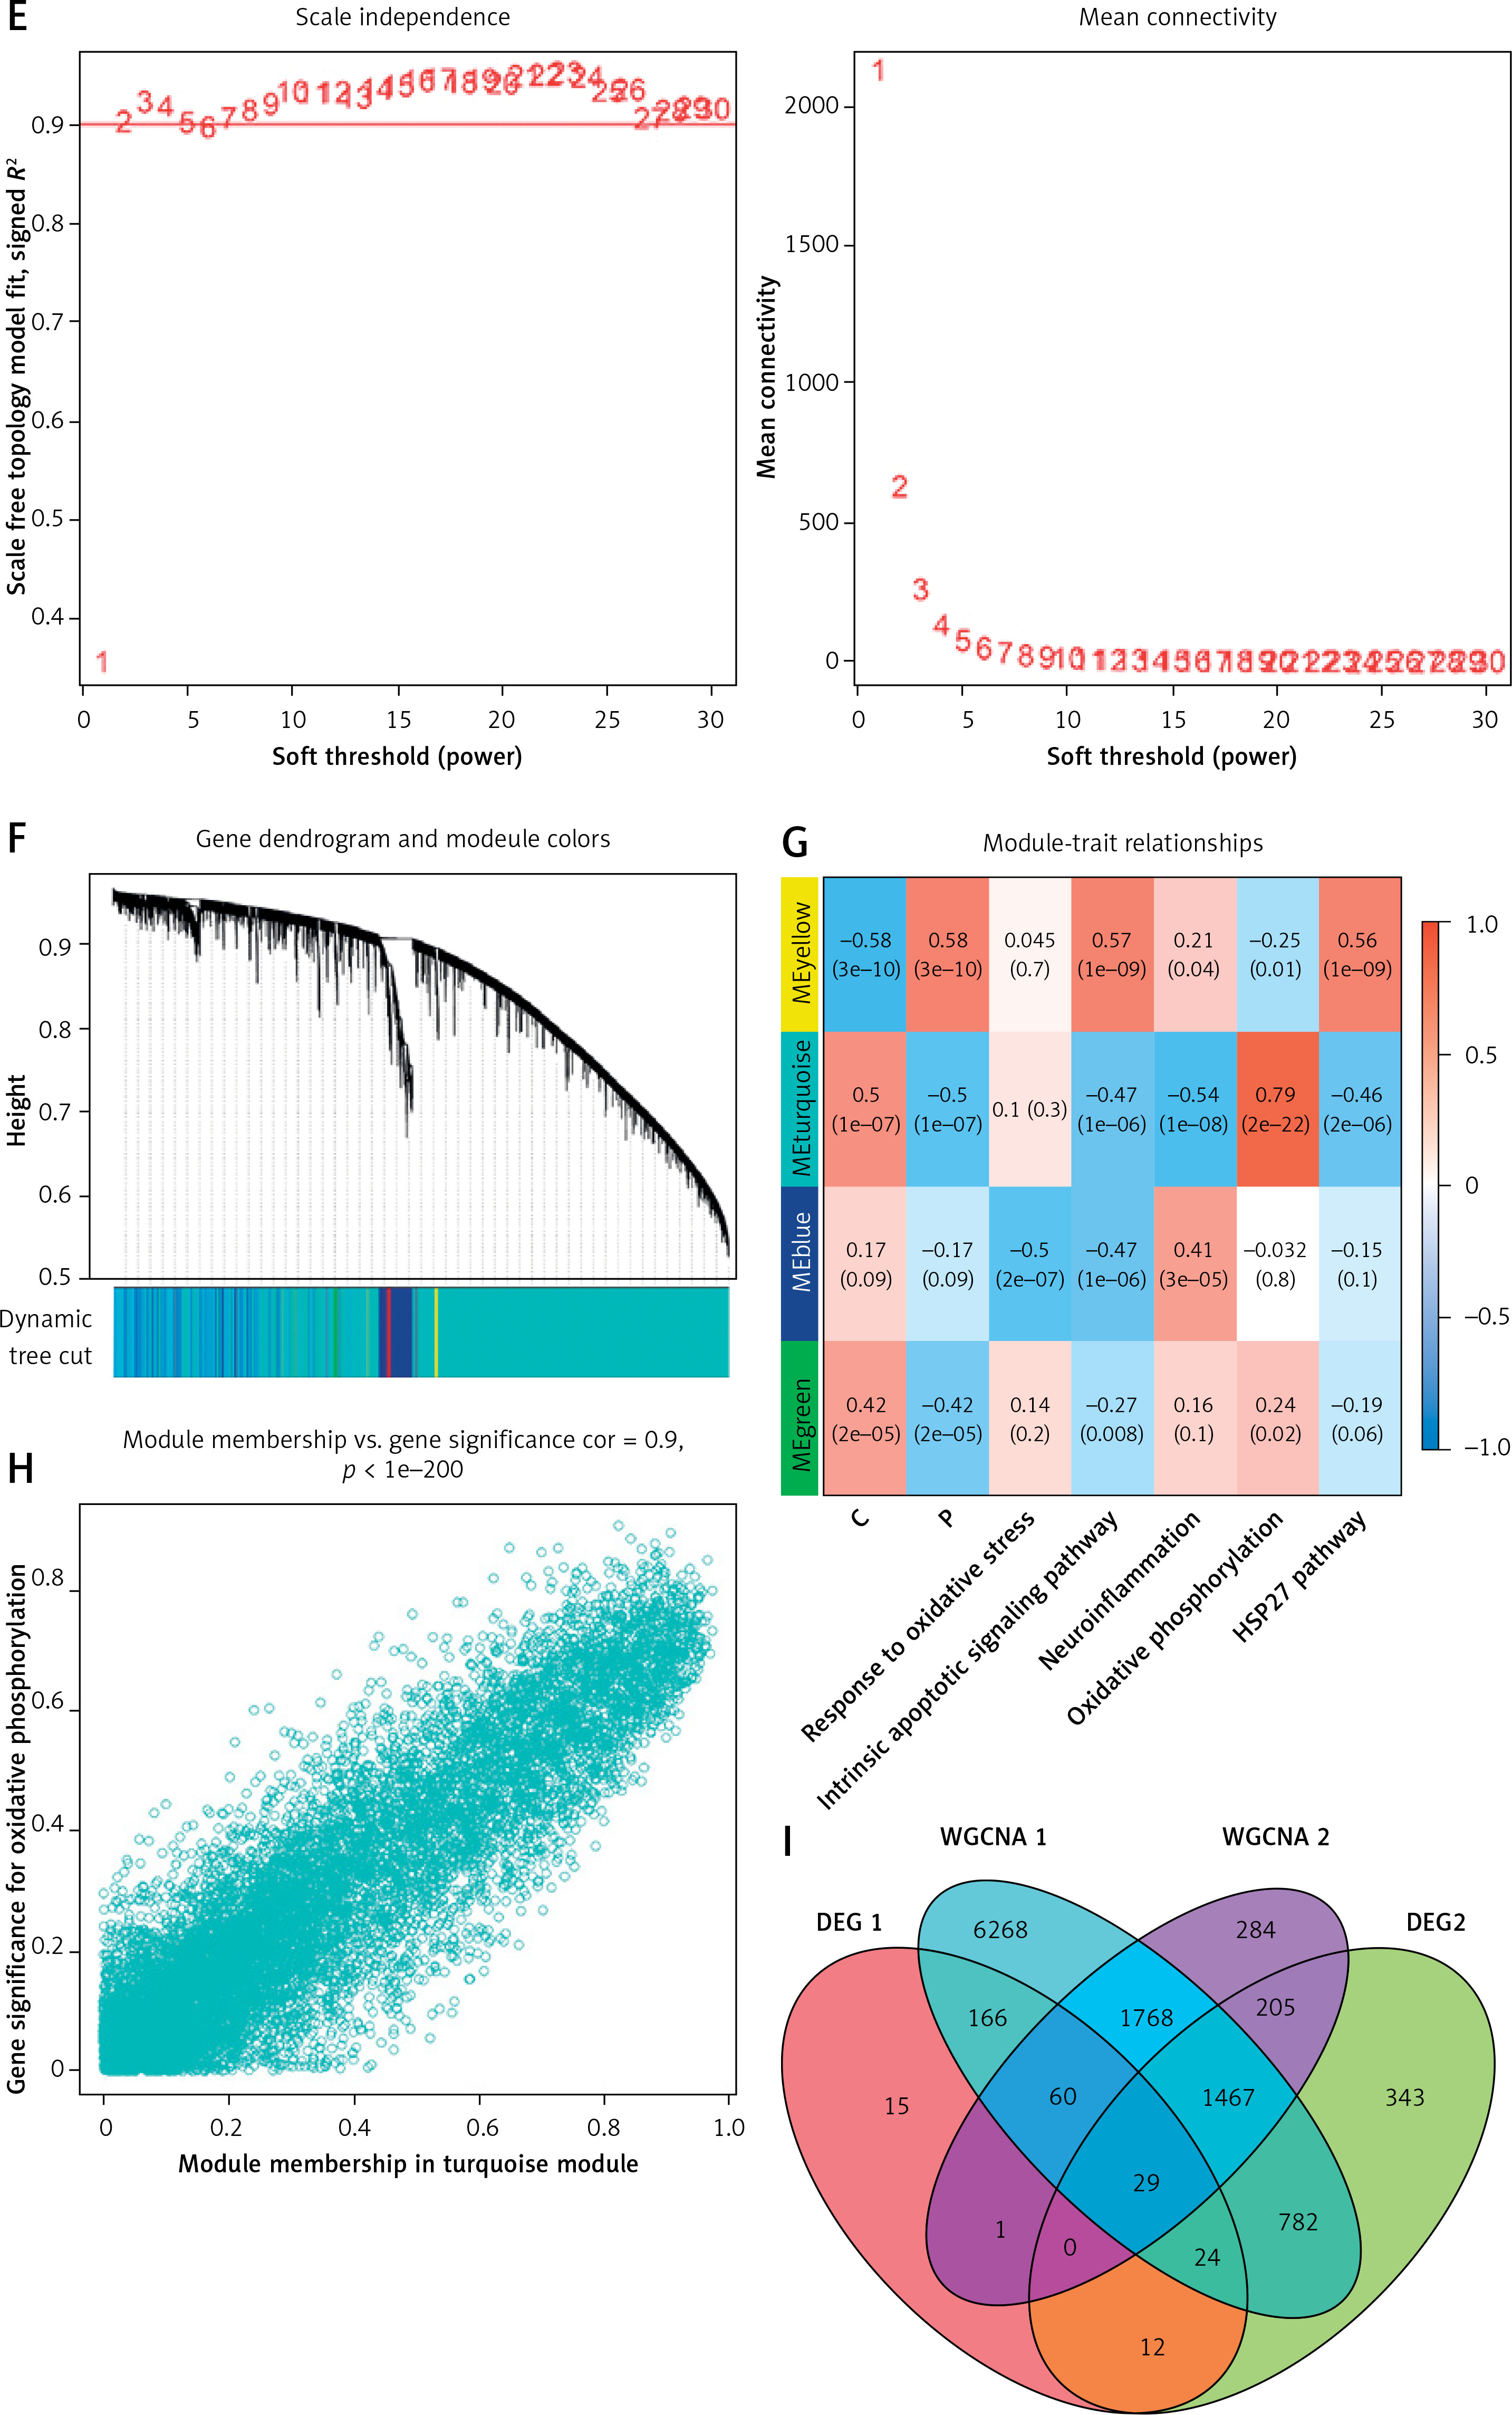
Identification of DEGs in frontal and temporal cortex samples and results of WGCNA. A – Cortex samples displayed after standardization. B – Volcano plot showing the expression characteristics of DEGs, where red represents gene upregulation in the AD group, and blue represents gene upregulation in the normal control group. C – Heat map showing expression of the top 50 DEGs in the cortex samples. D – GSEA (gene set enrichment analysis) of DEGs. E – The left panel shows the scale-free fit index (scale independence, y-axis) as a function of soft threshold power (x-axis); the right panel shows the average connectivity (degree, y-axis) as a function of soft threshold power (x-axis). F – AD module clustering dendrogram based on a dissimilarity measure (1-TOM). The colored squares below the dendrogram represent the module assignment identified by dynamic tree cutting. G – Feature- module correlations. Each column corresponds to a clinical feature, whereas individual rows in the heat map correspond to an ME. Individual cells contain the corresponding p-value and correlation coefficient. H – Scatter plot of OXPHOS pathway correlation with genes in the turquoise module. I – WGCNA module genes mapped to DEGs
Target gene screening using WGCNA
Weighted gene co-expression network analysis was performed on AD cortical samples and control samples. Outliers were removed in the process of sample clustering. Then, the scale-free fit index was adjusted to 0.9, and the minimum soft thresholds for constructing scale-free networks were set at 5 and 2, respectively (Figure 2 E, Supplementary Figure S1 E). Additionally, the minimum number of genes in each module was set at 50, resulting in 4 and 25 modules, respectively (Figure 2 F, Supplementary Figure S1 F). Gene significance (GS) denotes the relationship between samples and module genes. Module membership (MM) denotes the relationship between the module eigen gene and module gene expression values. By calculating GS and MM values, the modules were connected to the passage and clinical features. The MEturquoise module in AD brain cortical samples and the MEblue module in peripheral blood samples showed a strong correlation with both AD and OXPHOS (Figure 2 G, Supplementary Figure S1 G). Figure 2 H and Supplementary Figure S1 H demonstrate the correlation of target module genes with OXPHOS-related genes. Notably, the turquoise module genes correlated extremely well with OXPHOS-related genes (correlation = 0.9, p < 1e-200) (Figure 2 H). Similarly, the genes in the blue module showed a similar correlation (correlation = 0.92, p < 1e-200) (Supplementary Figure S1 H). Finally, the MEturquoise module genes and MEblue module genes were intersected with two DEG sets, yielding 29 target genes associated with both AD and OXPHOS (Figure 2 I).
GO, DO and KEGG enrichment analyses for the target genes
To study the biological functions (BFs) and related diseases of the target genes, GO, DO, and KEGG enrichment analyses were performed. By GO analysis, we discovered that these genes are engaged in a range of functions, including regulation of macrophage activation. Furthermore, they are involved in many MFs, such as SH3 domain binding and adenylate cyclase binding, and are associated with several CCs, such as cytoplasmic side of plasma membrane and extrinsic component of cytoplasmic side of plasma membrane (Supplementary Figures S2 A–C). Correspondingly, according to the results of the KEGG enrichment analysis, these target genes were predominantly enriched by diseases and signaling pathways such as amyotrophic lateral sclerosis (ALS), pathways of neurodegeneration – multiple diseases and GABAergic synapse (Supplementary Figure S2 D). According to DO analysis, the target genes were linked to such conditions as craniosynostosis and neurodegenerative diseases including PD and ALS (Supplementary Figure S2 E).
Machine learning algorithm-based biomarker screening in the cerebral cortex of AD patients
This study used 2 machine learning techniques to further investigate putative AD biomarkers in 29 target genes. The LASSO regression model was created using both control and AD samples. The λ analysis revealed that when λ = 18, the model could correctly forecast AD. Consequently, LASSO analysis produced 18 potential biomarkers (Figure 3 A, Table I). Additionally, in the random forest results, 8 genes with a MeanDecreaseGini greater than 3 were selected as candidate biomarkers (Figure 3 B, Table II). Finally, combining the results of the 2 algorithms yielded RBM3, GOLGA8A, ALS2, FSD2, and LOC100287628 in the cerebral cortex as potential biomarkers associated with AD (Figure 3 C).
Figure 3
Screening of potential biomarkers by 2 types of machine learning algorithms. A – LASSO regression model. B – The left panel shows the random forest model; the right panel shows the 7 genes in order of importance. C – The intersection of the results of the 2 types of machine learning algorithms
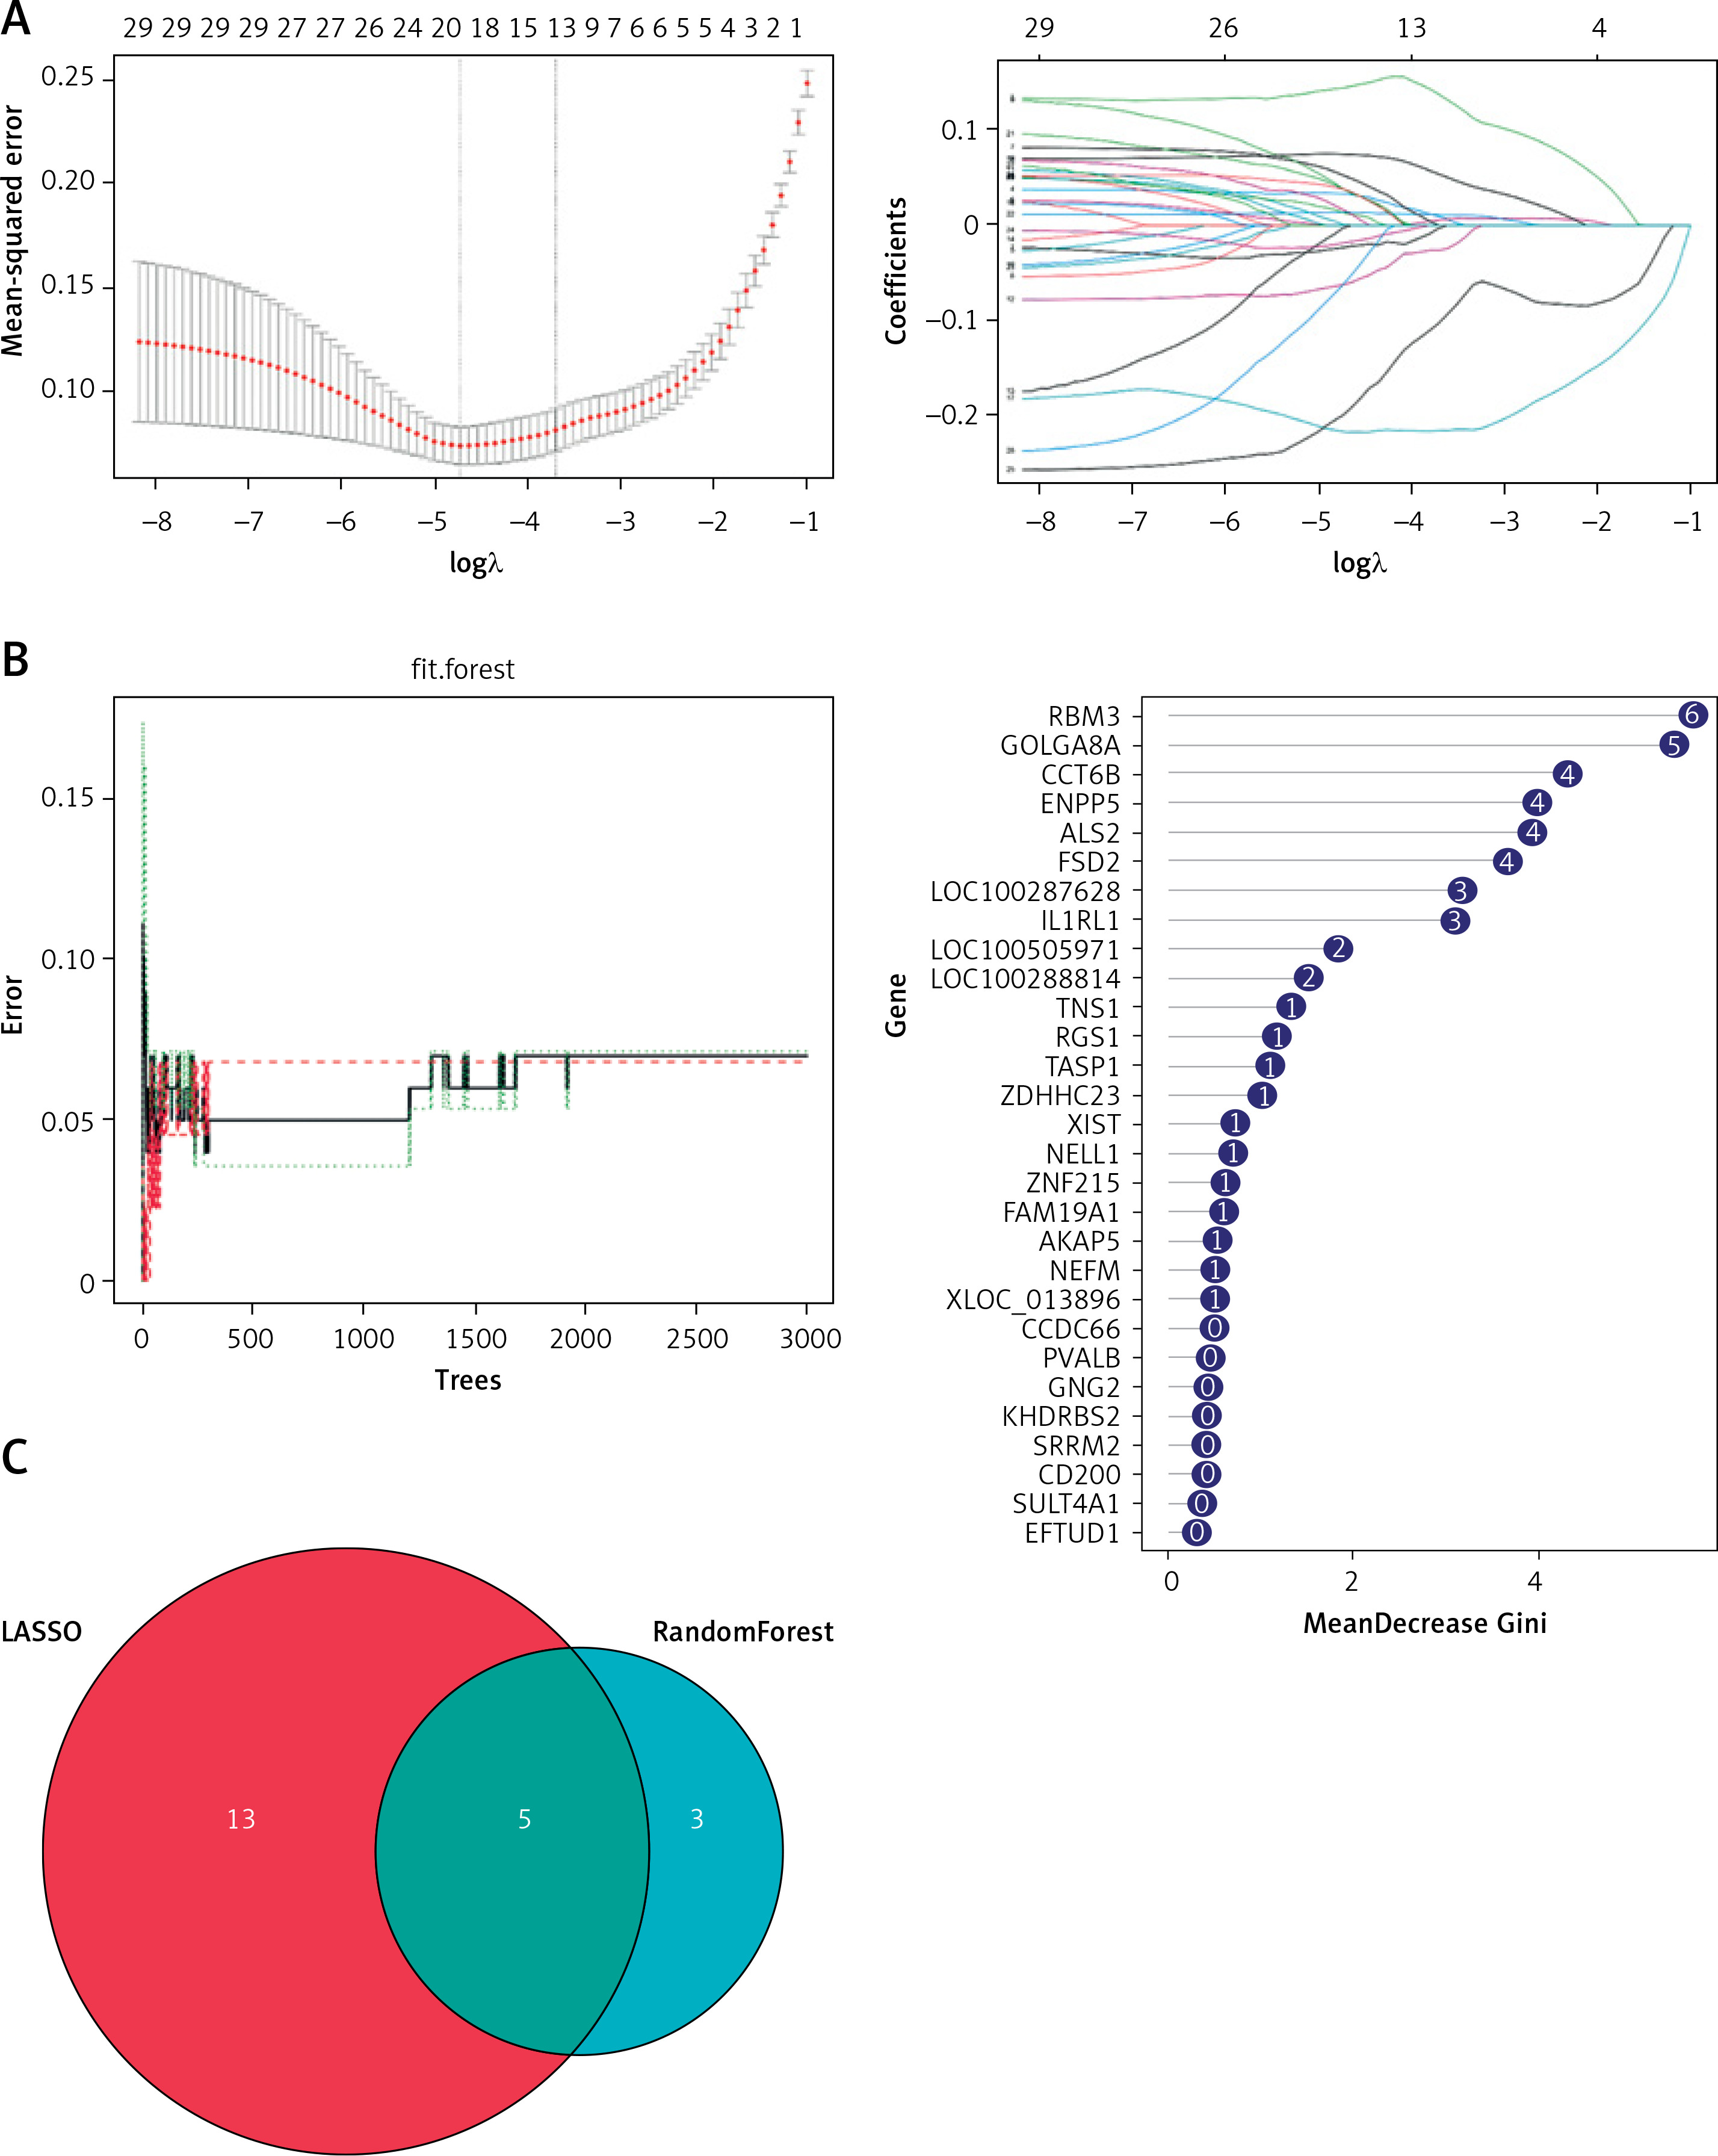
Table I
Results of LASSO analysis
Table II
Results of random forest analysis
Correlation between potential biomarkers and GSEA
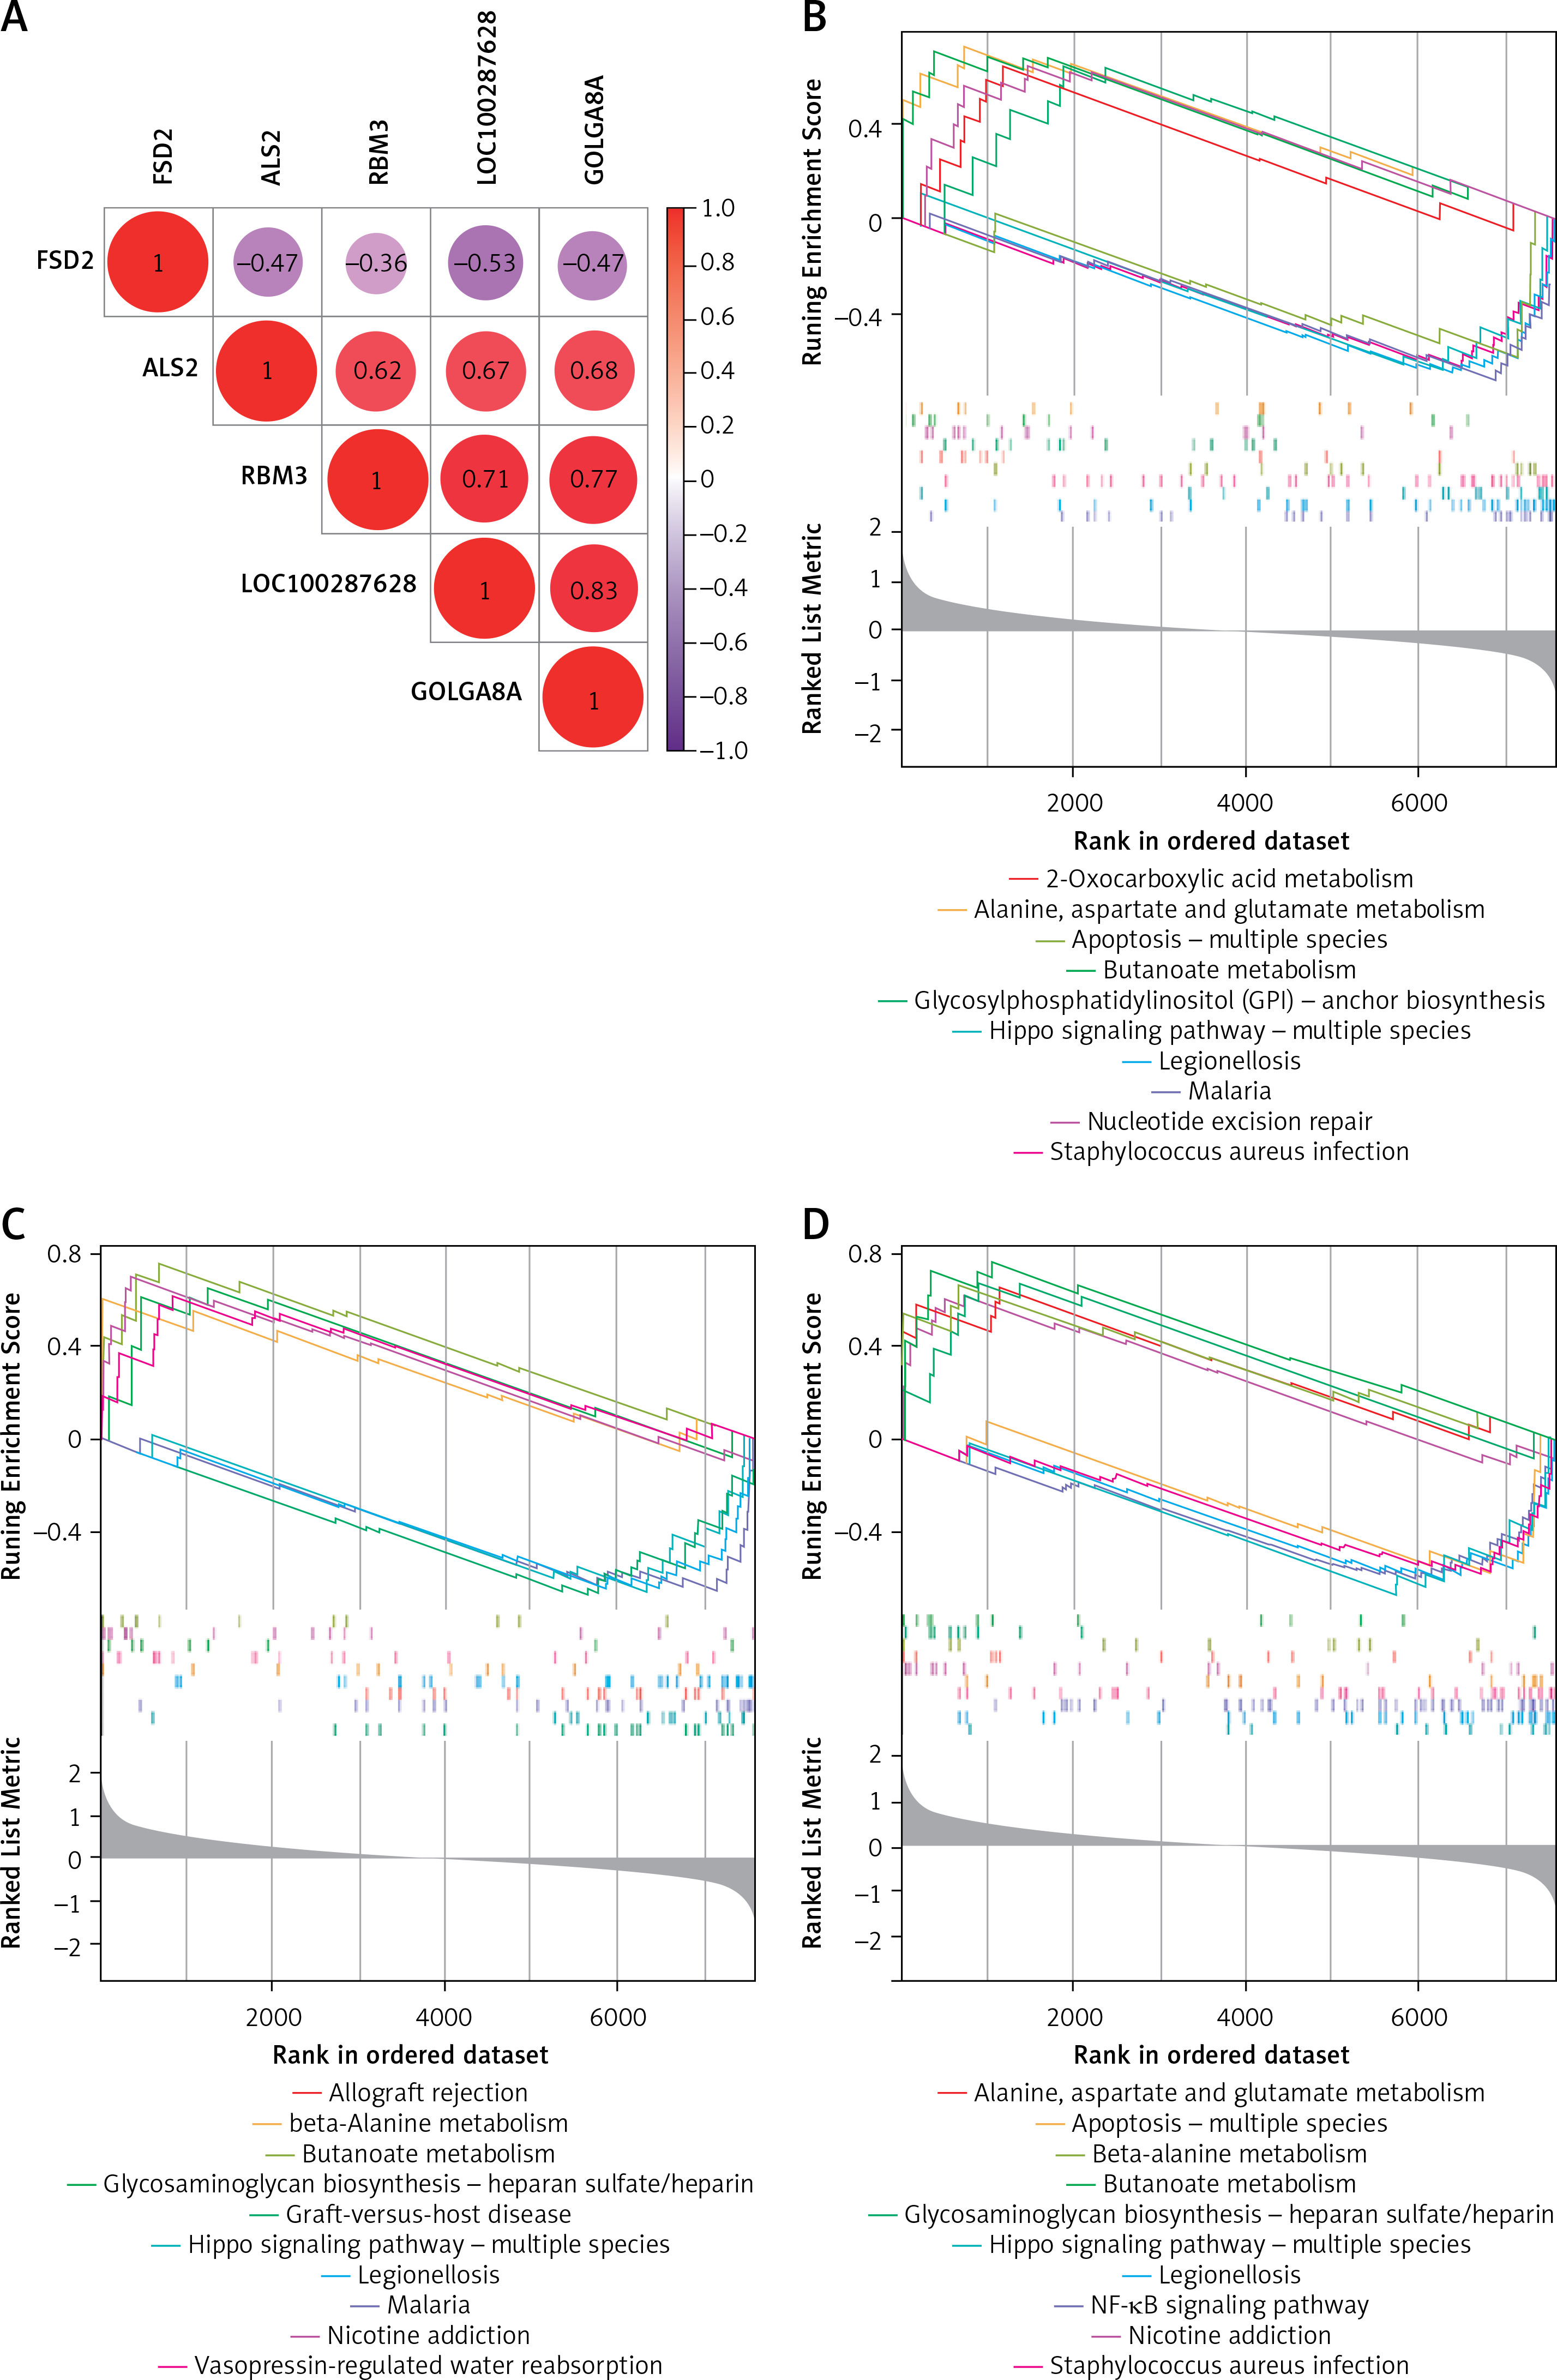
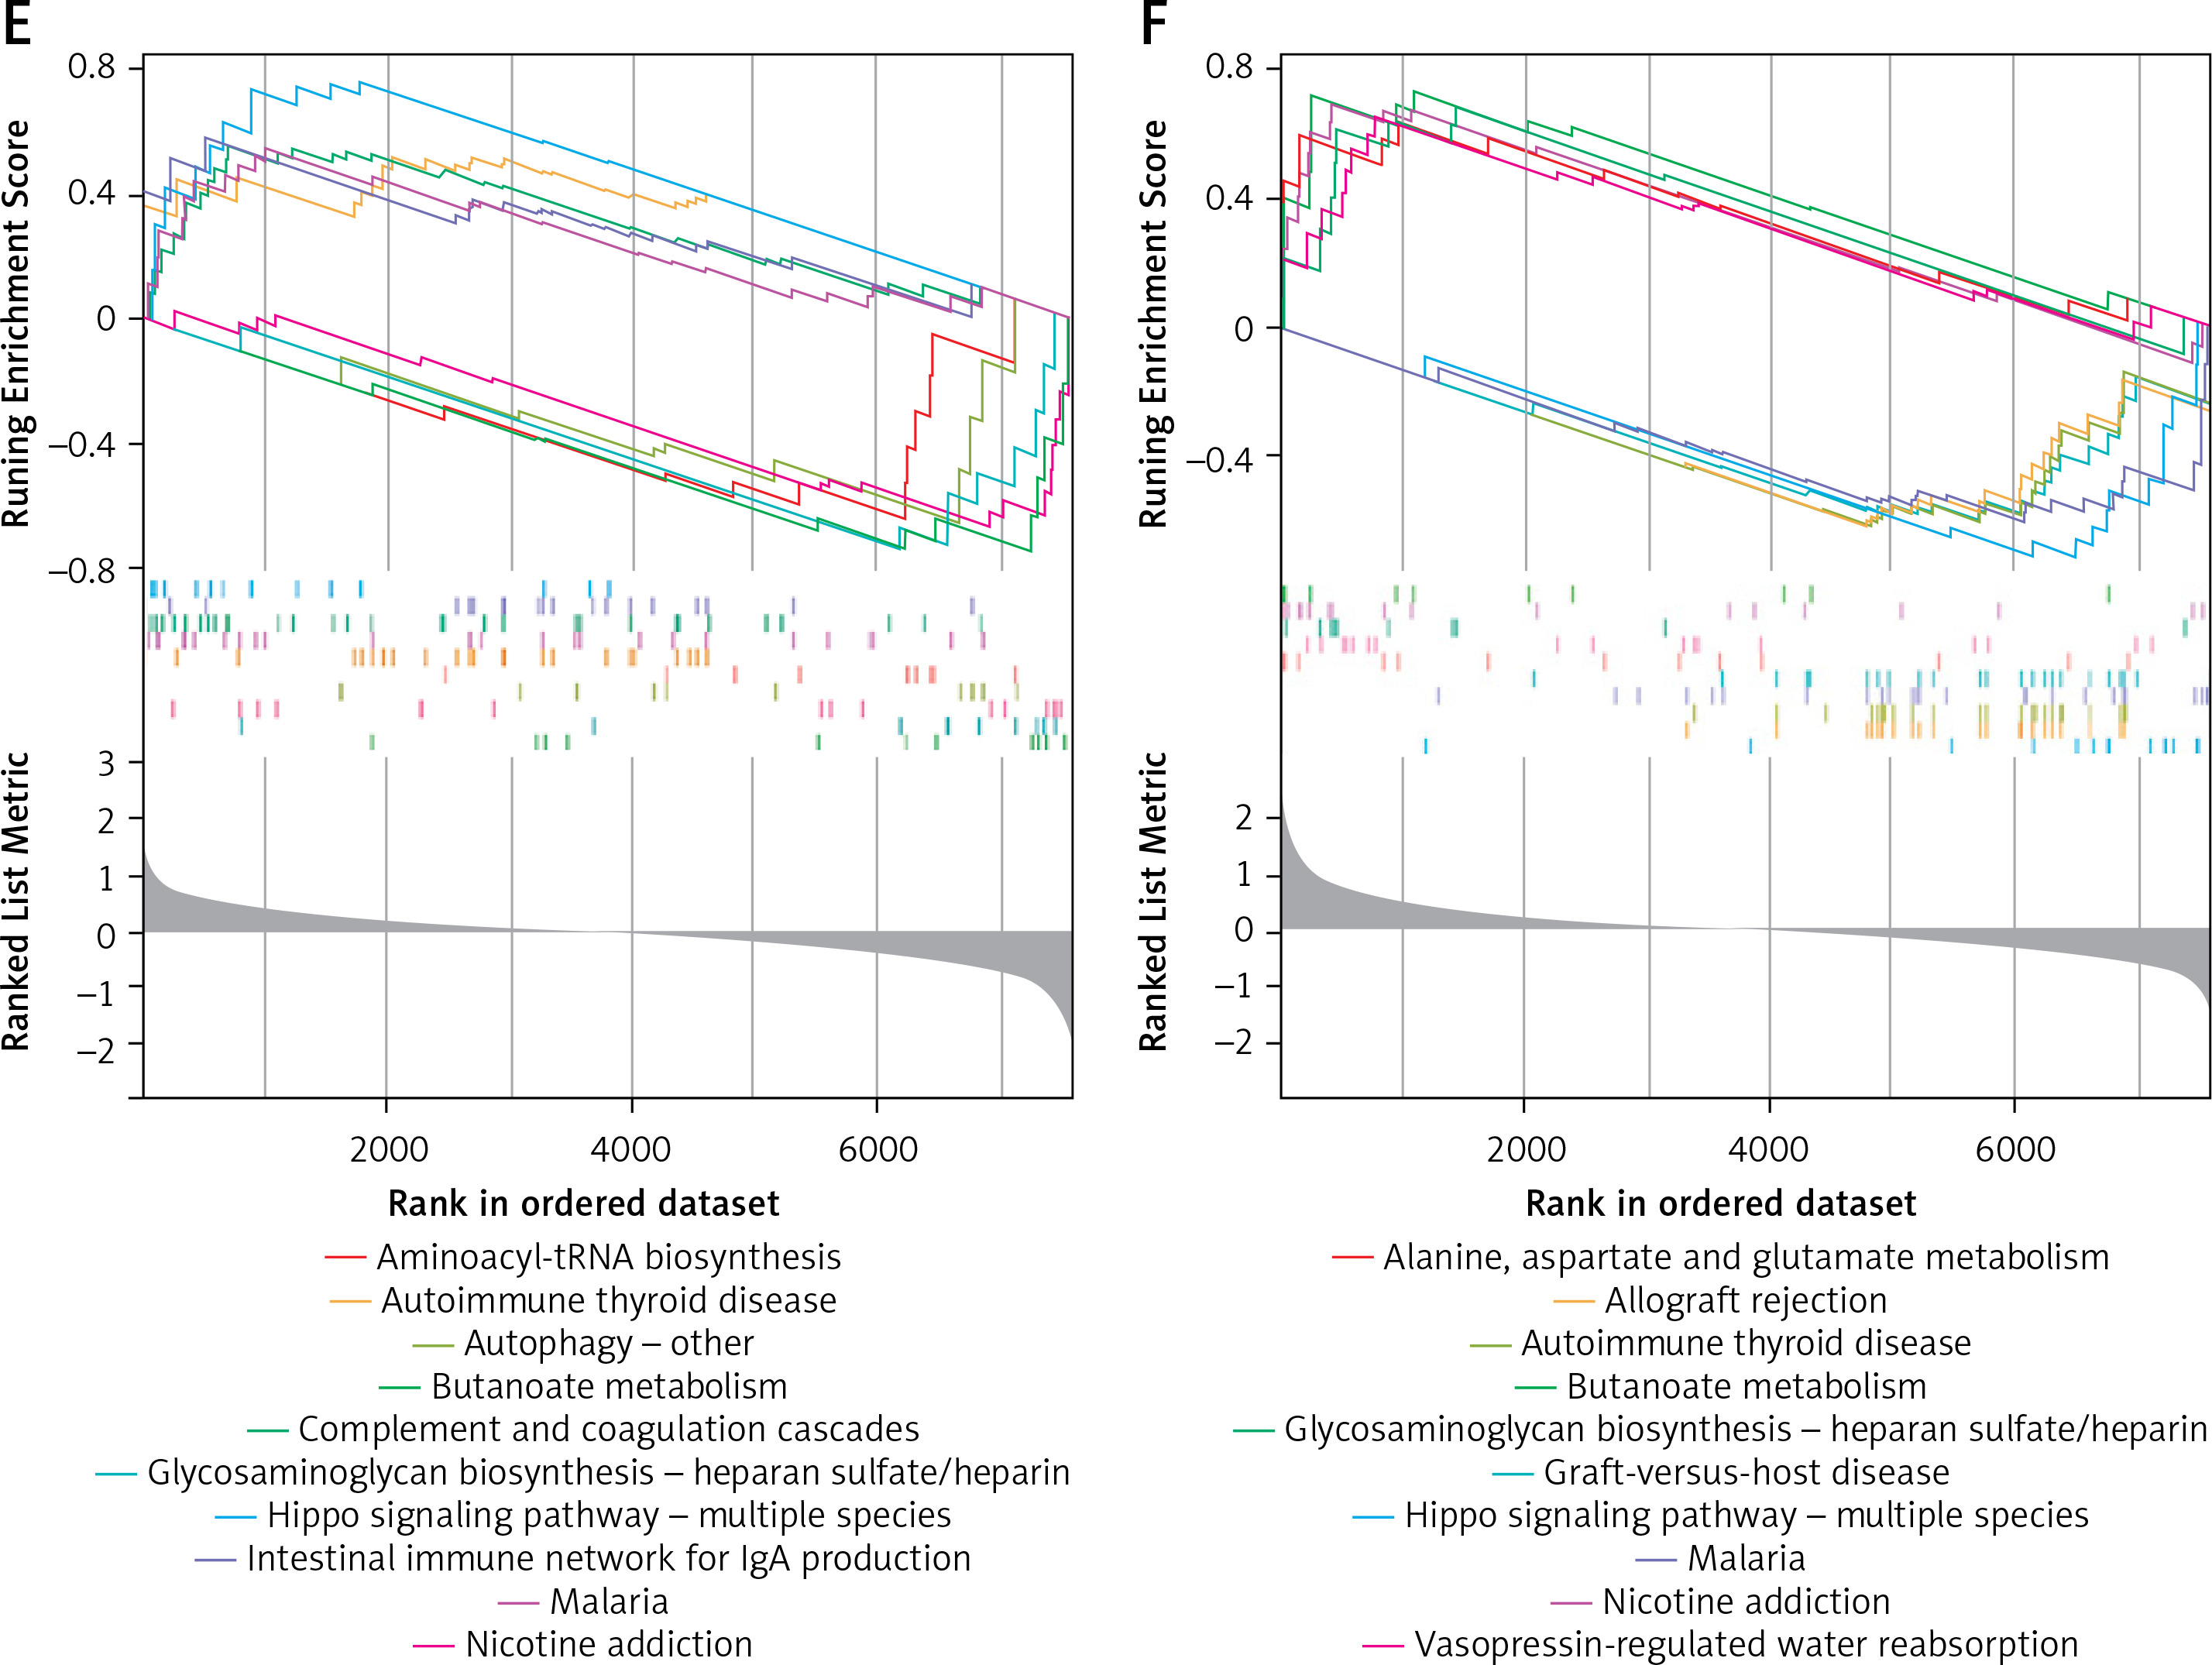
The correlation analysis of potential biomarkers showed a negative correlation between FSD2 and ALS2, RBM3, GOLGA8A and LOC100287628 (Figure 4 A). Then, these 5 potential biomarkers were subjected to GSEA functional analysis, and we identified several pathways, including alanine, aspartate and glutamate metabolism pathways, hippo signaling pathway – multiple species, which closely matched the outcomes of the DEG functional analysis. Figures 4 B–F displays the outcomes of the GSEA functional analysis of the 5 potential biomarkers. In addition, there are some biological functions that are highly associated with these biomarkers, such as apoptosis and the NF-κB signaling pathway, suggesting that these genes may be involved in the inflammatory response, cell proliferation, differentiation and survival [36], and play a significant role in AD through these pathways.
Cell quality control, cell annotation and biomarker expression analysis
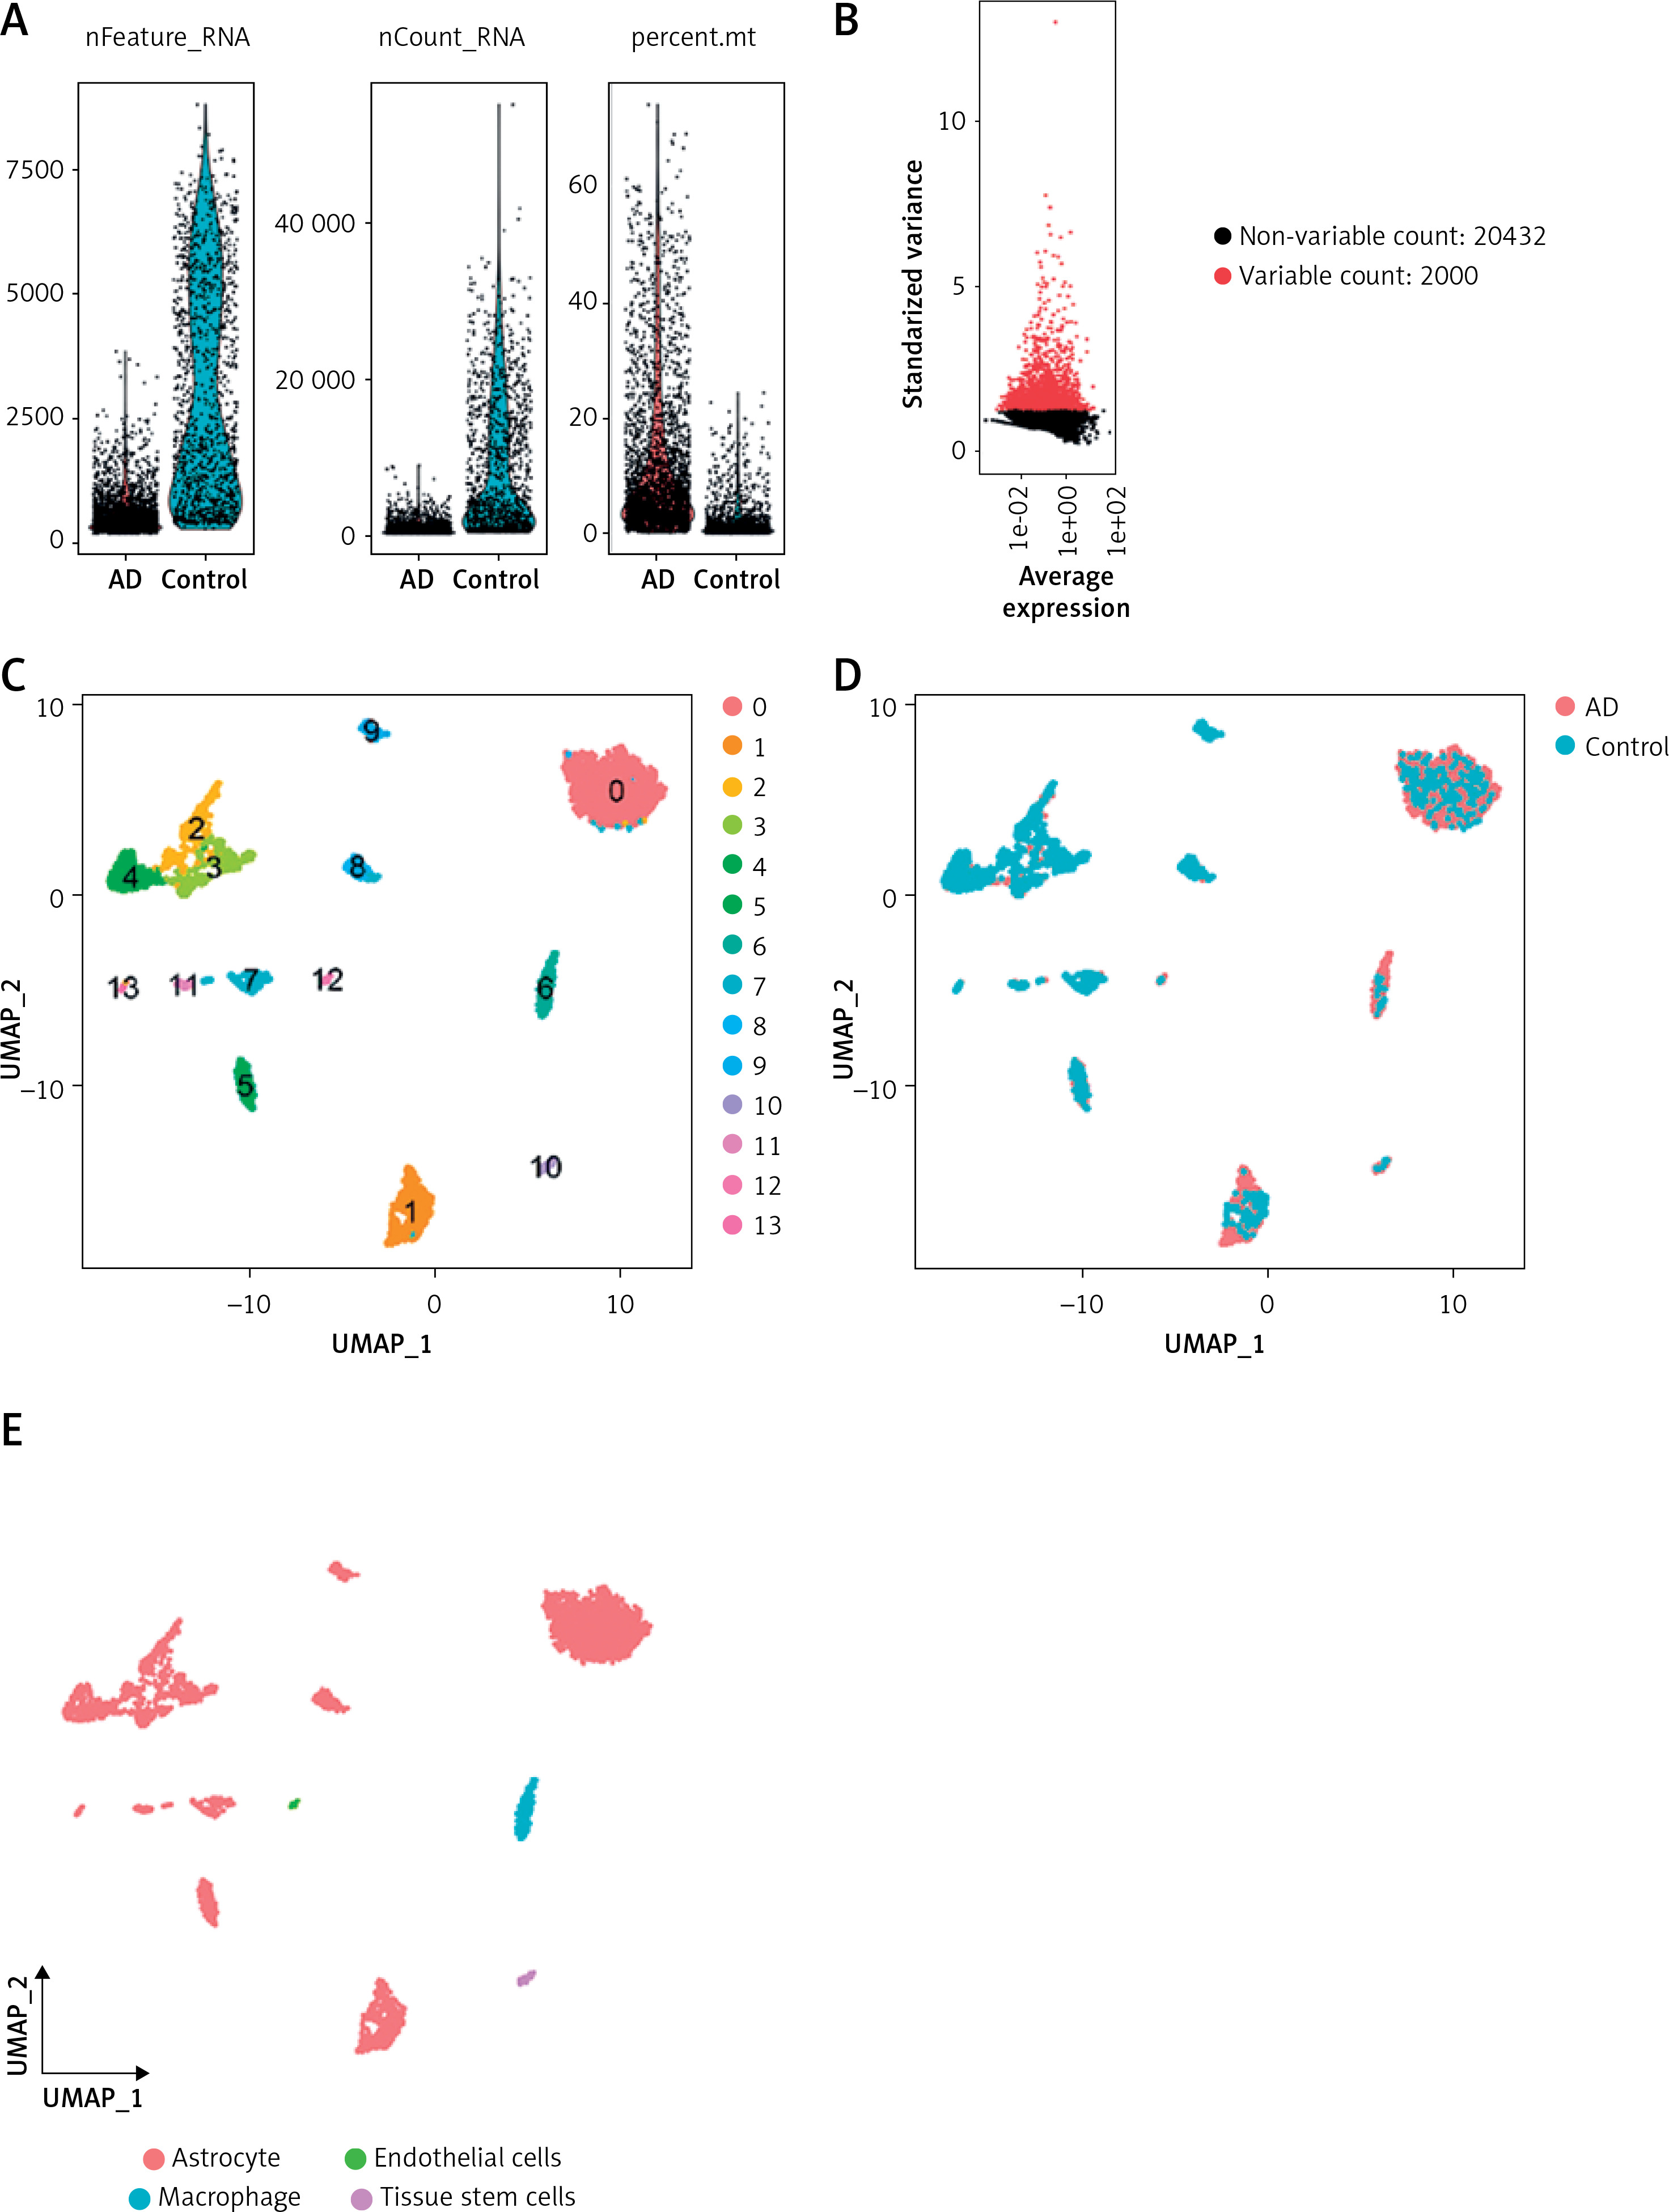
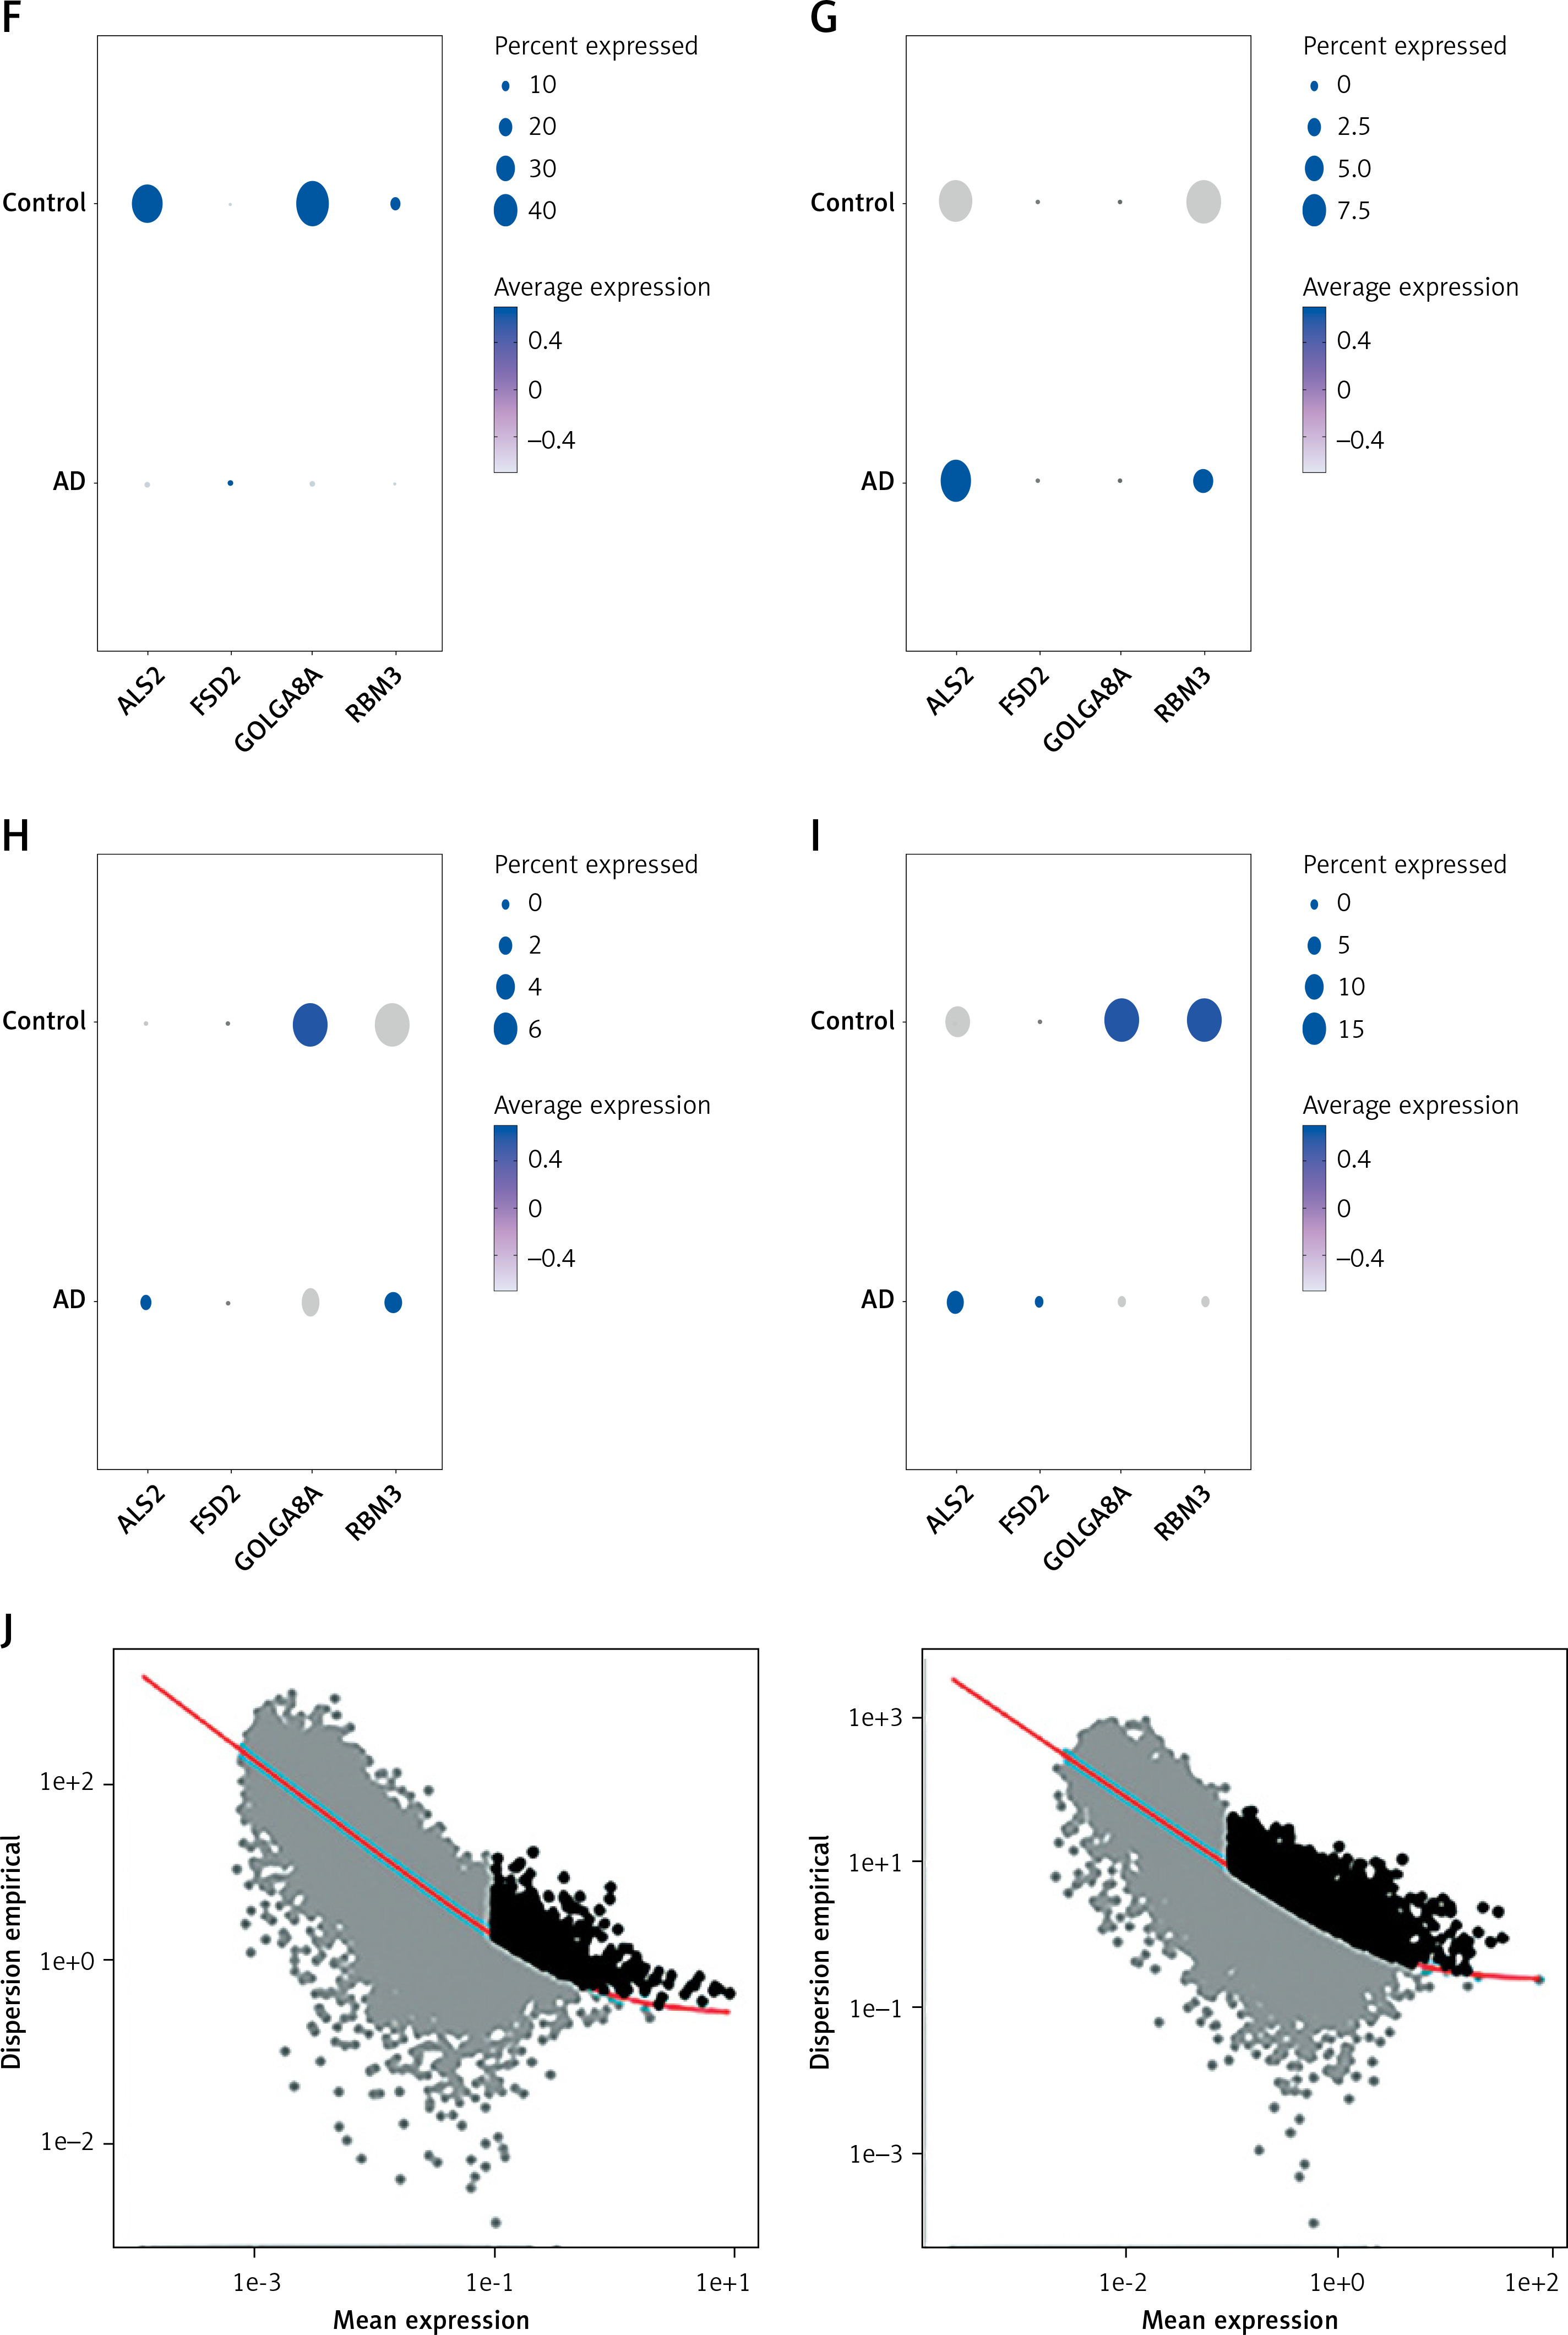
In the current study, 3594 cells from the AD and normal control samples of GSE188545 were used to generate the scRNA-seq data. The range of the number of genes detected, the level of sequencing, and the proportion of mitochondria in each sample were all within acceptable bounds (Figure 5 A). Following data normalization, the top 2000 highly variable genes (HVGs) were chosen (Figure 5 B). The PCA method and Harmony software package were used to reduce dimensions and remove batch effects (Figure 5 D), and the cells were finally classified into 14 clusters (Figure 5 C). With the SingleR package to annotate the cells, we classified the cells into 4 subclusters, namely astrocytes, endothelial cells, macrophages, and tissue stem cells (Figure 5 E). By separating AD samples from normal samples, we analyzed the differences in expression of four potential biomarkers – ALS2, FSD2, GOLGA8A and RBM3 – between the two samples (LOC100287628 was not analyzed as we did not have a gene symbol for it). The results showed lower expression of ALS2 and GOLGA8A in astrocytes (Figure 5 F); expression of ALS and RBM3 was higher in endothelial cells (Figure 5 G); GOLGA8A expression was lower in macrophages (Figure 5 H); and GOLGA8A and RBM3 showed lower expression in tissue stem cells (Figure 5 I) of AD samples compared with the control samples. Differential expression of potential biomarkers in different cells may be a potential mechanism for causing AD.
Figure 5
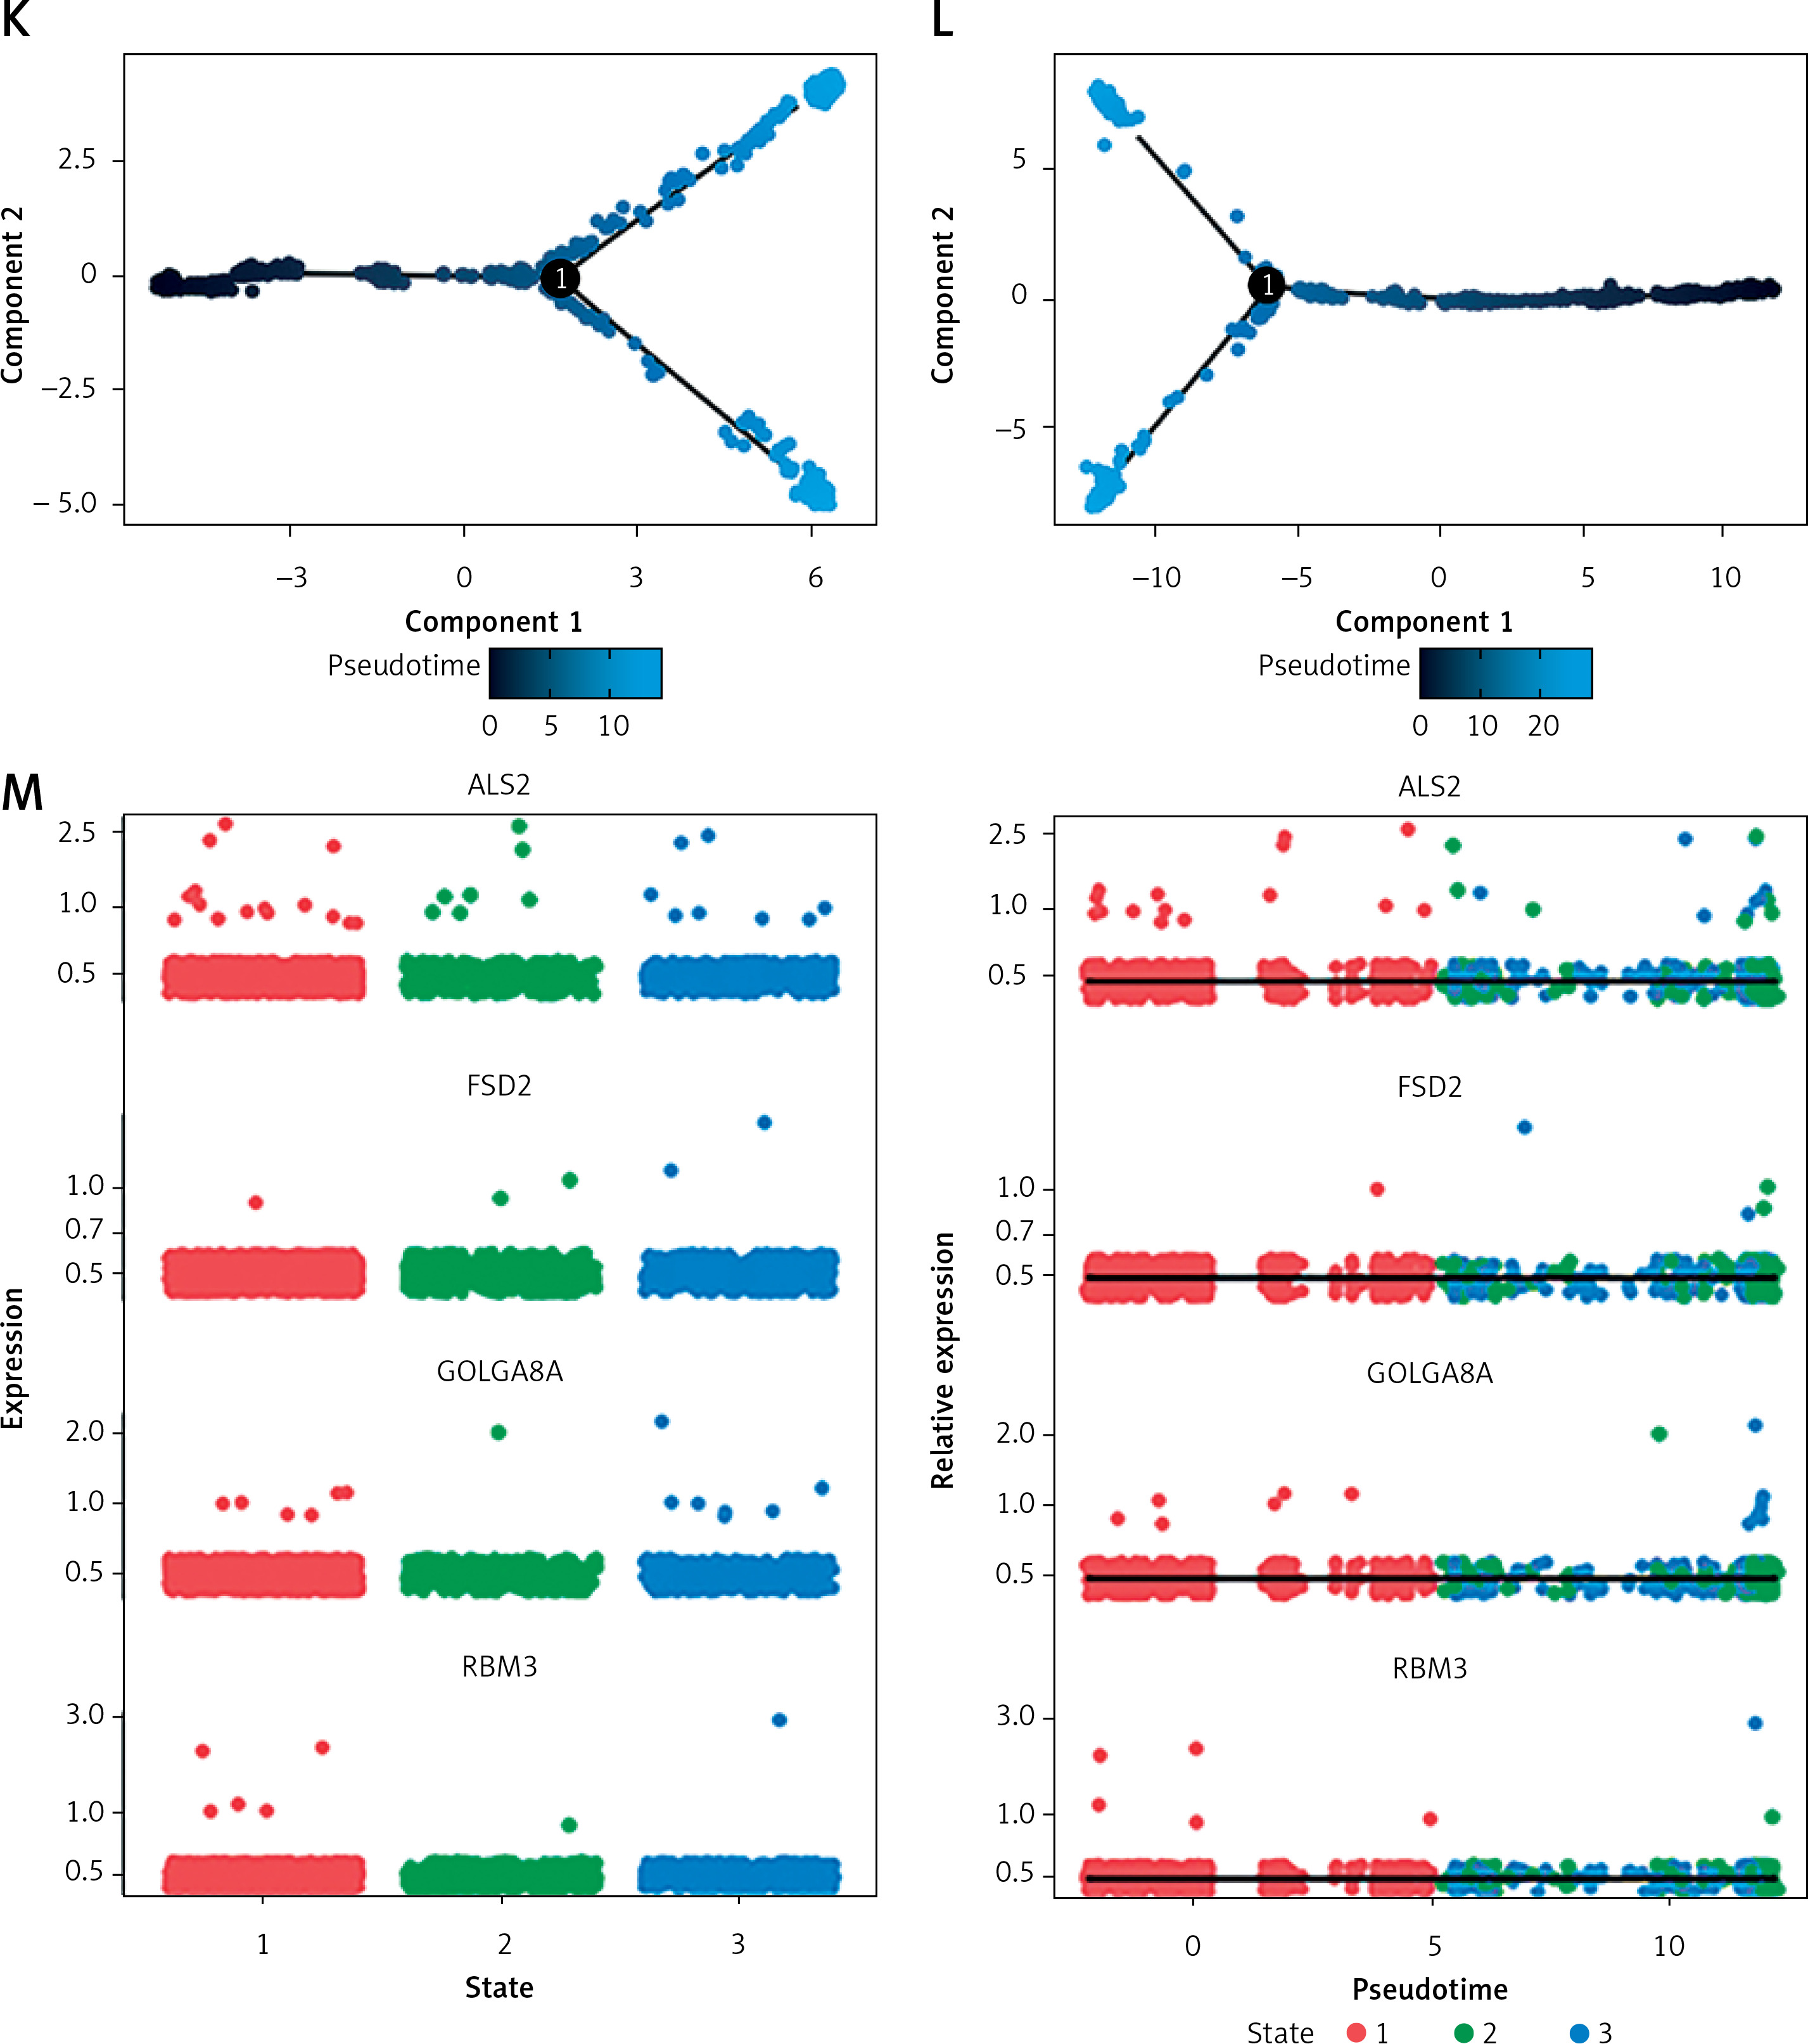
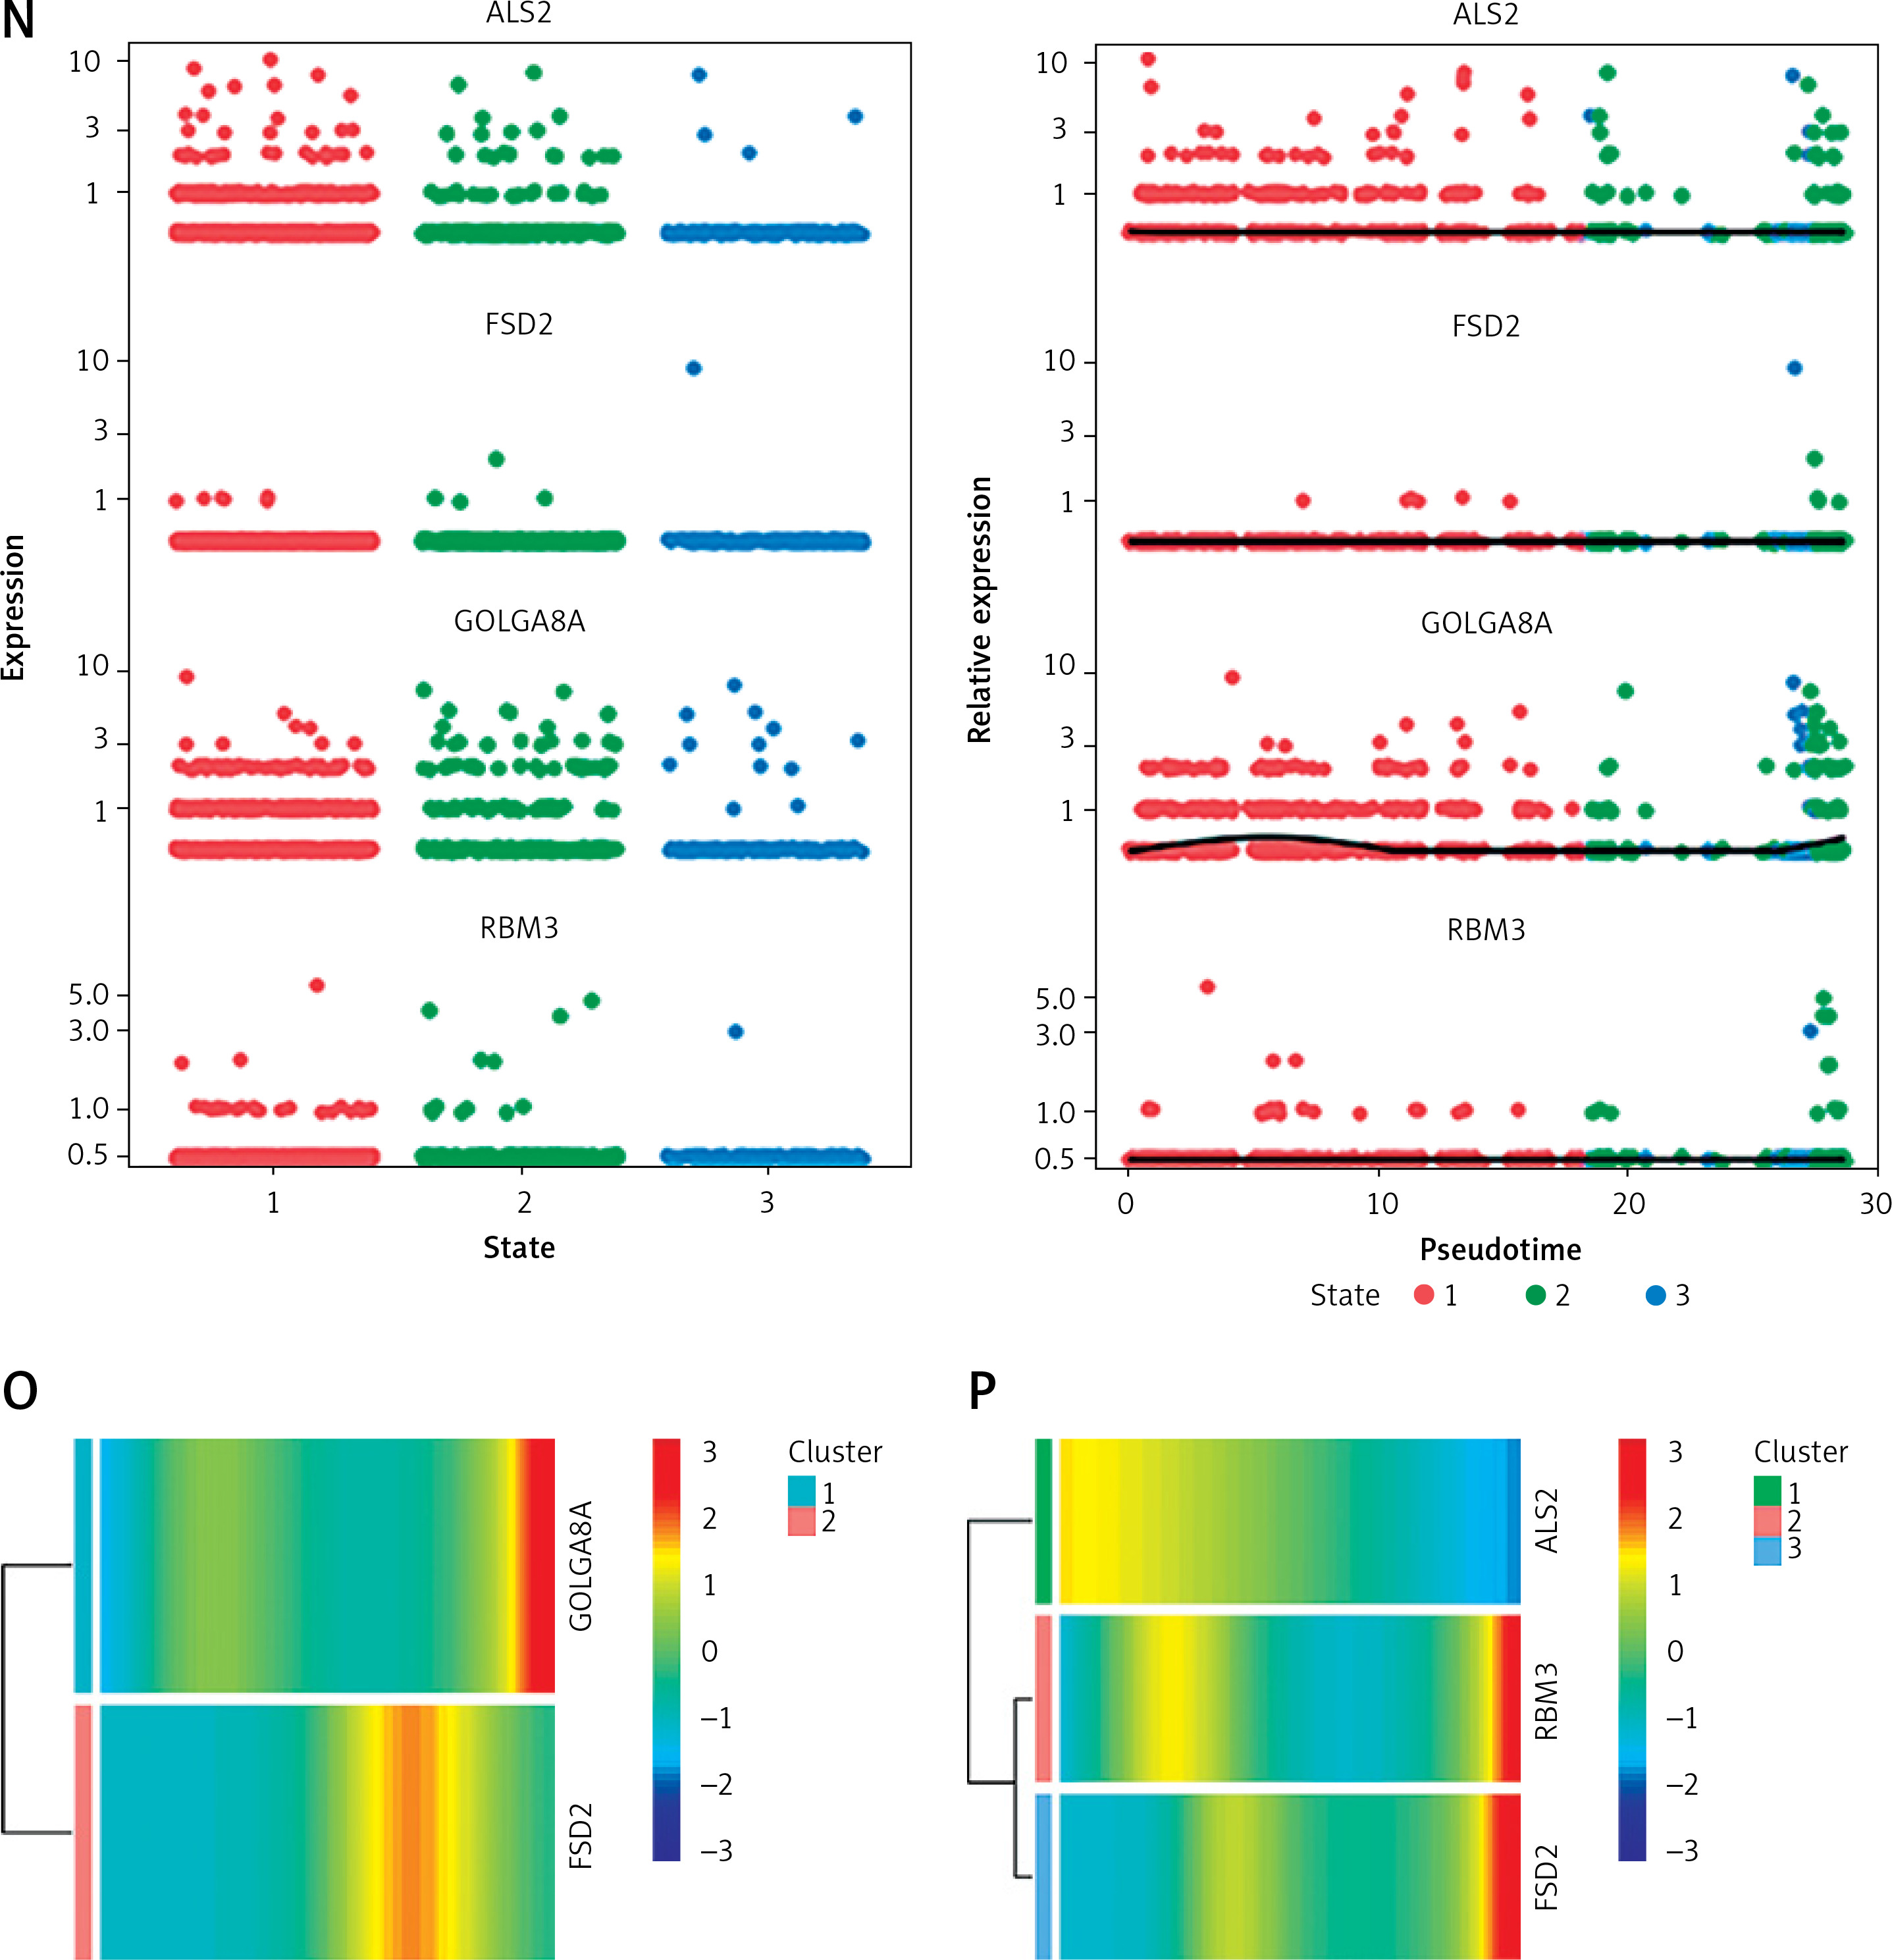
Results of single-cell analysis and trajectory analysis. A – Quality control of scRNA-seq data from AD samples (human brain middle temporal gyrus). B – Variance plot showing 20,432 genes in all cells, with red dots representing the top 2,000 highly variable genes. The 8 most highly variable genes were labeled. C – Visualization of 14 clusters using the UMAP algorithm. D – Visualization of cells after removal of batch effects. E – Cell subclusters identification. F-I – Differential expression of potential biomarkers in 4 types of cells in AD versus normal control. F – Astrocyte, G – endothelial cells, H – macrophage, I – tissue stem cells. J – Dimensionality reduction in trajectory analysis of cells from AD and control samples (above, AD; below, control). K, L – Trajectory plot of Monocle 2 shows the dynamics of the astrocyte of AD (K) and control (L) samples and their pseudotime curve. M – Variation in expression of potential biomarkers in different astrocyte states (M – AD). N – Variation in expression of potential biomarkers in different astrocyte states (N – control). O, P – Significance analysis of potential biomarkers’ change along the pseudotime (q value < 0.1). (O – AD; P – control)
Trajectory of astrocyte in AD
Due to the high content of astrocytes in the current single-cell data and the low risk of analysis bias, we selected astrocytes for trajectory analysis. Subsequently, after reducing the dimensionality of astrocytes according to different genes (Figure 5 J), we visualized the trajectory of astrocyte distribution with pseudotime. Both trajectory analyses yielded 1 key time node, and we divided the astrocytes into 3 cell states by dividing the time node (Figures 5 K, L). By analyzing the changes in expression of potential biomarkers across astrocyte states (Figures 5 M, N) and calculating the significance of changes in marker expression with pseudotime (Figures 5 O, P), we found significant changes in the expression of GOLGA8A and FSD2 in AD samples and ALS2, RBM3 and FSD2 in control samples.
Regulatory mechanisms and relevance of potential biomarkers
TFs are engaged in the transcription of genes, while one or more miRNAs show fine regulation of gene expression. By constructing the miRNA-mRNA network and TF-mRNA network, we clarified the regulatory relevance of potential biomarkers and searched for the most important potential biomarkers. The results of network construction suggest that RBM3, GOLGA8A and ALS2 may be regulated by the same miRNAs, such as has-mir-101-3p, hsa-mir-23b-3p, hsa-mir-30b-5p, hsa-mir-30c-5p, hsa-mir-124-3p, hsa-mir-16-5p and hsa-mir-129-2-3p (Supplementary Figure S3 A). Meanwhile, RBM3, GOLGA8A, ALS2 and FSD2 were regulated by the same TFs, such as CREM, STAT4, MTF2, TBP and GATA1, while E2F1 may be involved in the regulation of these four genes (Supplementary Figure S3 B).
Clinical diagnostic evaluation of key potential biomarkers
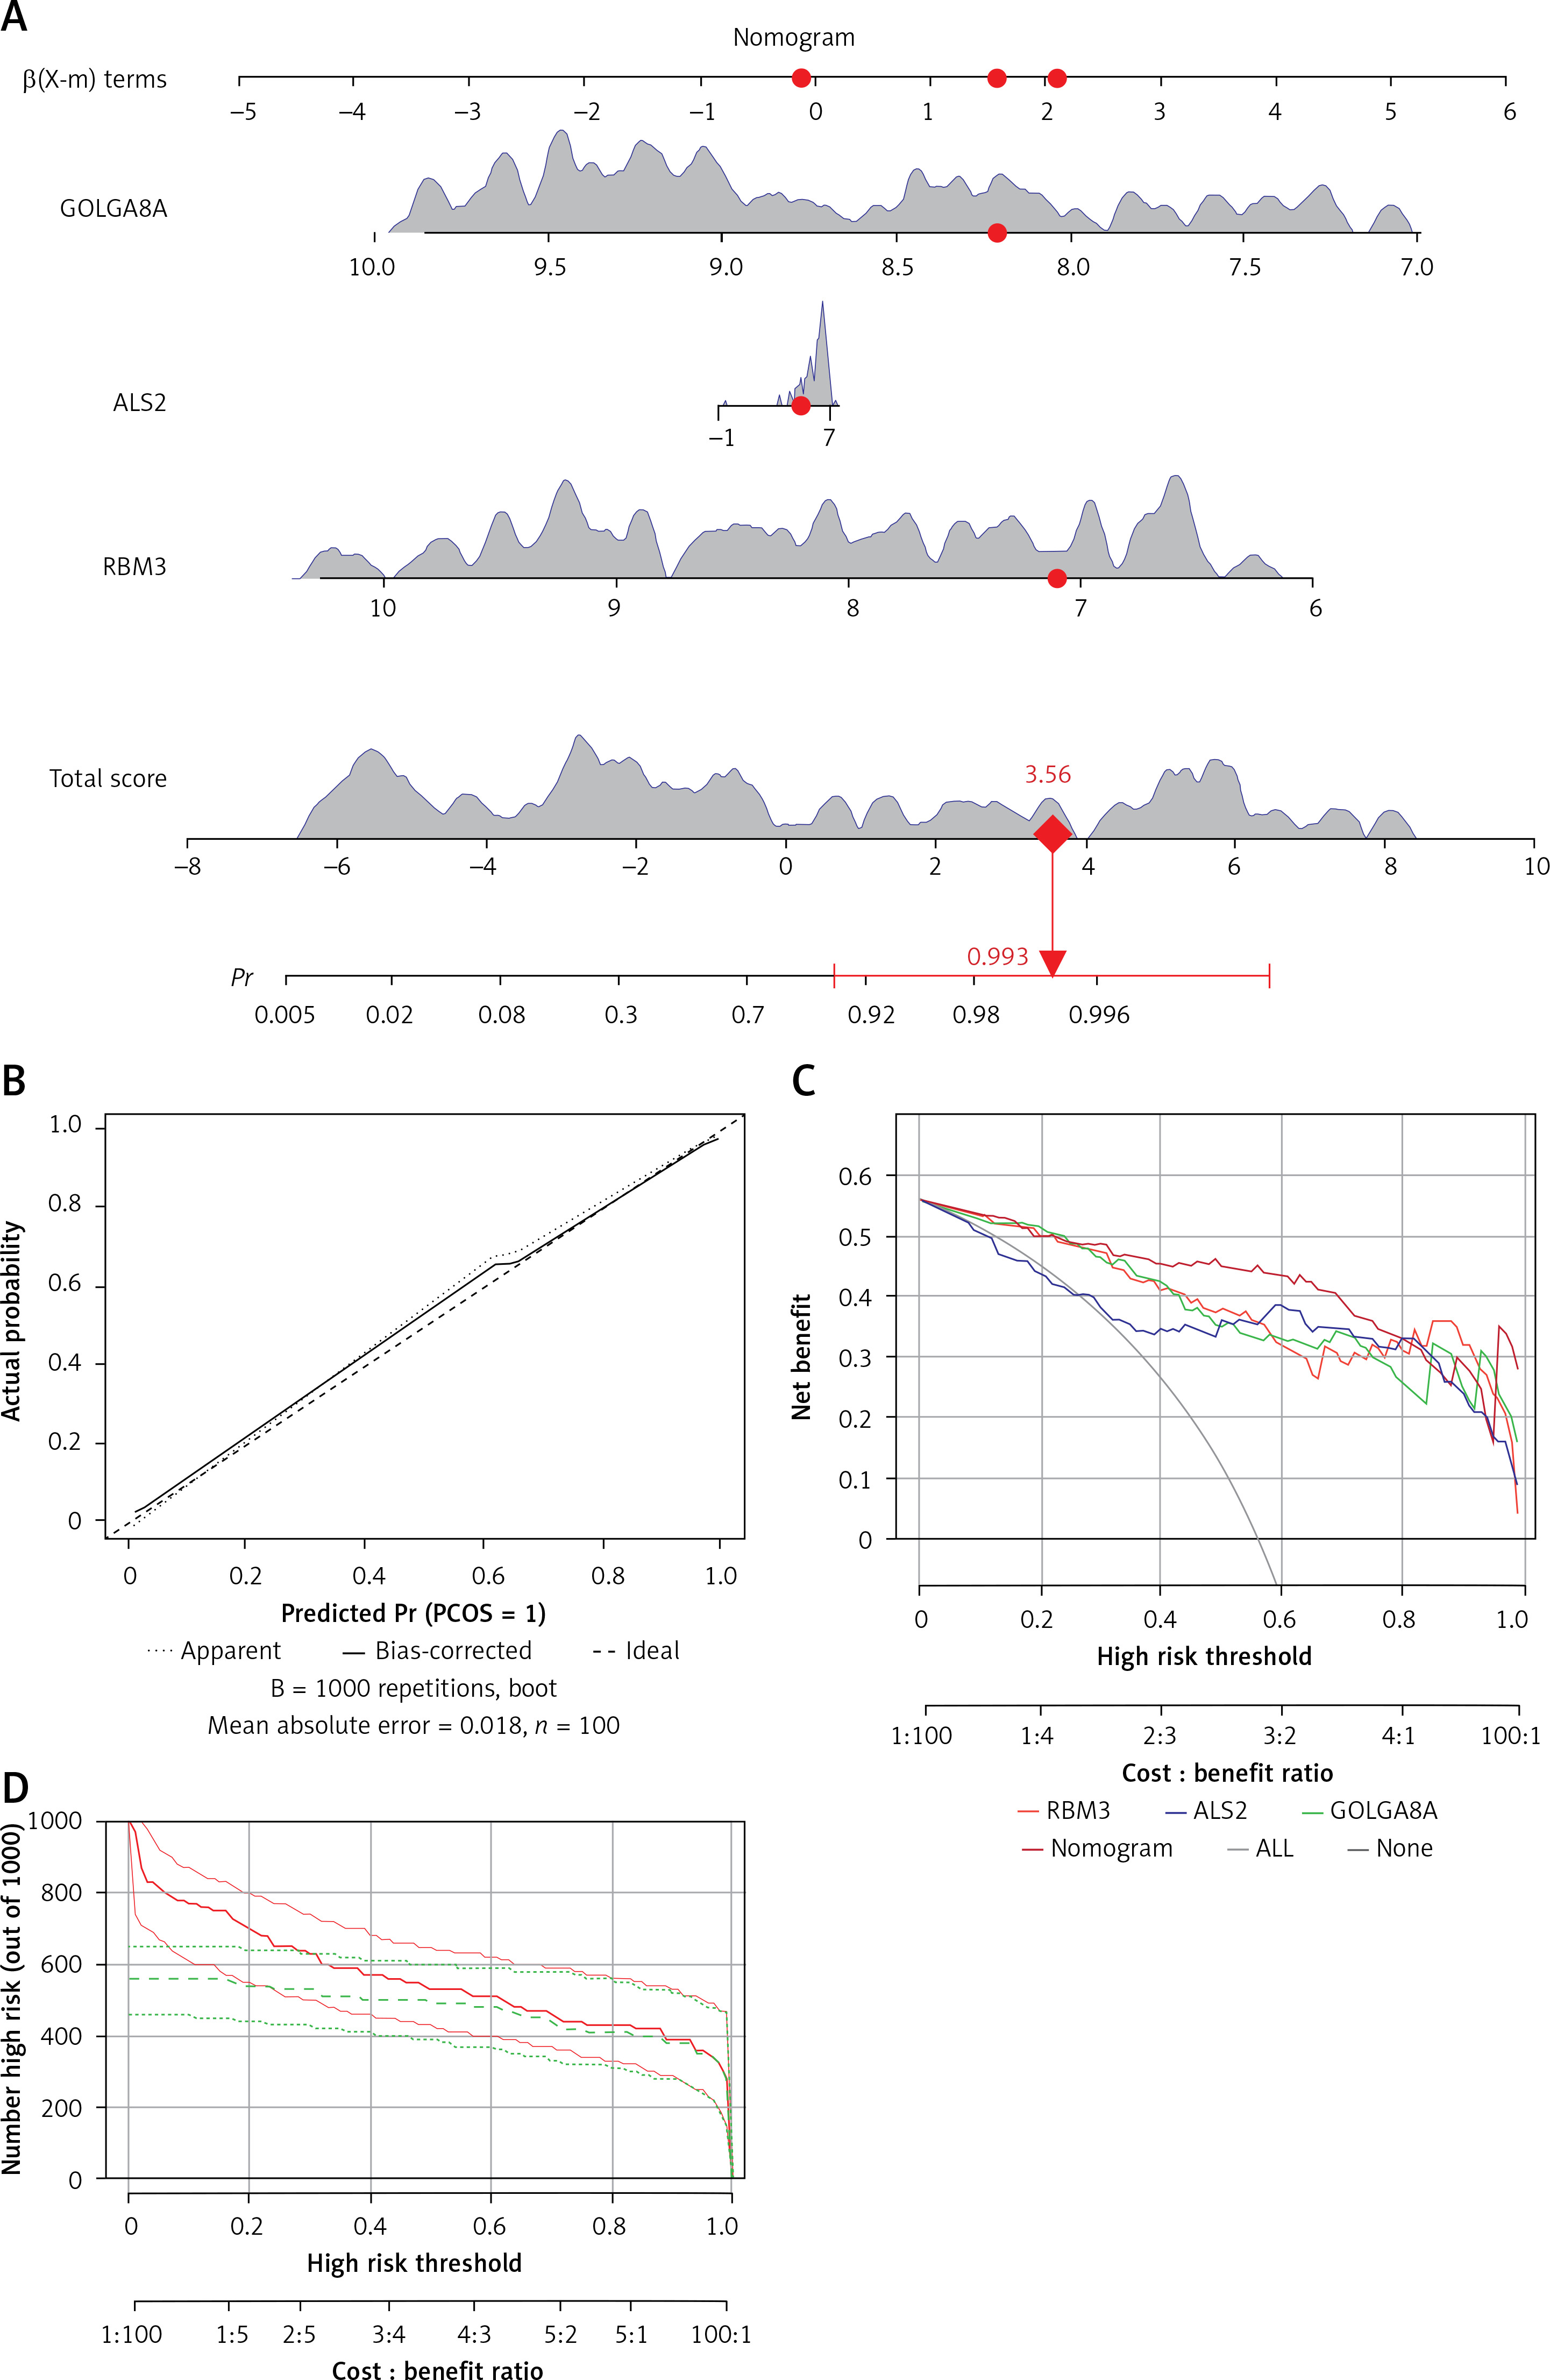
The diagnostic bar graph shows that low expression of 3 key biomarkers contributes to the clinical diagnosis of AD. We calculated the likelihood that a patient would be given an AD diagnosis by combining the gene scores (Figure 6 A). Also, the column line model exhibited great capacity to forecast AD, according to calibration curves (Figure 6 B). Additionally, DCA (Figure 6 C) and CIC (Figure 6 D) visually illustrated that the column line diagram had superior overall net benefit over a practical and wide range of threshold probabilities, indicating that the column line diagram acquired in our current research could assist clinicians in more accurately determining patient prognosis. Taken together, these findings imply that RBM3, GOLGA8A, and ALS2 have the potential to function as reliable diagnostic biomarkers for AD.
Figure 6
Construction of diagnostic models. A – Nomogram; we calculated the corresponding score for each genetic variable, then drew a straight line above the “point axis” and added the calculated scores for all the variables to find the final value on the “total score axis” and then drew a vertical line on the “probability axis” to identify the patient’s risk of developing AD. B – Calibration curve showing the relationship between predicted and actual probability. C – Decision curve analysis (DCA); horizontal line indicates no AD, gray diagonal line indicates no AD, and column diagram showed more net benefit within the threshold probability range. D – Clinical impact curves; red curves show the number of individuals classified as positive by the model at each threshold probability; green curves show the number of true positives at each threshold probability
Immune cell infiltration results
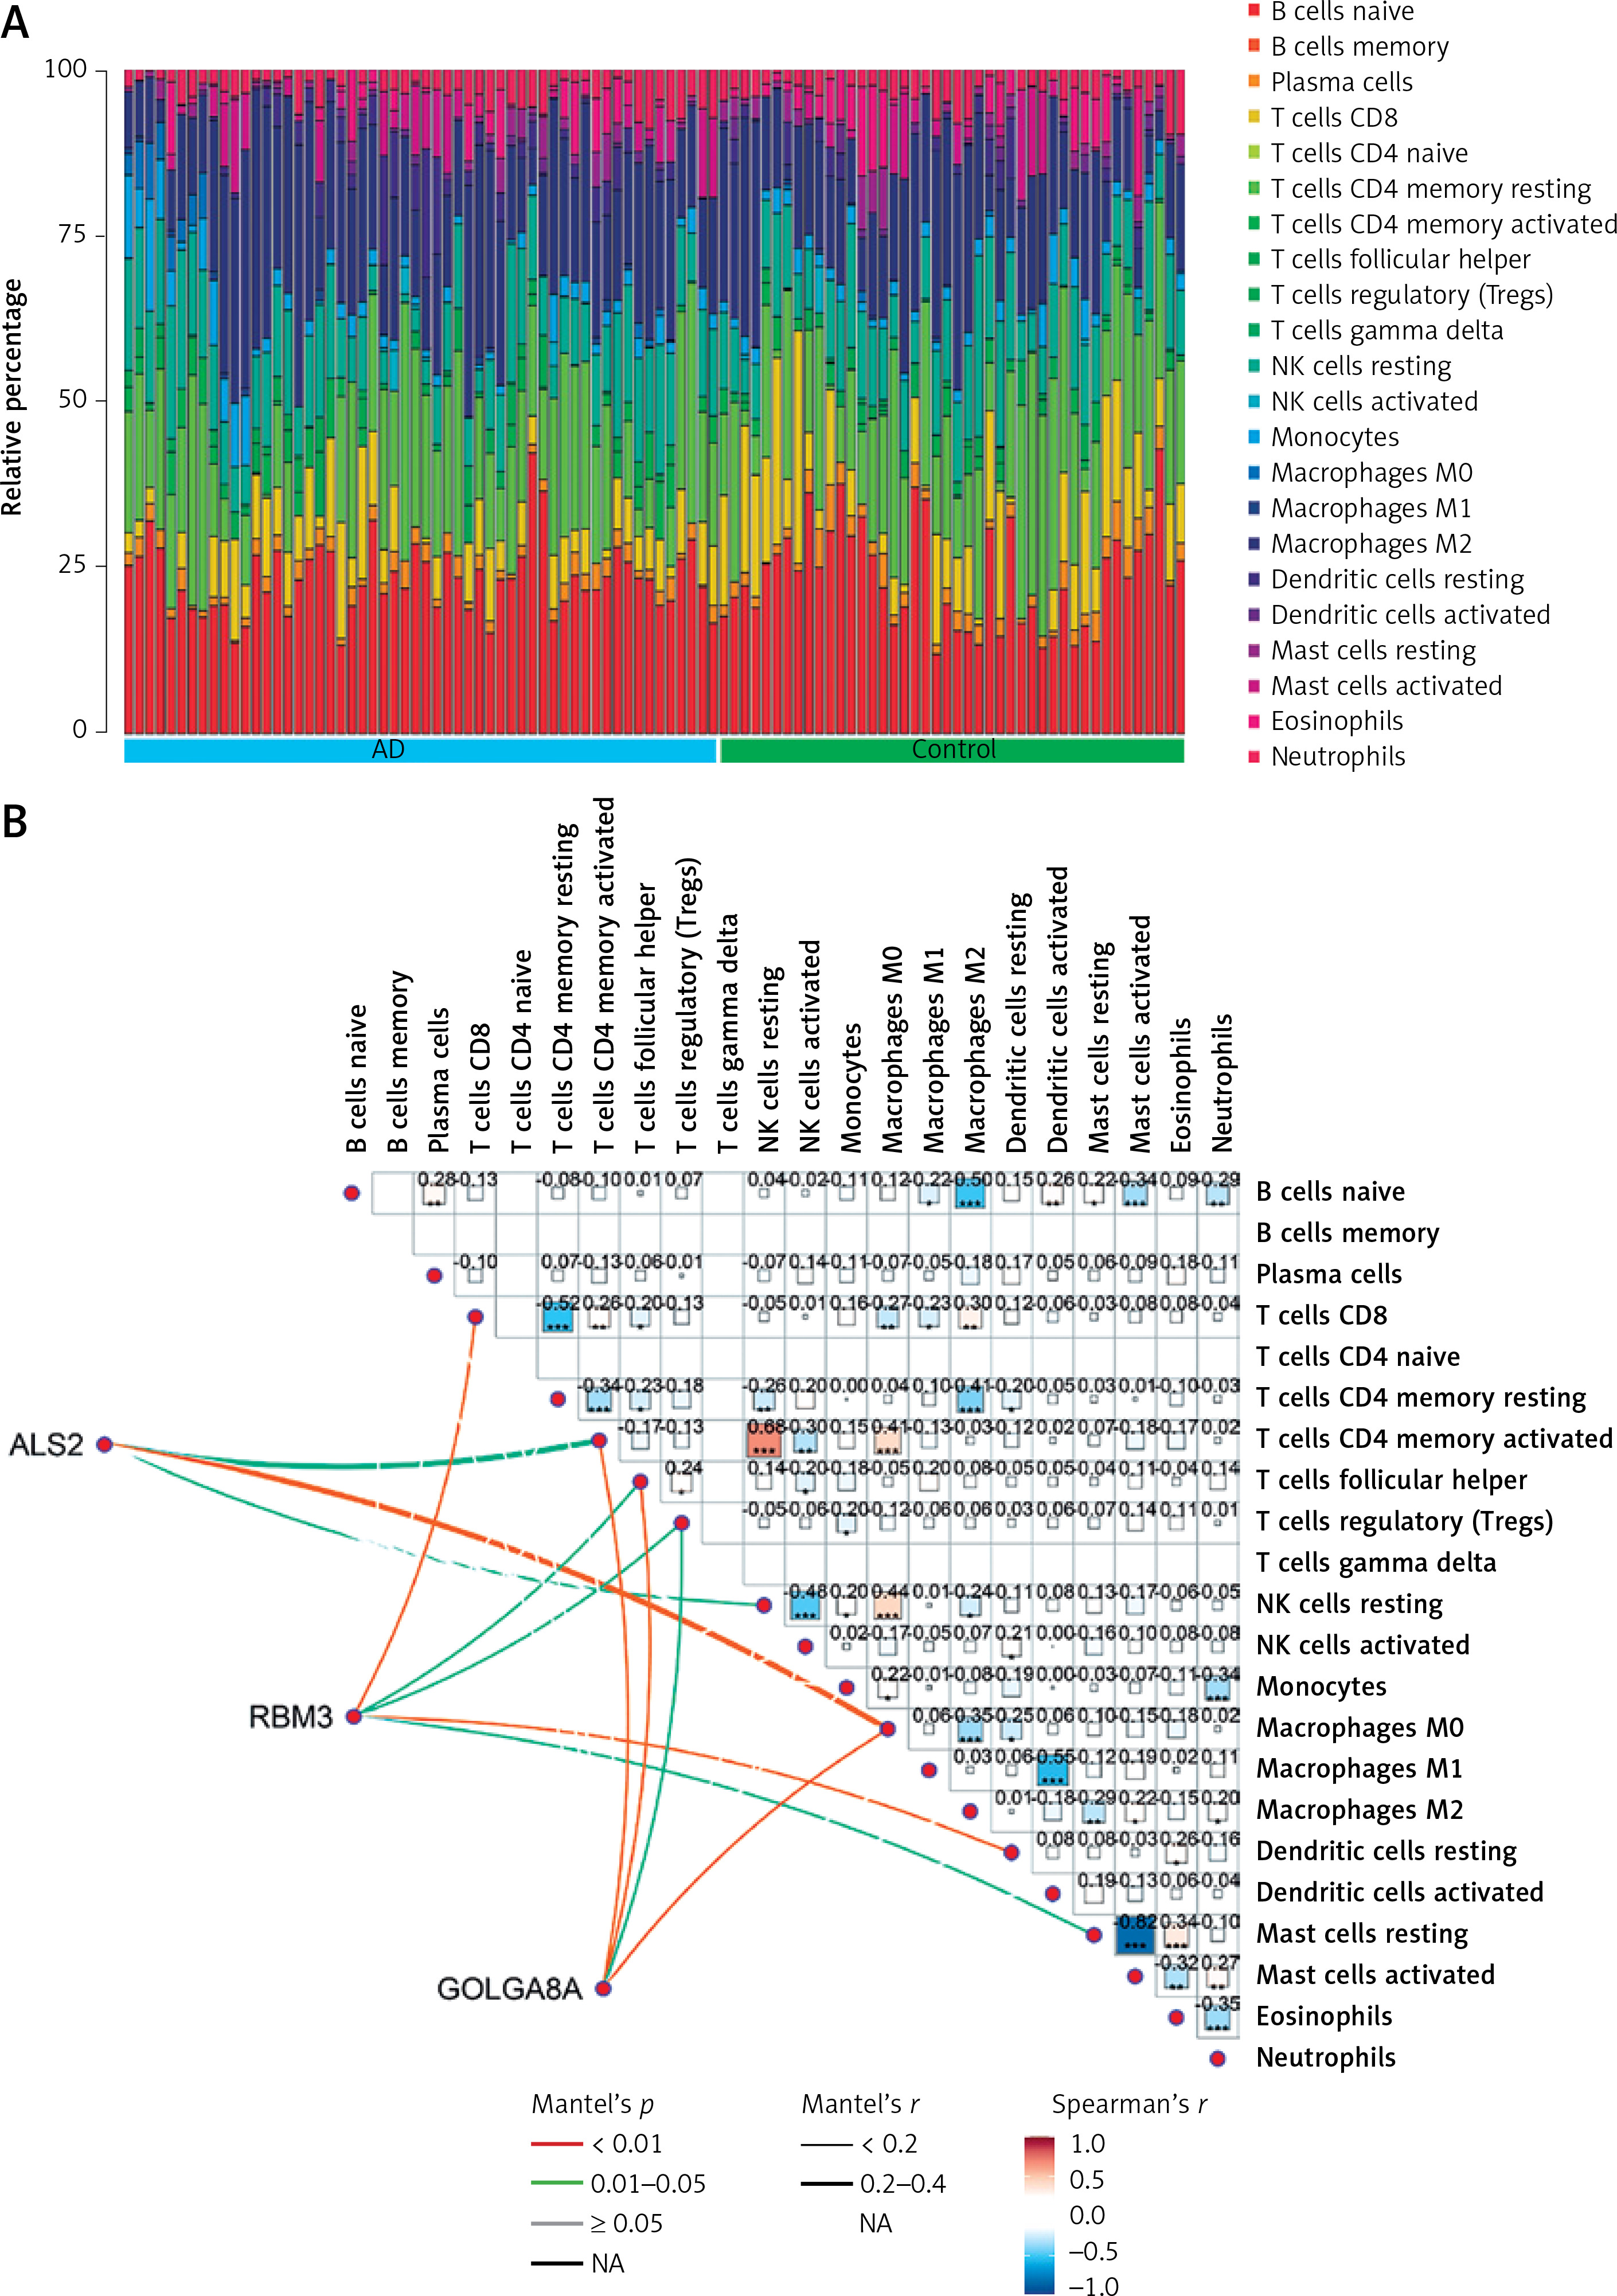
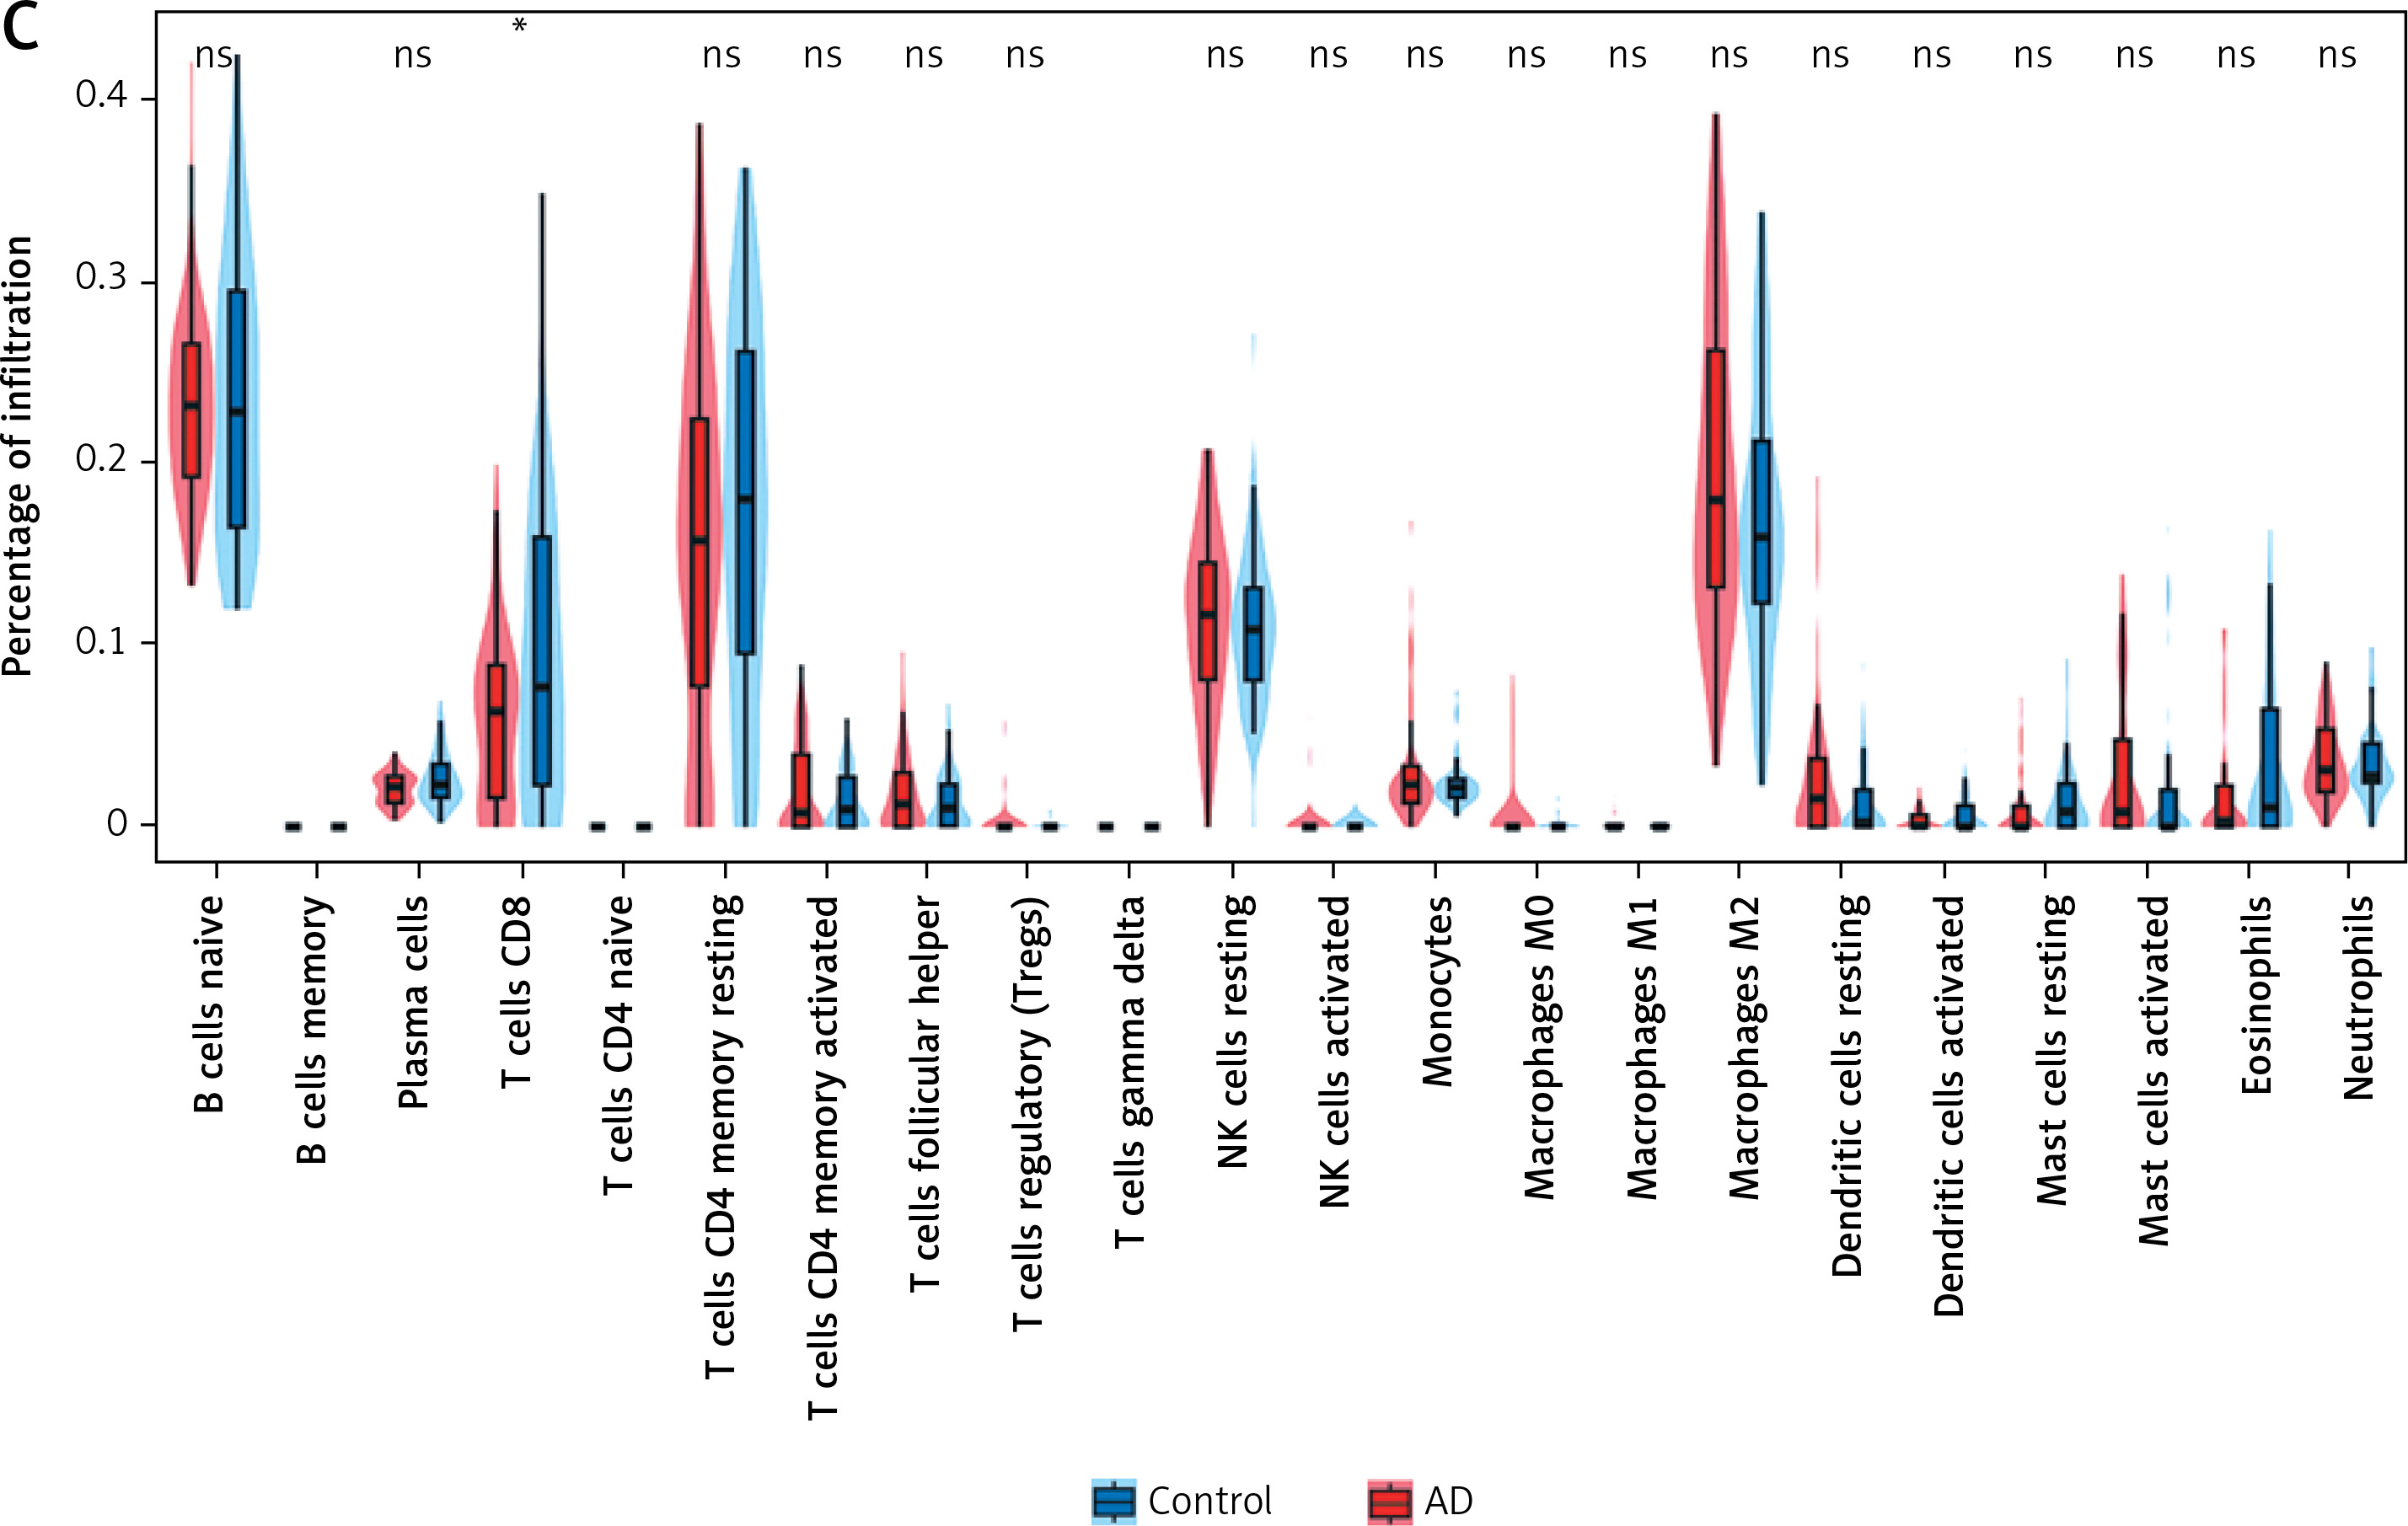
The microenvironment in the brain contains a variety of growth factors, inflammatory factors, extracellular matrix and immune cells that have an important impact on the development of brain diseases. With the CIBERSORT algorithm, we estimated the proportion of 22 types of immune cells in 44 control samples and 56 AD samples in the cerebral cortex (Figure 7 A) and performed the same analysis on control and AD samples of blood and visualized the results (Supplementary Figure S4 A). Also, in cortical samples from AD brains, we examined the relationship between immune cell infiltration (Figure 7 B). Then, immune cell infiltration in AD cerebral cortex and blood samples and respective control samples was compared in two boxplots (Figure 7 C, Supplementary Figure S4 B). The results showed that in the cerebral cortex, the proportions of T cells CD8 (p < 0.05) were significantly lower in the AD group than in the control group. In peripheral blood, the proportions of memory B cells (p < 0.05) and resting memory T cells (p < 0.05) were significantly higher in the AD group than in the control group, while the proportions of CD4-naïve T cells (p < 0.05), monocytes (p < 0.05) and macrophages M0 (p < 0.01) were lower.
Figure 7
Results of immune cell infiltration of AD brain cortex samples. A – Relative percentage of 22 immune cells in each AD brain cortex sample. B – Heatmap of correlation in 18 types of immune cells in cortex samples (4 types of immune cells were eliminated due to the absence of infiltration). Brown represents a positive correlation, while blue represents a negative correlation. Darker color indicates stronger association. C – Box plot for immune cell infiltration analysis in AD cortex. Red represents the AD group and blue represents the control group. ns: not significant, *p < 0.05; **p < 0.01; ***p < 0.001
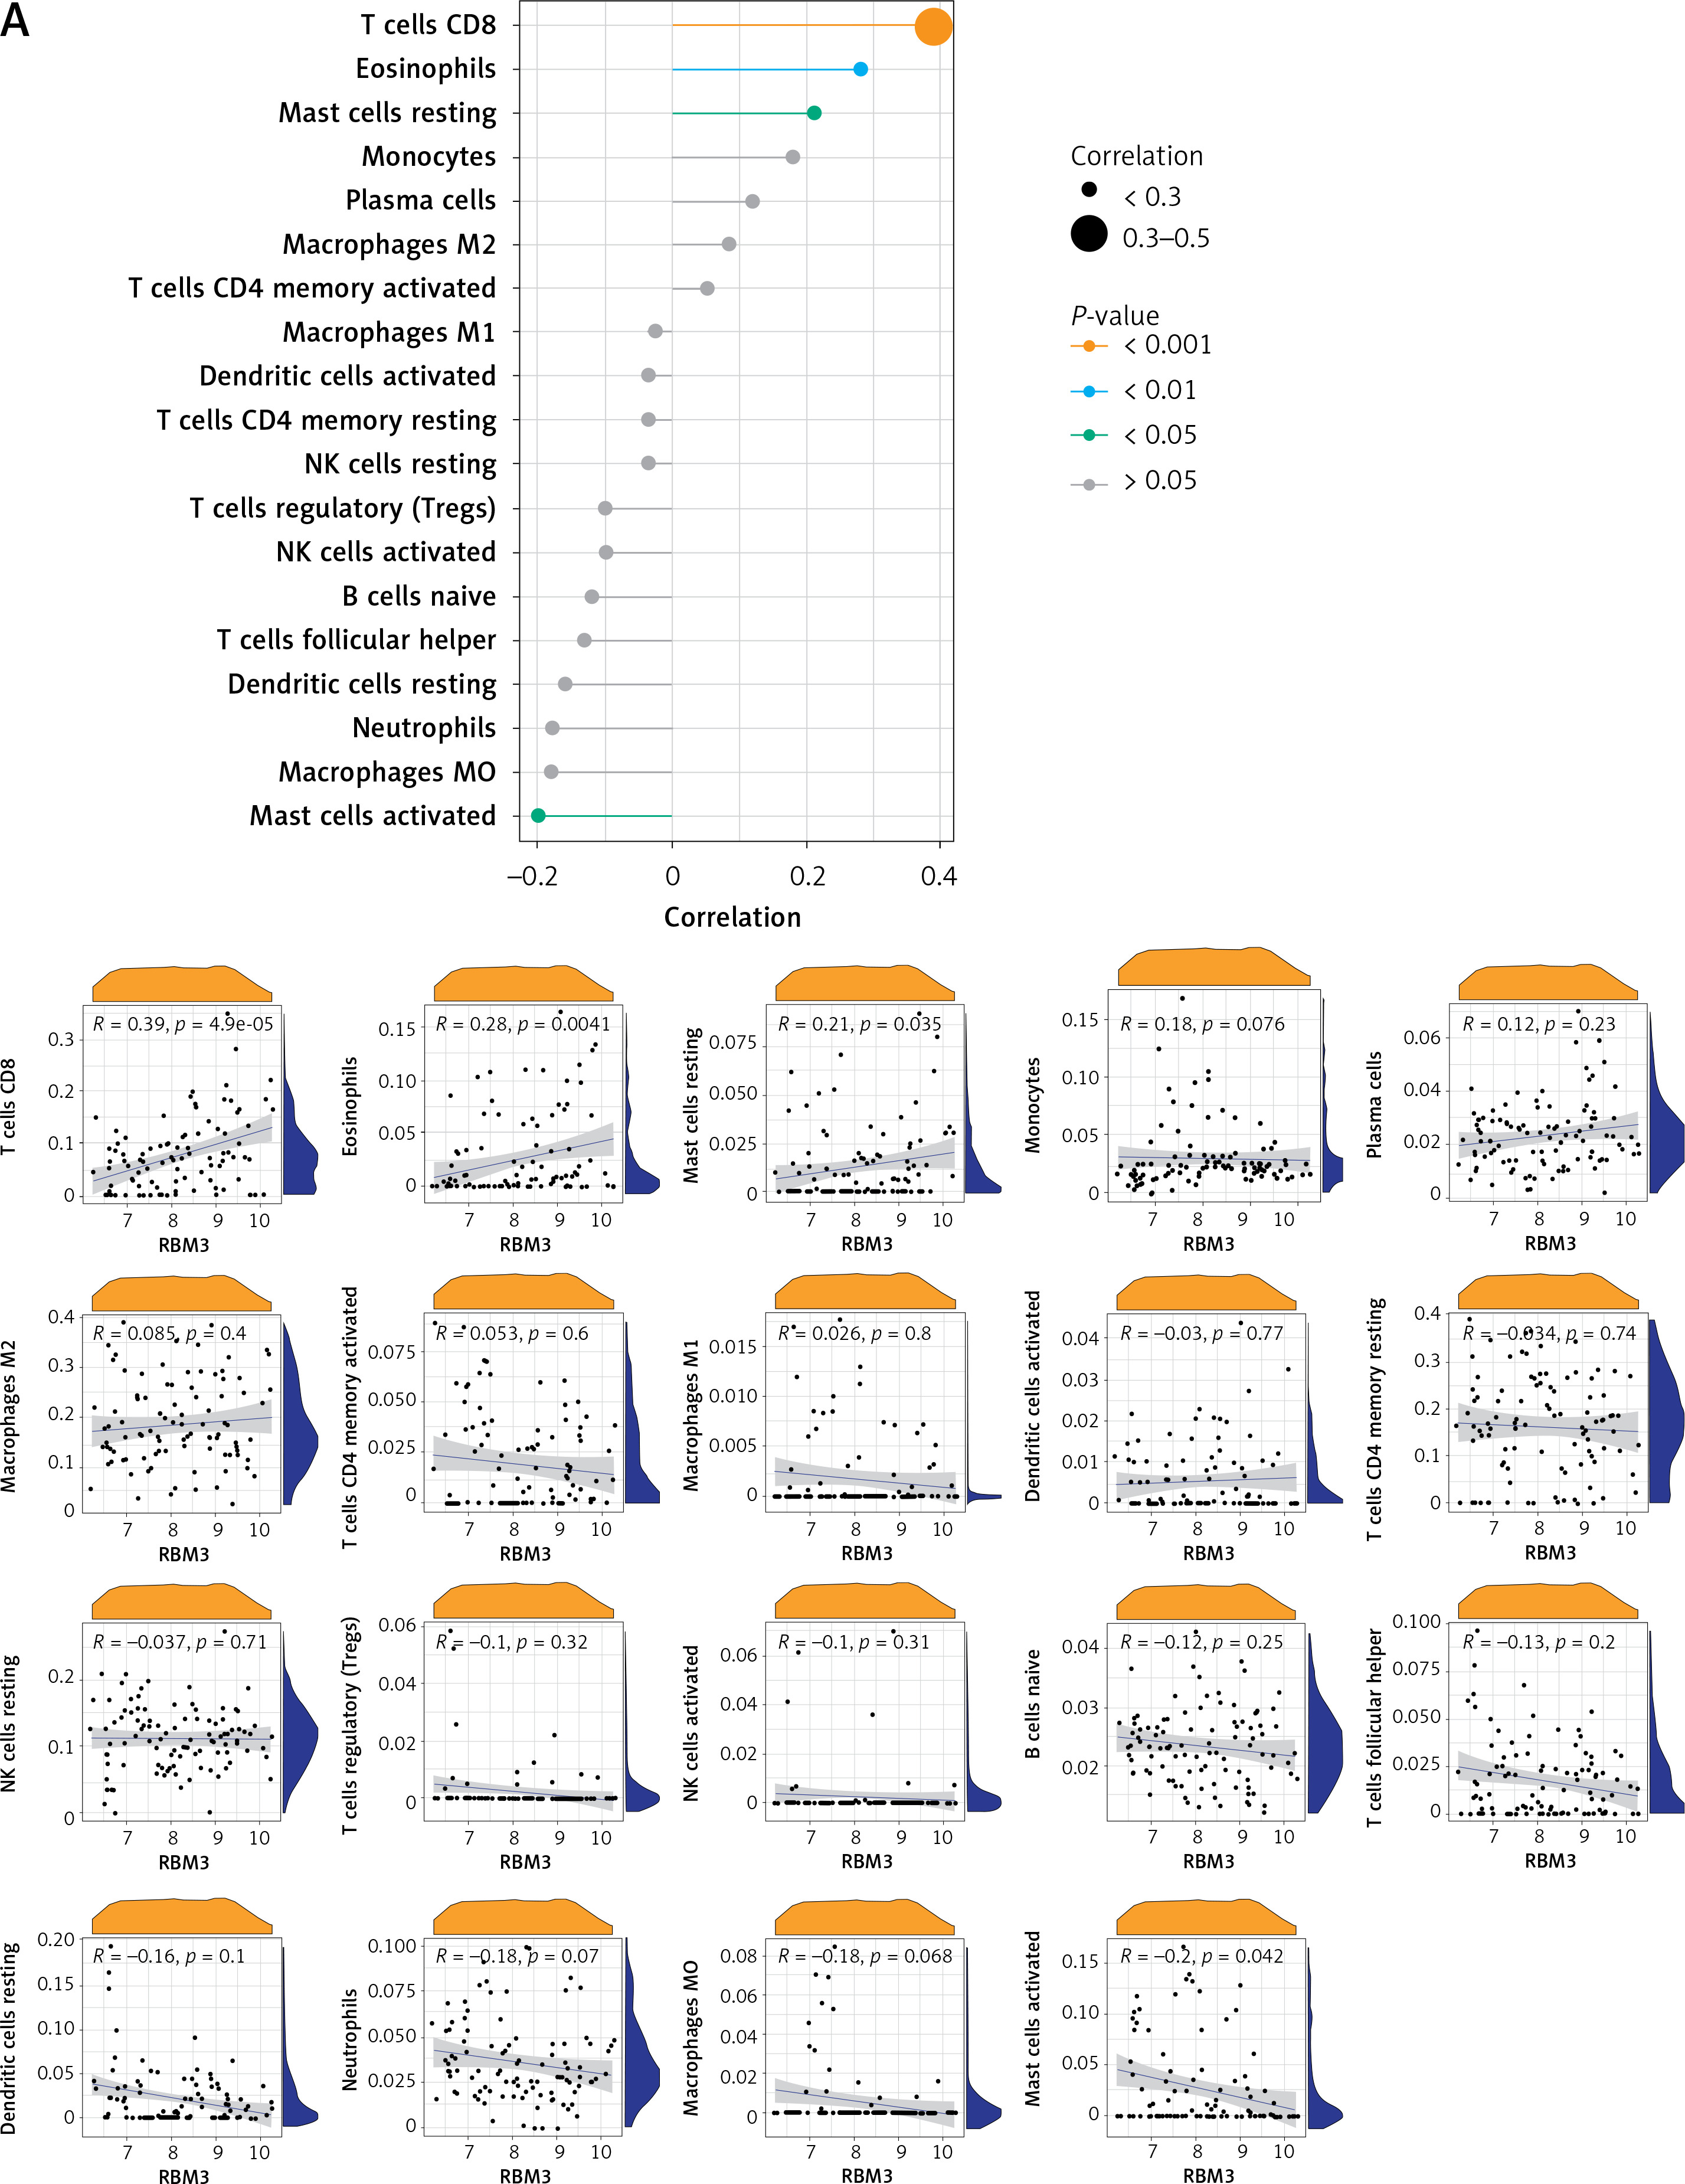
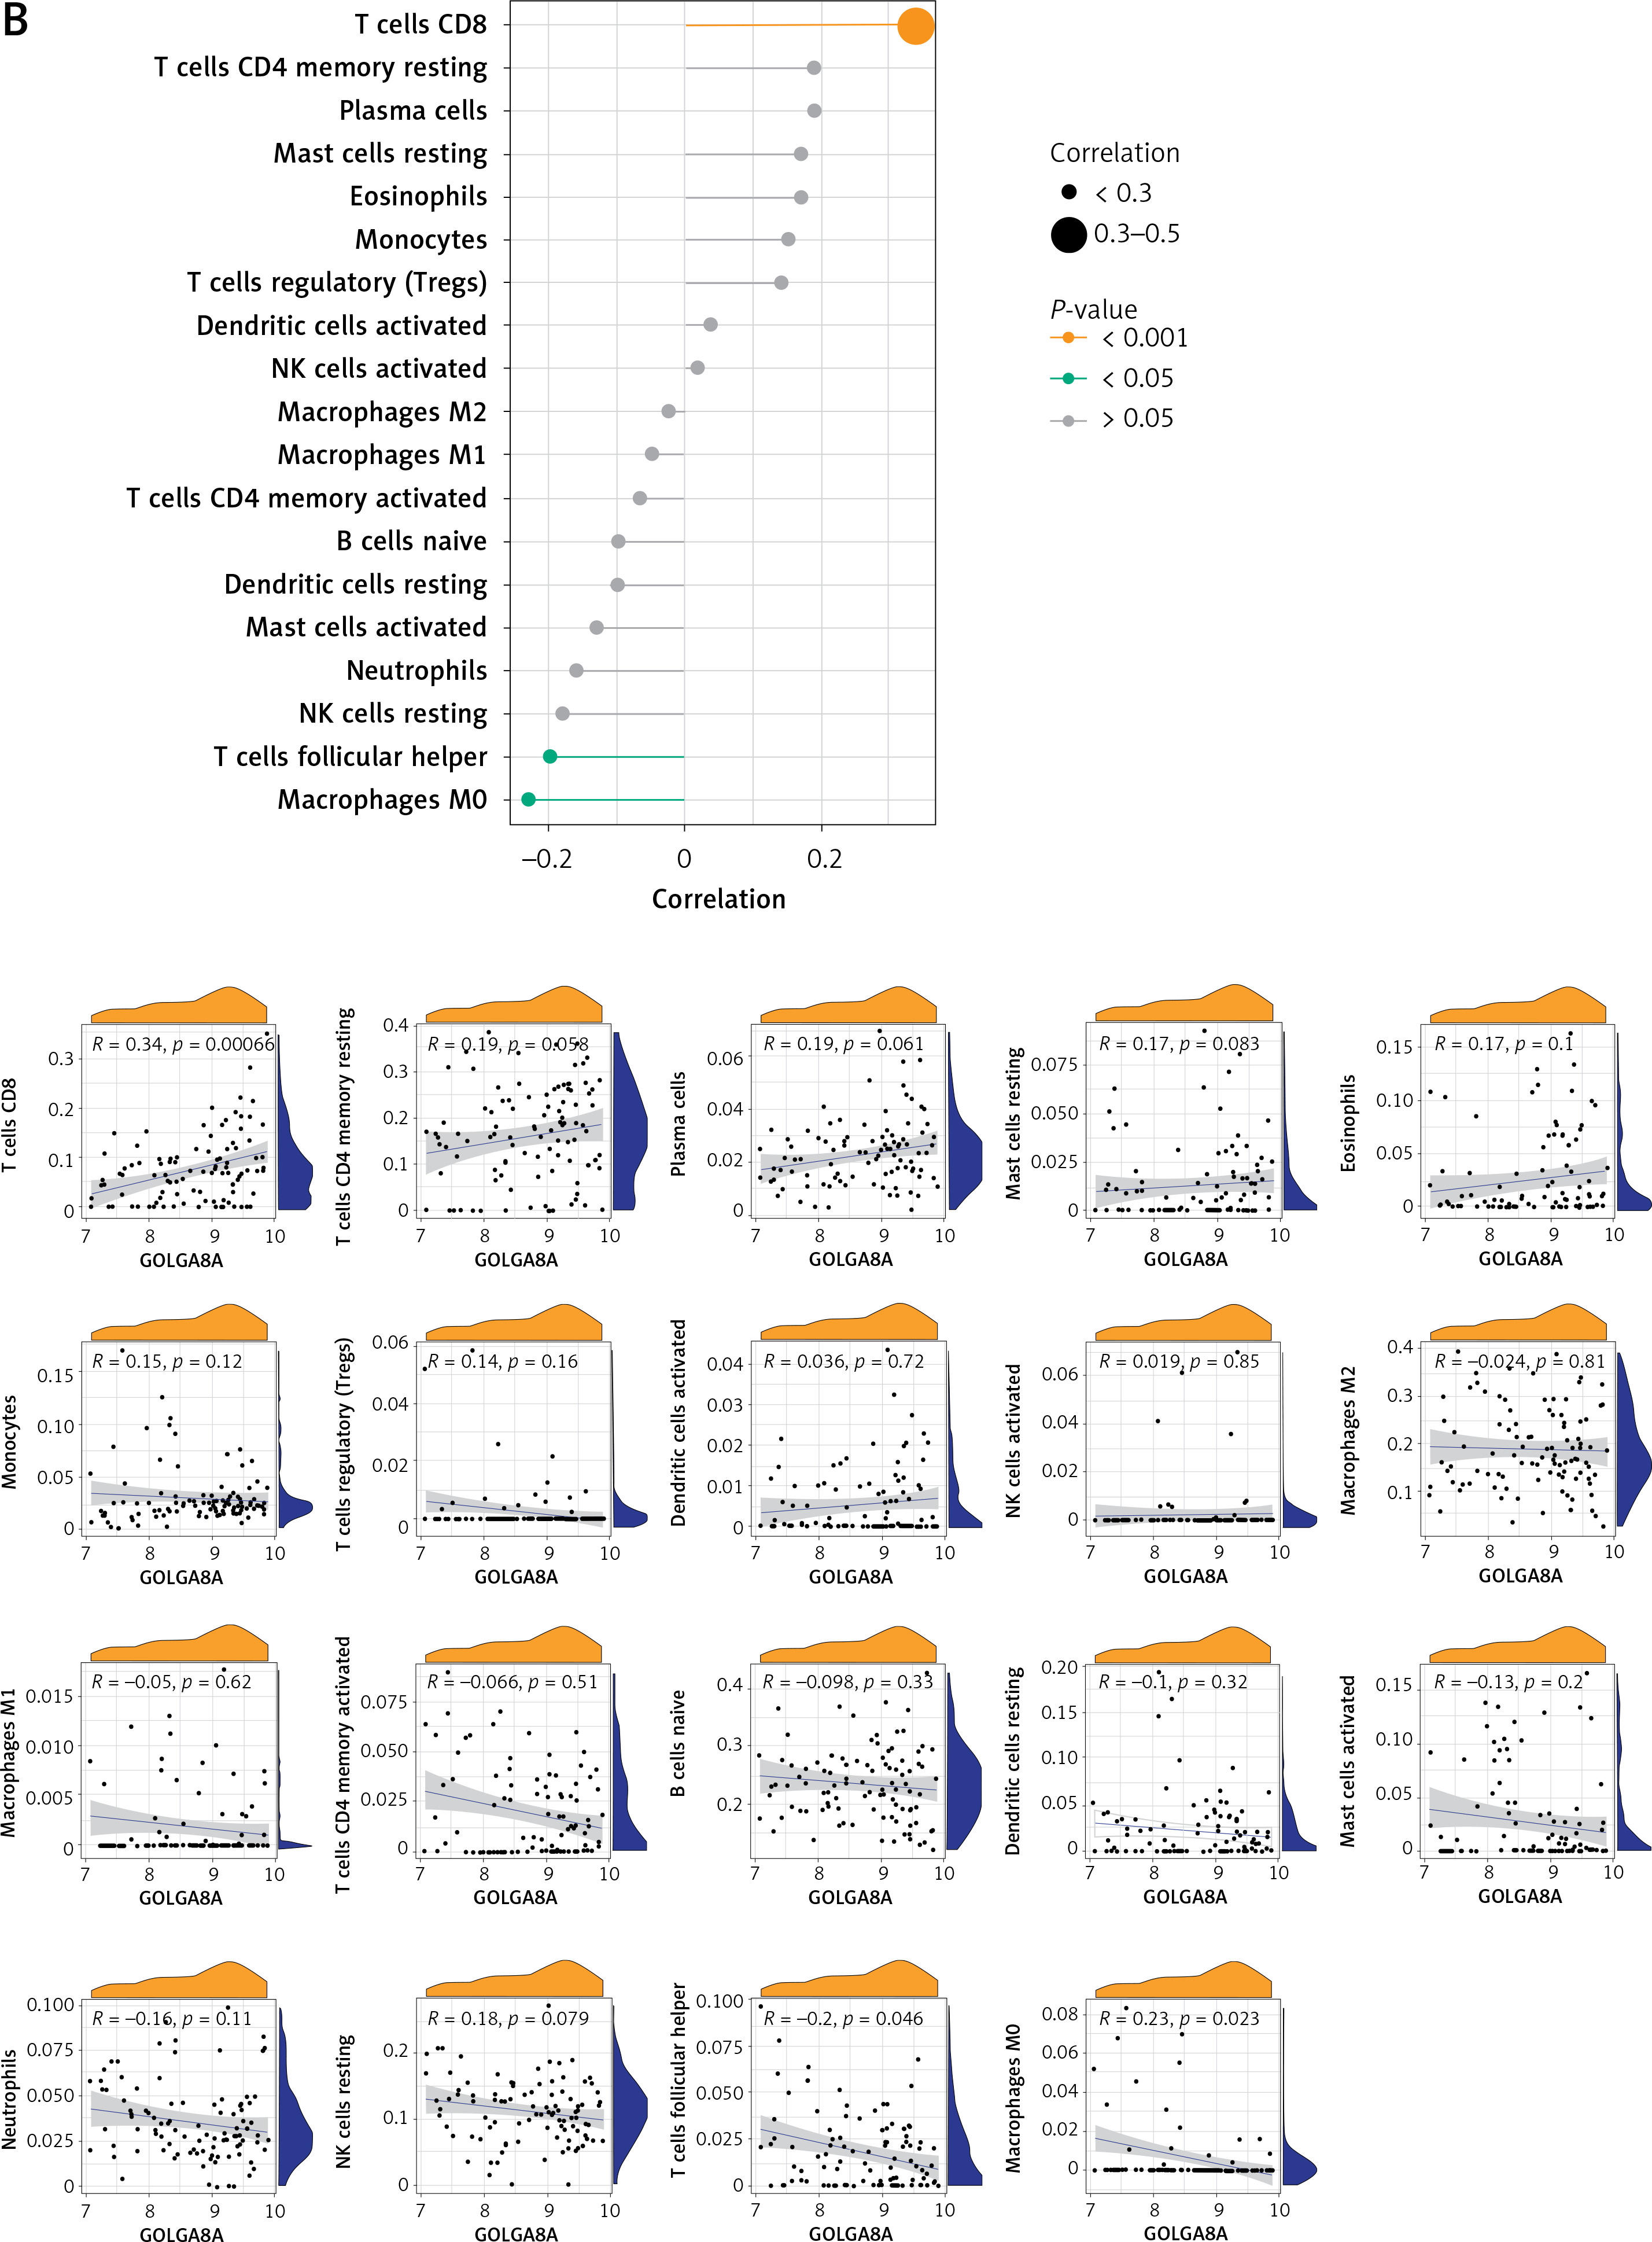
Correlation analysis between key potential biomarkers and immune cells
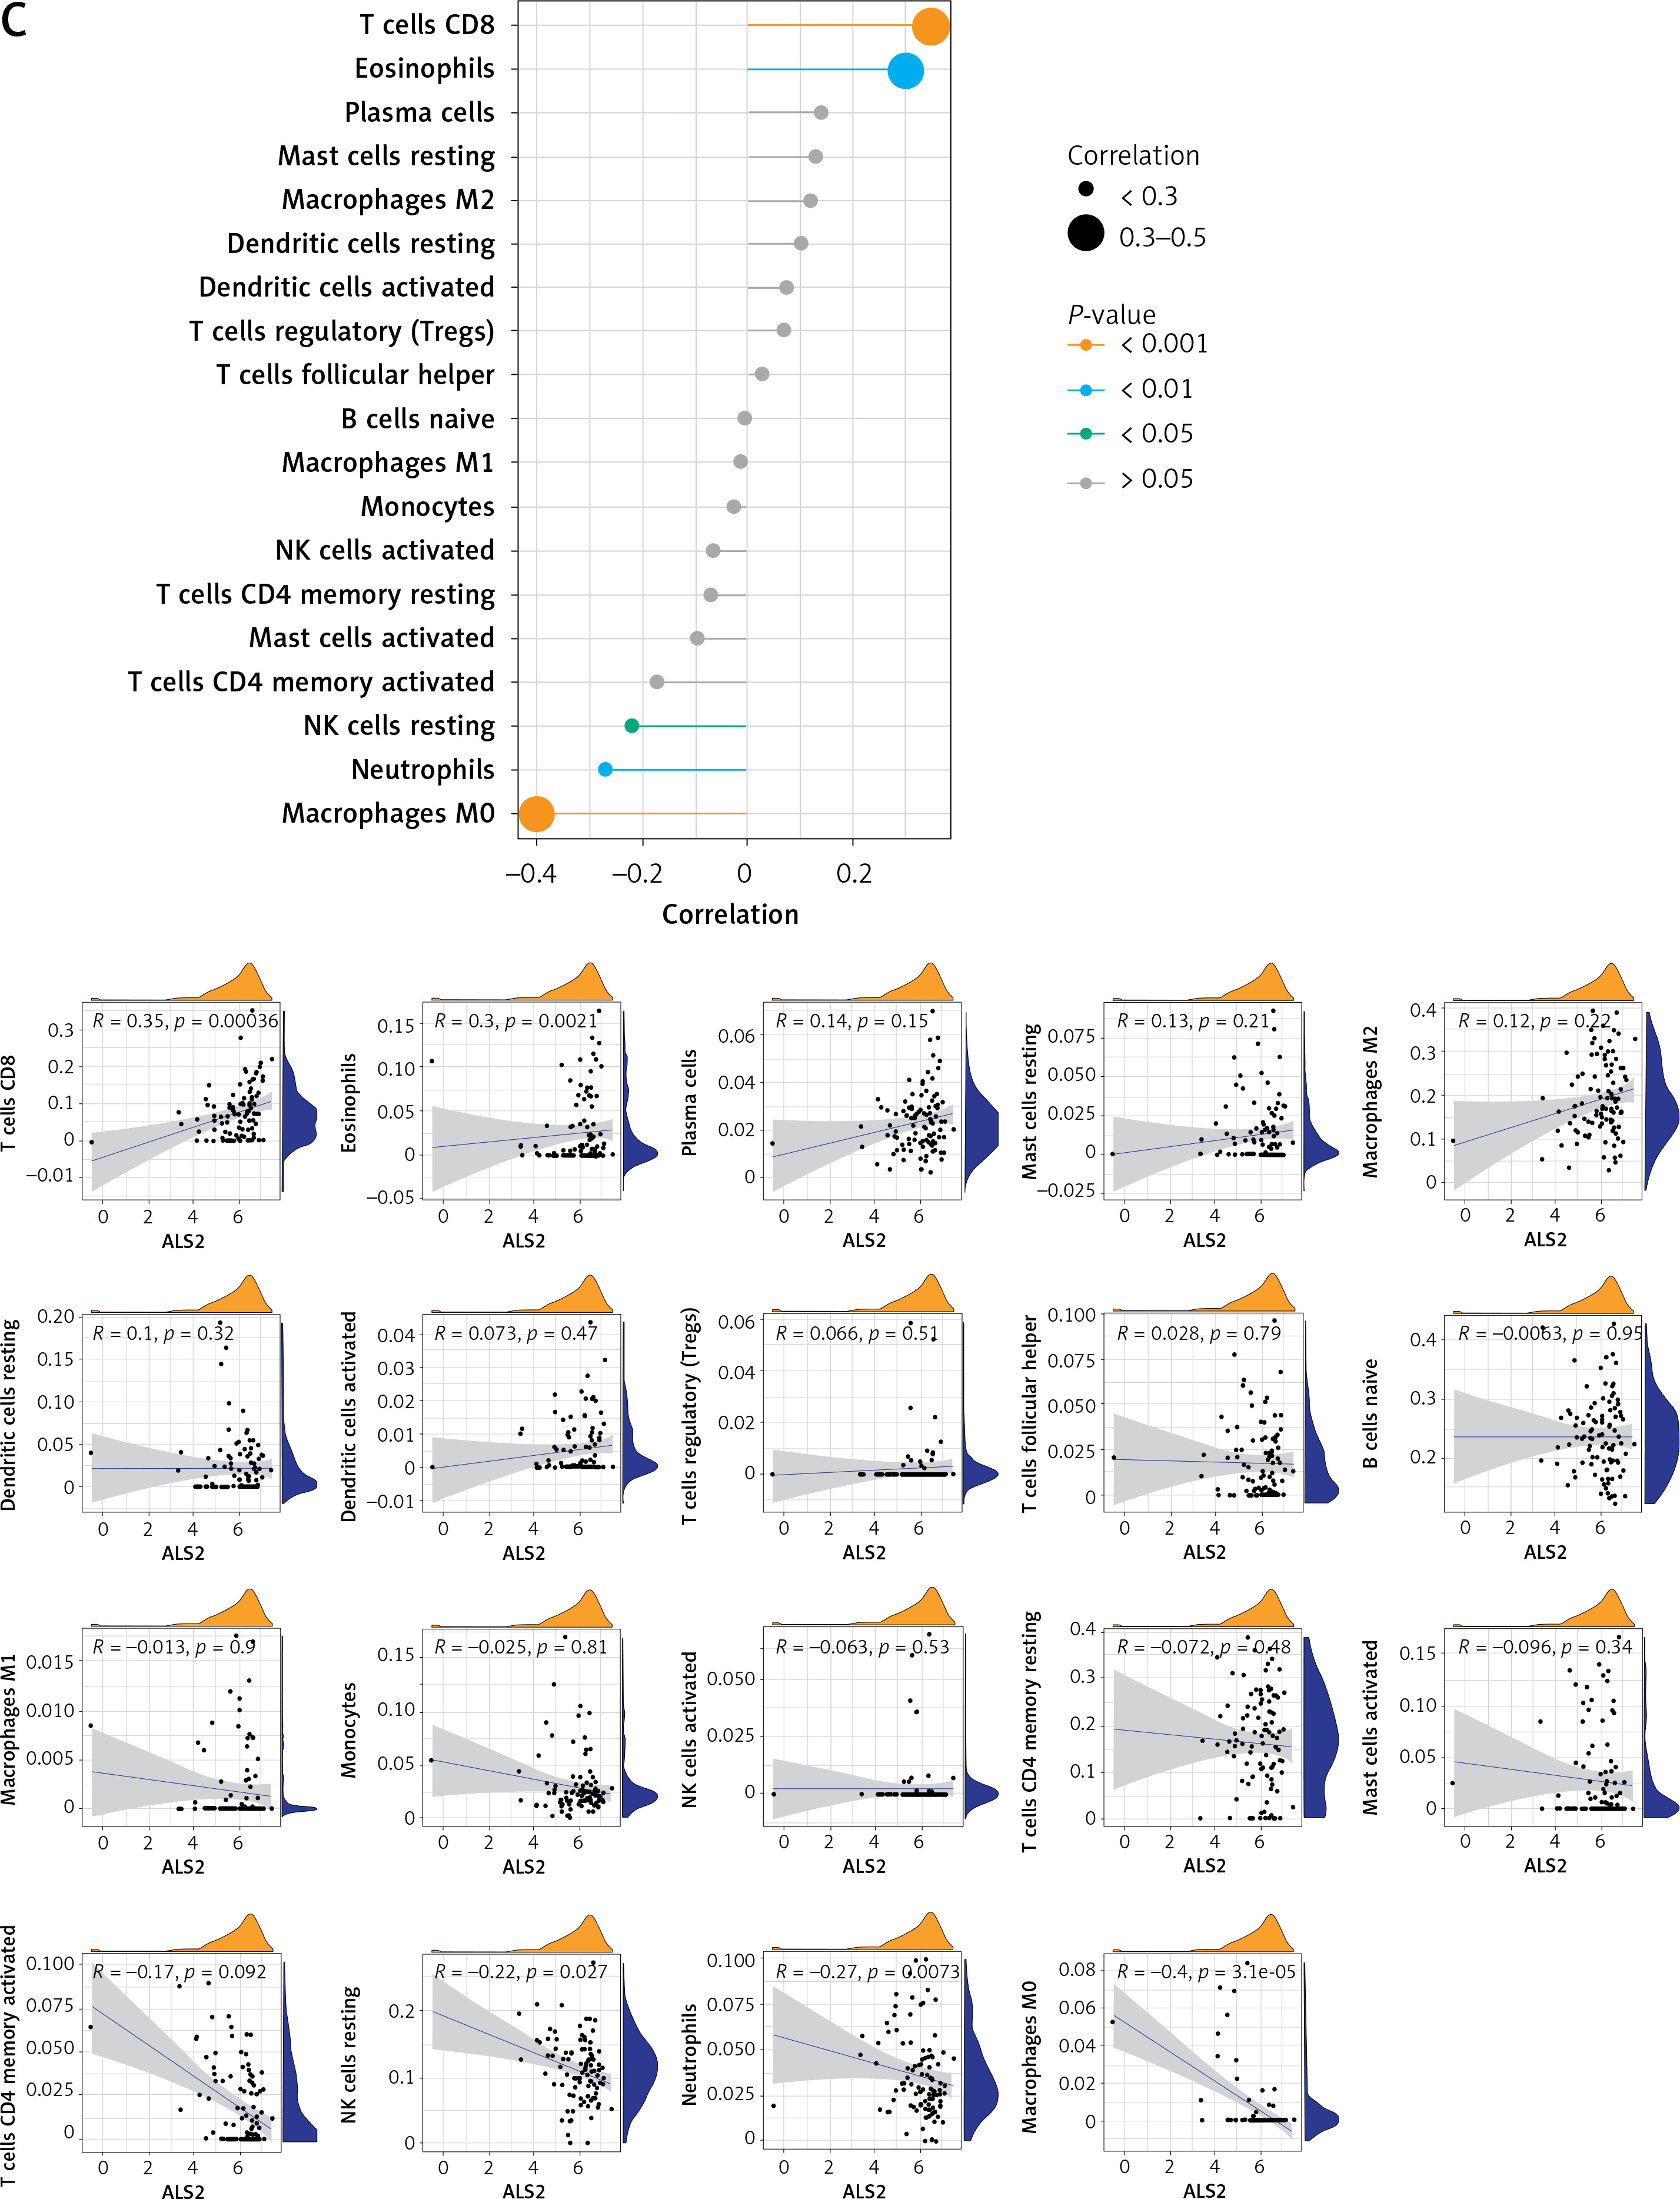
Correlation analysis of biomarker genes and 22 immune cells allows us to speculate how these genes are involved in the process of AD by regulating the infiltration of immune cells. We explored the relevance of 3 key potential biomarkers to immune cells in cortical samples of AD brains (Figure 8). The marker gene RBM3 in AD was positively correlated with resting mast cells, eosinophils and CD8 T cells, and negatively correlated with activated mast cells (Figure 8 A). The gene GOLGA8A was positively correlated with CD8 T cells, whereas it was negatively correlated with follicular helper T cells and M0 macrophages (Figure 8 B). The gene ALS2 was positively correlated with eosinophils and CD8 T cells, and negatively correlated with resting NK cells, M0 macrophages and neutrophils (Figure 8 C).
Discussion
This study employed AD target gene screening and functional analysis. Also, machine learning algorithms were applied for biomarker screening and regulatory mechanism prediction of the screened biomarkers was performed. These results have theoretical value for the diagnosis and prediction of AD as well as insight into the immune characterization of AD. First, we screened cortical samples and blood samples from AD patients for 29 common genes that may be closely related to the OXPHOS pathway. Eukaryotic OXPHOS, crucial for ATP production, significantly influences AD development [37]. On the other hand, OXPHOS facilitates the maintenance of central immune system homeostasis. An essential role for neuroinflammation in the etiology of AD may be played by microglia, according to the discovery of higher levels of inflammatory markers in AD patients and the finding of AD risk genes related to innate immune function [38]. The 29 target genes were found to be highly co-expressed with genes involved in the OXPHOS pathway, implying that these target genes may affect the development of neuroinflammation and AD directly or indirectly through the OXPHOS pathway. Resident macrophages of the central nervous system (CNS), microglia, play a dual role in brain function by secreting both pro-inflammatory cytokines and neurotrophic factors. They interact bidirectionally with other brain cells and peripheral immune cells, influencing diseases such as neuroinflammation and maintaining healthy brain tissue [39, 40]. Some of the above target genes regulate macrophage activation, potentially affecting AD progression by altering microglial activation. In the pathogenesis of AD, reduced estrogen signaling leads to diminished estrogen-mediated neuroprotection. Estrogen, a neuroactive steroid, plays a neuroprotective role in AD by reducing glutamate toxicity, Aβ, brain inflammation, and tau hyperphosphorylation [41–45]. Reduced ERα expression in AD patients’ hippocampal neurons demonstrates estrogen’s protective effects, involving pathways such as Ca2+ mobilization and adenylate cyclase-modulated G protein-coupled receptor signaling [46]. Some of the target genes may also mediate similar protective functions.
We screened five potential biomarkers based on two machine learning algorithms, namely FSD2, ALS2, RBM3, GOLGA8A and LOC100287628. Autophagy, a lysosome-driven self-degradation process, plays a key role in cellular homeostasis by removing dysfunctional organelles and proteins [47, 48]. Mitophagy specifically targets mitochondria [49]. Autophagy dysfunction, often due to DNA damage, is linked to aging and diseases such as AD and PD [48]. Our study’s GSEA analysis shows that biomarker FSD2, upregulated in AD patients’ cortical samples, might inhibit autophagy in the CNS, leading to protein and organelle accumulation. New research now suggests that microglia autophagy plays an integral role in the development of AD. Pyroptosis, autophagy, and ferroptosis of microglia have a significant impact on AD [50].
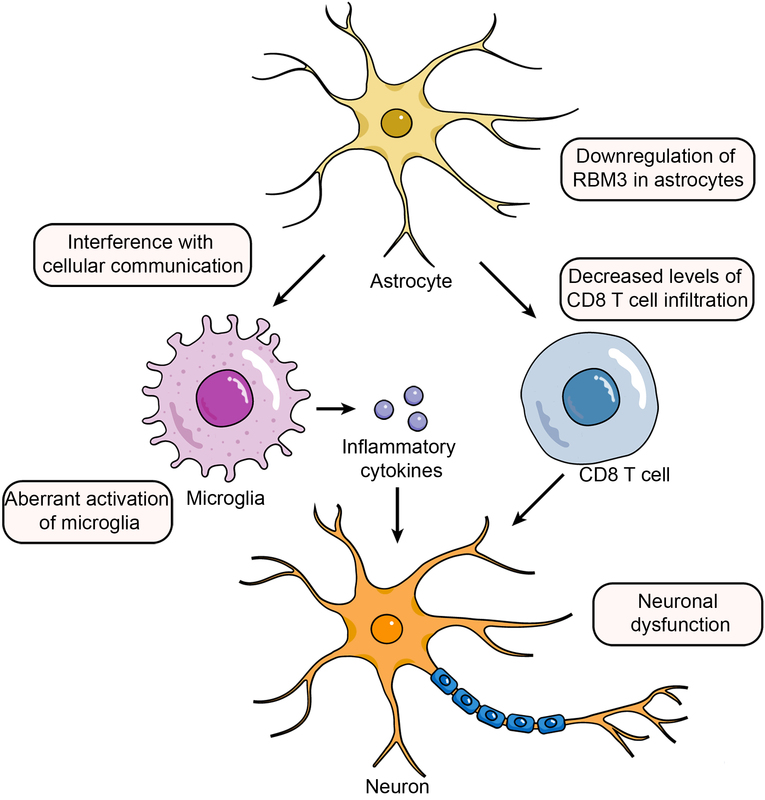
Astrocytes, abundant in the CNS, are key to regulating neuroinflammation and maintaining CNS health [51, 52]. In AD, reactive astrocytes accumulate around amyloid plaques, participating in phagocytosis and secreting inflammatory cytokines, exacerbating neurodegeneration. Furthermore, dysregulated interaction between astrocytes, microglia, and neurons contributes to AD’s neuroinflammation [53, 54]. RBM3 (RNA-binding motif protein 3) is a cold shock protein that is rapidly increased in cold conditions to maintain cellular and internal environmental equilibrium and aid survival [55]. Various cellular physiological processes, including tumorigenesis [56] and neuroprotection [57], are likewise regulated by RBM3. Furthermore, RBM3 is expressed in a variety of immune cells, including eosinophils, T cells, and macrophages [58]. Our analysis showed that in normal samples, there was a trend of elevated RBM3 expression as astrocytes developed and matured, while there was no such trend in AD samples. In AD patients, downregulation of RBM3 in astrocytes affects various RBM3-mediated physiological functions, including cell cycle inhibition and neuroprotective effects [57, 59], and may also interfere with cellular communication [54], thereby causing abnormal activation of microglia, which in turn promotes the development of neuroinflammation and the progression of AD. Badrani et al. also reported that RBM3 intrinsically inhibits innate lymphocyte activation and inflammation partially through CysLT1R, suggesting that RBM3 may contribute to the suppression of central neuroinflammation [58], which aligns with our results.
MicroRNAs (miRNA), produced by RNA polymerase II, are crucial for post-transcriptional gene regulation in eukaryotes [60, 61]. They are linked to AD progression, influencing neuronal functions and gene expression [62]. A bioinformatics analysis also pointed to miRNAs as biomarkers and therapeutic targets for AD [63]. Based on five potential biomarkers, we explored the correlation between them by constructing miRNA-mRNA networks. The results showed that mRNAs of three genes could constitute miRNA-mRNA networks with each other. These three genes are GOLGA8A, ALS2, and RBM3. The mRNAs produced by transcription of the three genes are regulated by the same miRNAs, such as hsa-mir-101-3p, hsa-mir-23b-3p, hsa-mir-30b-5p, hsa-mir-30c-5p, hsa-mir-124-3p, hsa-mir-16-5p, and hsa-mir-129-2-3p. In our study, we found that GOLGA8A, ALS2, and RBM3 are correlated with the development of AD by bioinformatic methods, and the above seven miRNAs are jointly involved in the expression of these genes, suggesting that these miRNAs may influence the CNS through ROS accumulation, mitochondrial function, and Aβ deposition to affect the occurrence and development of AD. Interestingly, one study showed that the role of hsa-miR-101-3p in AD increases with NFT stage and regulates RAC1 [64], while hsa-mir-124-3p emerged as a predictive biomarker for AD [65, 66].
We constructed TF-mRNA networks for 5 potential biomarkers to explore the relevance of transcriptional regulation of these potential biomarkers. The results showed that 4 genes are known to possess transcriptional regulatory relevance. We found that the transcription factor E2F1 co-regulates the transcription of four genes: GOLGA8A, ALS2, RBM3, and FSD2; similarly, SPI1 co-regulates the transcription of three genes: ALS2, RBM3, and FSD2. KLF4 merits consideration as well. KLF4, a zinc finger nuclear protein [67], binds GC-rich DNA sequences and CACCC elements to control transcription [68, 69]. It is linked to inflammation regulation in endothelial cells and macrophages [70, 71] and is upregulated by Aβ42-induced neuroinflammation and activated P53 in microglial cells [72]. This inflammation, worsened by activated astrocytes producing IL-1, IL-6, TNF-α [73, 74], contributes to neuronal apoptosis and dysfunction.
We selected three genes that are linked in the miRNA-mRNA network among potential biomarkers, namely RBM3, GOLGA8A and ALS2, to construct a nomogram to estimate the accuracy of these three genes for predicting the occurrence of AD, and this prediction accuracy was over 90%. Based on the results of our study, RBM3, GOLGA8A and ALS2 may possess potential as diagnostic biomarkers of AD.
Recent data show that innate immune cells crucially impact CNS immune homeostasis, influencing the neuropathogenesis of AD either positively or negatively [75]. By immune infiltration analysis, we found a significantly lower percentage of CD8 T cell infiltration in cortical samples from AD patients, and these immune cells may be derived from peripheral blood. However, the functional relevance of CD8 T lymphocytes in the AD brain remains largely unknown. The cellular component “postsynaptic” and biological process “regulation of neuronal synaptic plasticity” were over-represented after CD8 T cell ablation, and the pathways “long-term dementia”, “calcium signaling”, and “axon guidance” were upregulated [76]. Hence, we conclude that there is a decreased proportion of CD8 T cell infiltration in the AD brain, and the direct involvement of these lymphocytes in controlling synaptic plasticity may lead to neuronal dysfunction. Of note to us are the results of the correlation analysis between the expression of key potential biomarkers and immune cells showing that RBM3, GOLGA8A and ALS2 all have a significant positive correlation with CD8 T cell infiltration. Therefore, these three genes may play a crucial role in CD8 T cells affecting neuronal dysfunction in the AD brain.
In conclusion, our study identified the biomarkers RBM3, GOLGA8A, and ALS2, which may mediate the onset and progression of AD by modulating the OXPHOS pathway and influencing the proportion of CD8 T cell infiltration. The above results provide new target genes and research ideas for studying the pathogenesis and development of AD, as well as potential biomarkers for clinical prediction of AD.