Introduction
Osteoarthritis (OA) is the most common joint disease worldwide and severely affects the health and quality of life of the global population, especially middle-aged and older adults. There were over 25 million people with OA worldwide in 2020, and the number of people with OA is continually increasing. Consequently, OA places an enormous burden on public health systems worldwide [1]. It is therefore important to determine the pathogenesis of and risk factors for OA and to develop effective preventive and treatment methods for this disease.
A high body mass index (BMI) is considered to be a controllable risk factor for OA that may account for its high incidence rate [2]. In recent years, multiple studies have found that there is a close relationship between high BMI and the occurrence of OA [1–3]. For example, an excessively high BMI may increase the risk of OA, especially in the knee joint [2, 4]. However, few studies have assessed and compared the burden of OA attributable to high BMI at the global and national levels. Moreover, the global OA burden attributable to high BMI and its temporal changes must be determined to allow global priorities for OA prevention to be formulated.
Accordingly, we extracted and analyzed data from the Global Burden of Disease Study 2019 (GBD 2019) to determine the burden of OA attributable to high BMI from 1990 to 2019 and the change trends in the global number of DALYs and age-standardized DALY rate for OA attributable to high BMI from 1990 to 2019. In addition, we analyzed our results in terms of age, gender, and the sociodemographic index (SDI). Our findings enhance our understanding of global trends in the OA burden, and our data provide strong support for public health decision-making [1].
Material and methods
Research data
The GBD 2019 examined published literature, survey, and epidemiological data, which were collected and sorted by more than 3,600 researchers in more than 145 countries worldwide. In particular, the GBD 2019 analyzed epidemiological data on more than 350 diseases in 204 countries and regions and then calculated parameters such as the incidence rate, morbidity, mortality, and DALYs. In the current study, we obtained data from the GBD 2019 database and analyzed these data to identify their change trends – i.e., calculated the global total of age-standardized DALYs, the age-standardized DALY rate, and their EAPCs – to determine the global burden of OA attributable to high BMI from 1990 to 2019. This study was approved by the ethics committee of Nanping First Hospital Affiliated to Fujian Medical University, China.
The SDI is a comprehensive index composed of three indicators: per capita income, education level, and total fertility rate. Consequently, the SDI of a region or country reflects its level of social development and is therefore an important variable for assessing its disease burden and level of health. This study analyzed the SDIs of 204 countries worldwide, as the GBD study uses SDIs to classify 204 countries and regions into five quintiles, i.e., low-, low-middle-, middle-, high-middle-, and high-SDI regions.
Case definition
OA is the most common form of arthritis and is characterized by chronic inflammation of, structural changes in, and breakdown of whole joints. For the purposes of this study, the occurrence of OA in the hip, knee, hand (the common sites of OA), and other sites was reviewed. The International Statistical Classification of Diseases and Related Health Problems 10th Revision (ICD-10) codes for OA of the hip, knee, hand, and other sites are M16, M17, M18, and M19, respectively. The ICD-9 code for OA is 715, without specific codes for different sites.
Attribution analysis
We used comparative risk assessment (CRA) in inverse factual analysis. The proportion of the risk of a disease that would be reduced by a risk factor at the theoretical minimum level of exposure in the population is calculated as the population attributable fraction (PAF) of the risk factor, assuming that the exposure to other risk factors remains constant, and the product of the PAF and the disease DALY is the attributable DALY of the risk factor [5]. It is used to study the effect of high BMI on the global burden of OA. This framework provides a comprehensive method for quantifying risk factors and thereby effectively obtaining evidence on correlations between a risk and its outcomes. The CRA framework was thus used to estimate the levels and trends of high BMI and the number of DALYs for OA attributable to high BMI for each age group, gender, year, and location. Statistical models were used to aggregate data, adjust for bias, and incorporate covariates. In addition, the theoretical minimum risk exposure level was used as a counterfactual scenario to estimate the impact of high BMI (as an exposure) on DALYs for OA attributable to high BMI.
Statistical analysis
Age-standardized rates of OA were calculated to determine the global burden of OA attributable to high BMI, and EAPCs in the age-standardized rates of OA were used to describe their change trends with respect to high BMI. If the lower limit of an EAPC in the age-standardized rate of OA attributable to high BMI and its 95% confidence interval (CI) were both greater than 0, this was regarded as indicating that a high BMI had led to an increase in this rate. Conversely, if the upper limit of an EAPC in the age-standardized rate of OA attributable to high BMI and its 95% CI were both less than 0, this was regarded as indicating that a high BMI had led to a decrease in this rate. If neither of the aforementioned conditions was met, it was considered that the age-standardized rate of OA attributable to high BMI had been relatively stable (i.e., had not significantly changed).
Results
Trends in the global burden of OA attributable to high BMI from 1990 to 2019
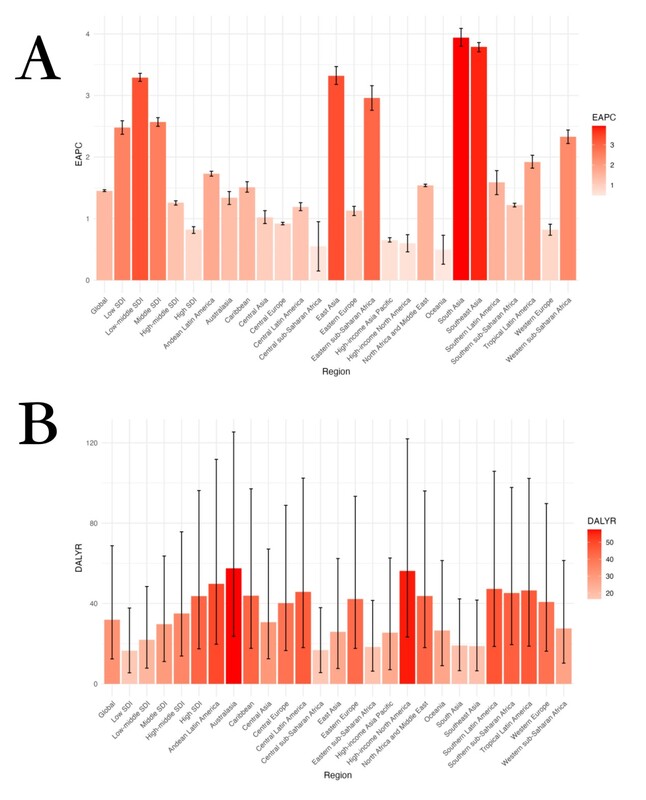
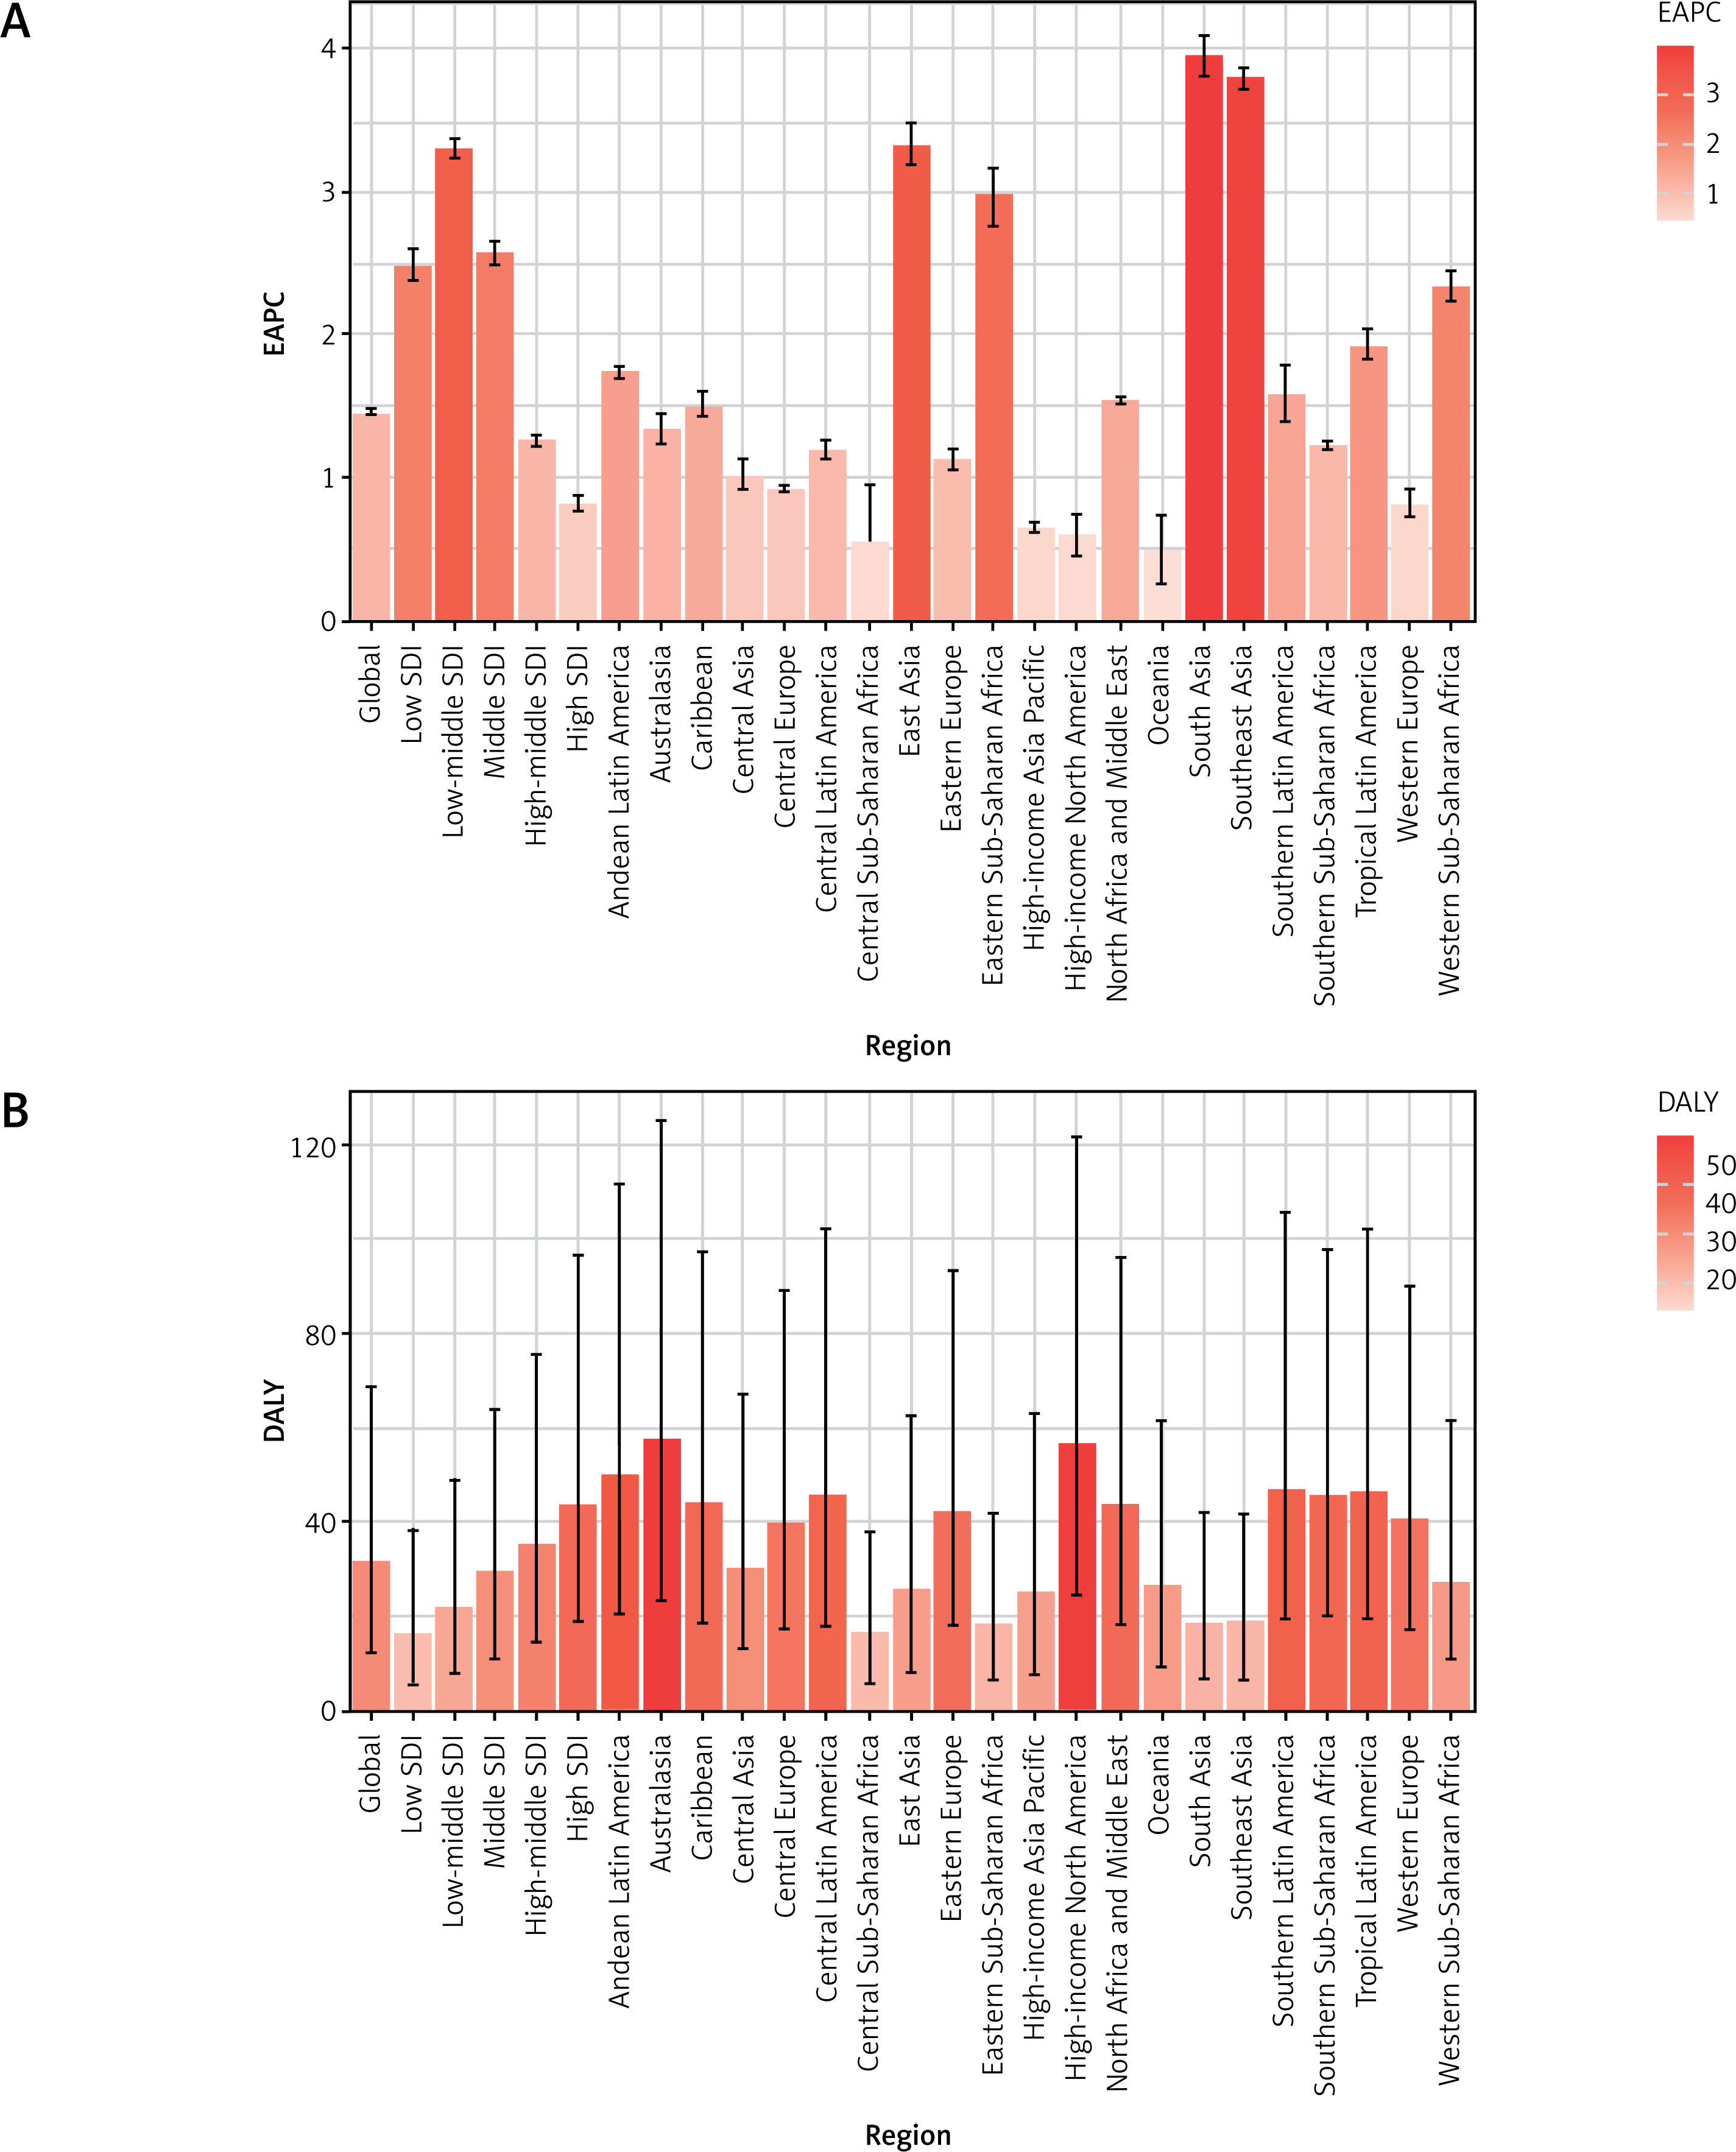
From 1990 to 2019, the global number of DALYs for OA attributable to high BMI increased from 855,232.12 (95% uncertainty interval [UI]: 298,050.76–1,904,099.38) to 2,668,329.84 (95% UI: 1,039,759.44–5,746,329.50; Table I), and the age-standardized DALY rate increased from 21.24 (95% UI: 7.42–47.45) to 31.90 (95% UI: 12.40–68.75; Table I). Moreover, globally from 1990 to 2019, the EAPC in the age-standardized DALY rate for OA attributable to high BMI was 1.45 (95% CI: 1.44–1.47), and over this period, this rate continually increased (Table I, Figure 1 A). In addition, globally from 1990 to 2019, the number of DALYs for OA attributable to high BMI increased. Thus, from 1990 to 2019, the global burden of OA attributable to high BMI increased.
Table I
Number and rate of global osteoarthritis disease-adjusted DALYs attributable to high BMI in 1990 and 2019, and EAPC from 1990 to 2019
Age distribution of the burden of OA attributable to high BMI in 2019
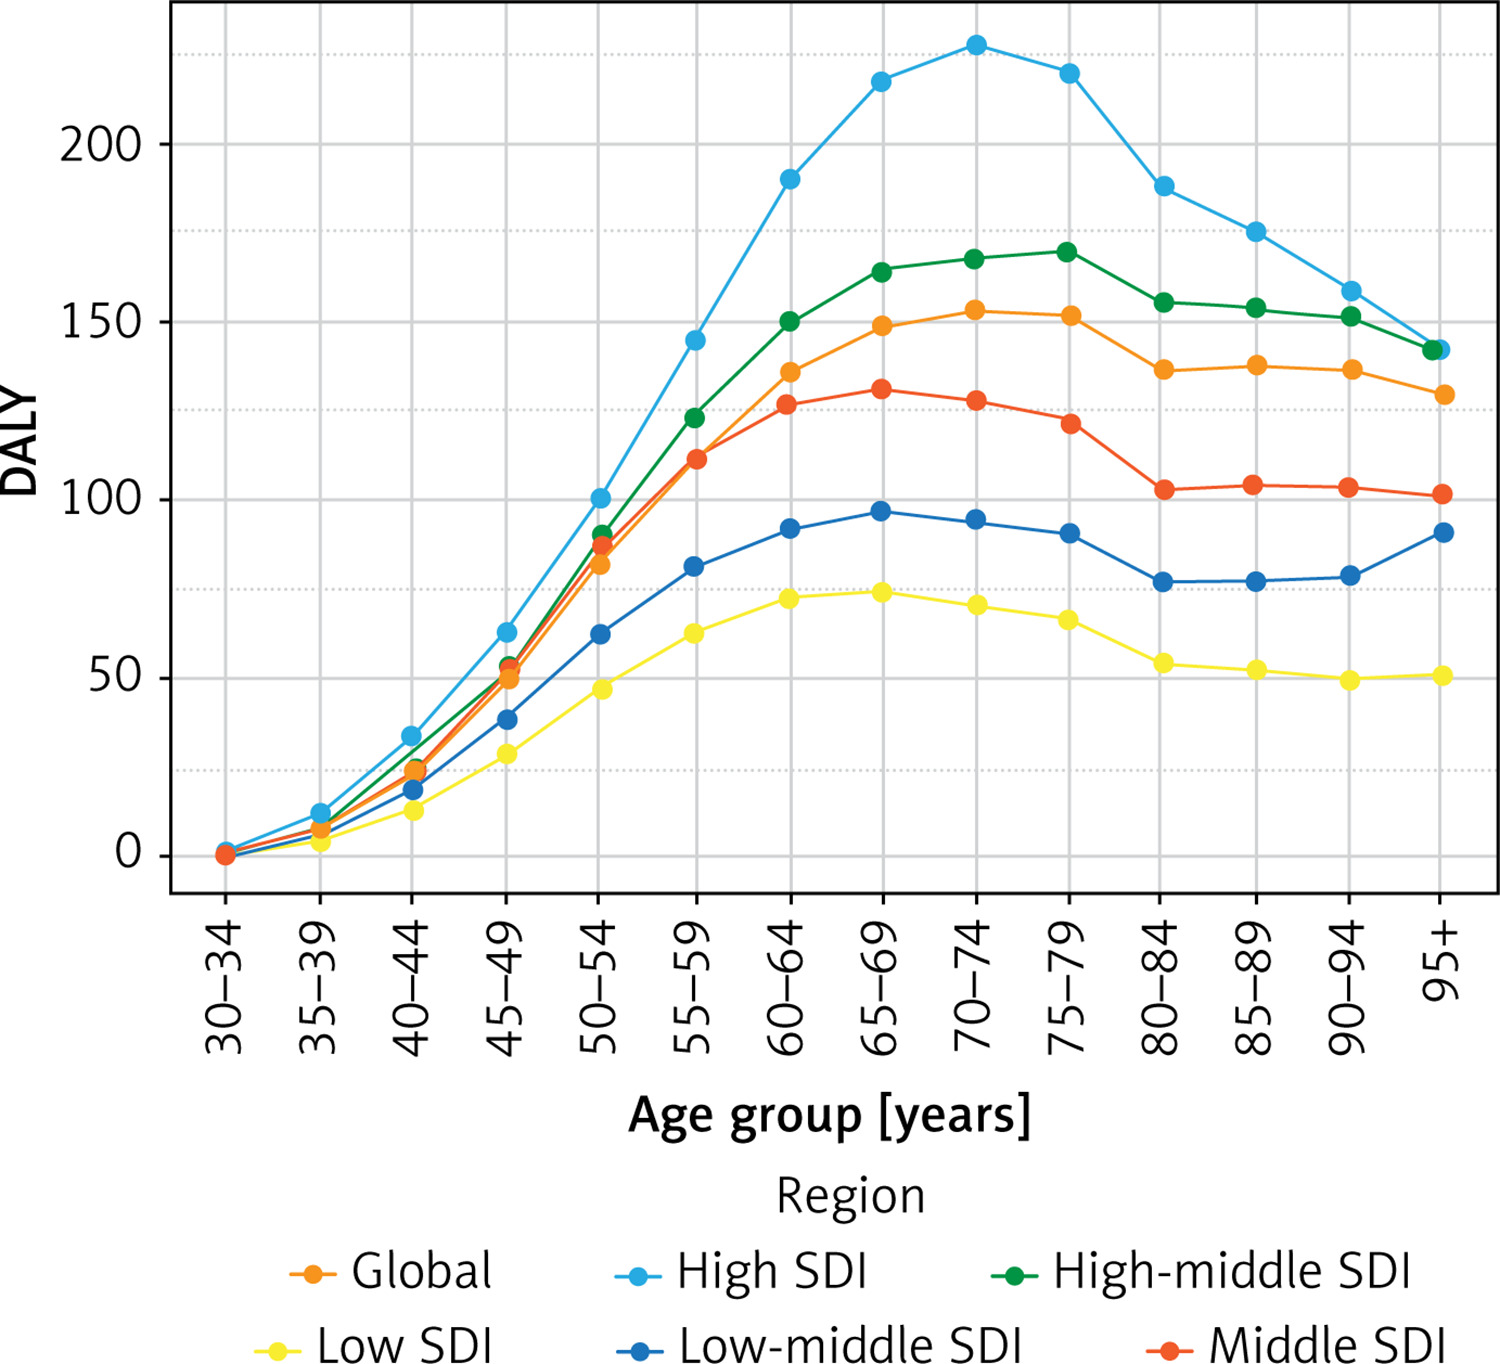
In 2019, in terms of DALYs, the burden of OA attributable to high BMI increased with age, although it decreased in the very old age group. Specifically, it peaked in those aged 70–74, and gradually decreased after the age of 79 (Supplementary Table SI, Figure 2). In 2019, the same trend in DALY rates for OA attributable to high BMI was largely maintained across regions with various SDIs, i.e., these rates significantly increased with age but decreased in the elderly. People in low-, low-middle-, and middle-SDI regions had maximum DALY rates in the youngest age groups. In addition, the average DALY rate peaked in those aged 65–69 and then decreased. Moreover, the maximum DALY rate occurred in those aged 75–79 in middle-high-SDI regions and in those aged 70–74 in high-SDI regions. That is, the maximum DALY rate occurred in middle-high-SDI regions in those who were an average of 5 years older than those in which it occurred in high-SDI regions. Overall, in higher-SDI regions, the maximum DALY rate occurred in older people than it did in lower-SDI regions (Supplementary Table SI, Figure 2). Furthermore, the global burden of OA attributable to high BMI was low in those aged 30–49 and was mainly concentrated in those aged 60–89.
Figure 2
Age-standardized disability adjusted lifeyear (DALY) rate of global osteoarthritis disease burden attributable to high BMI, by region and age
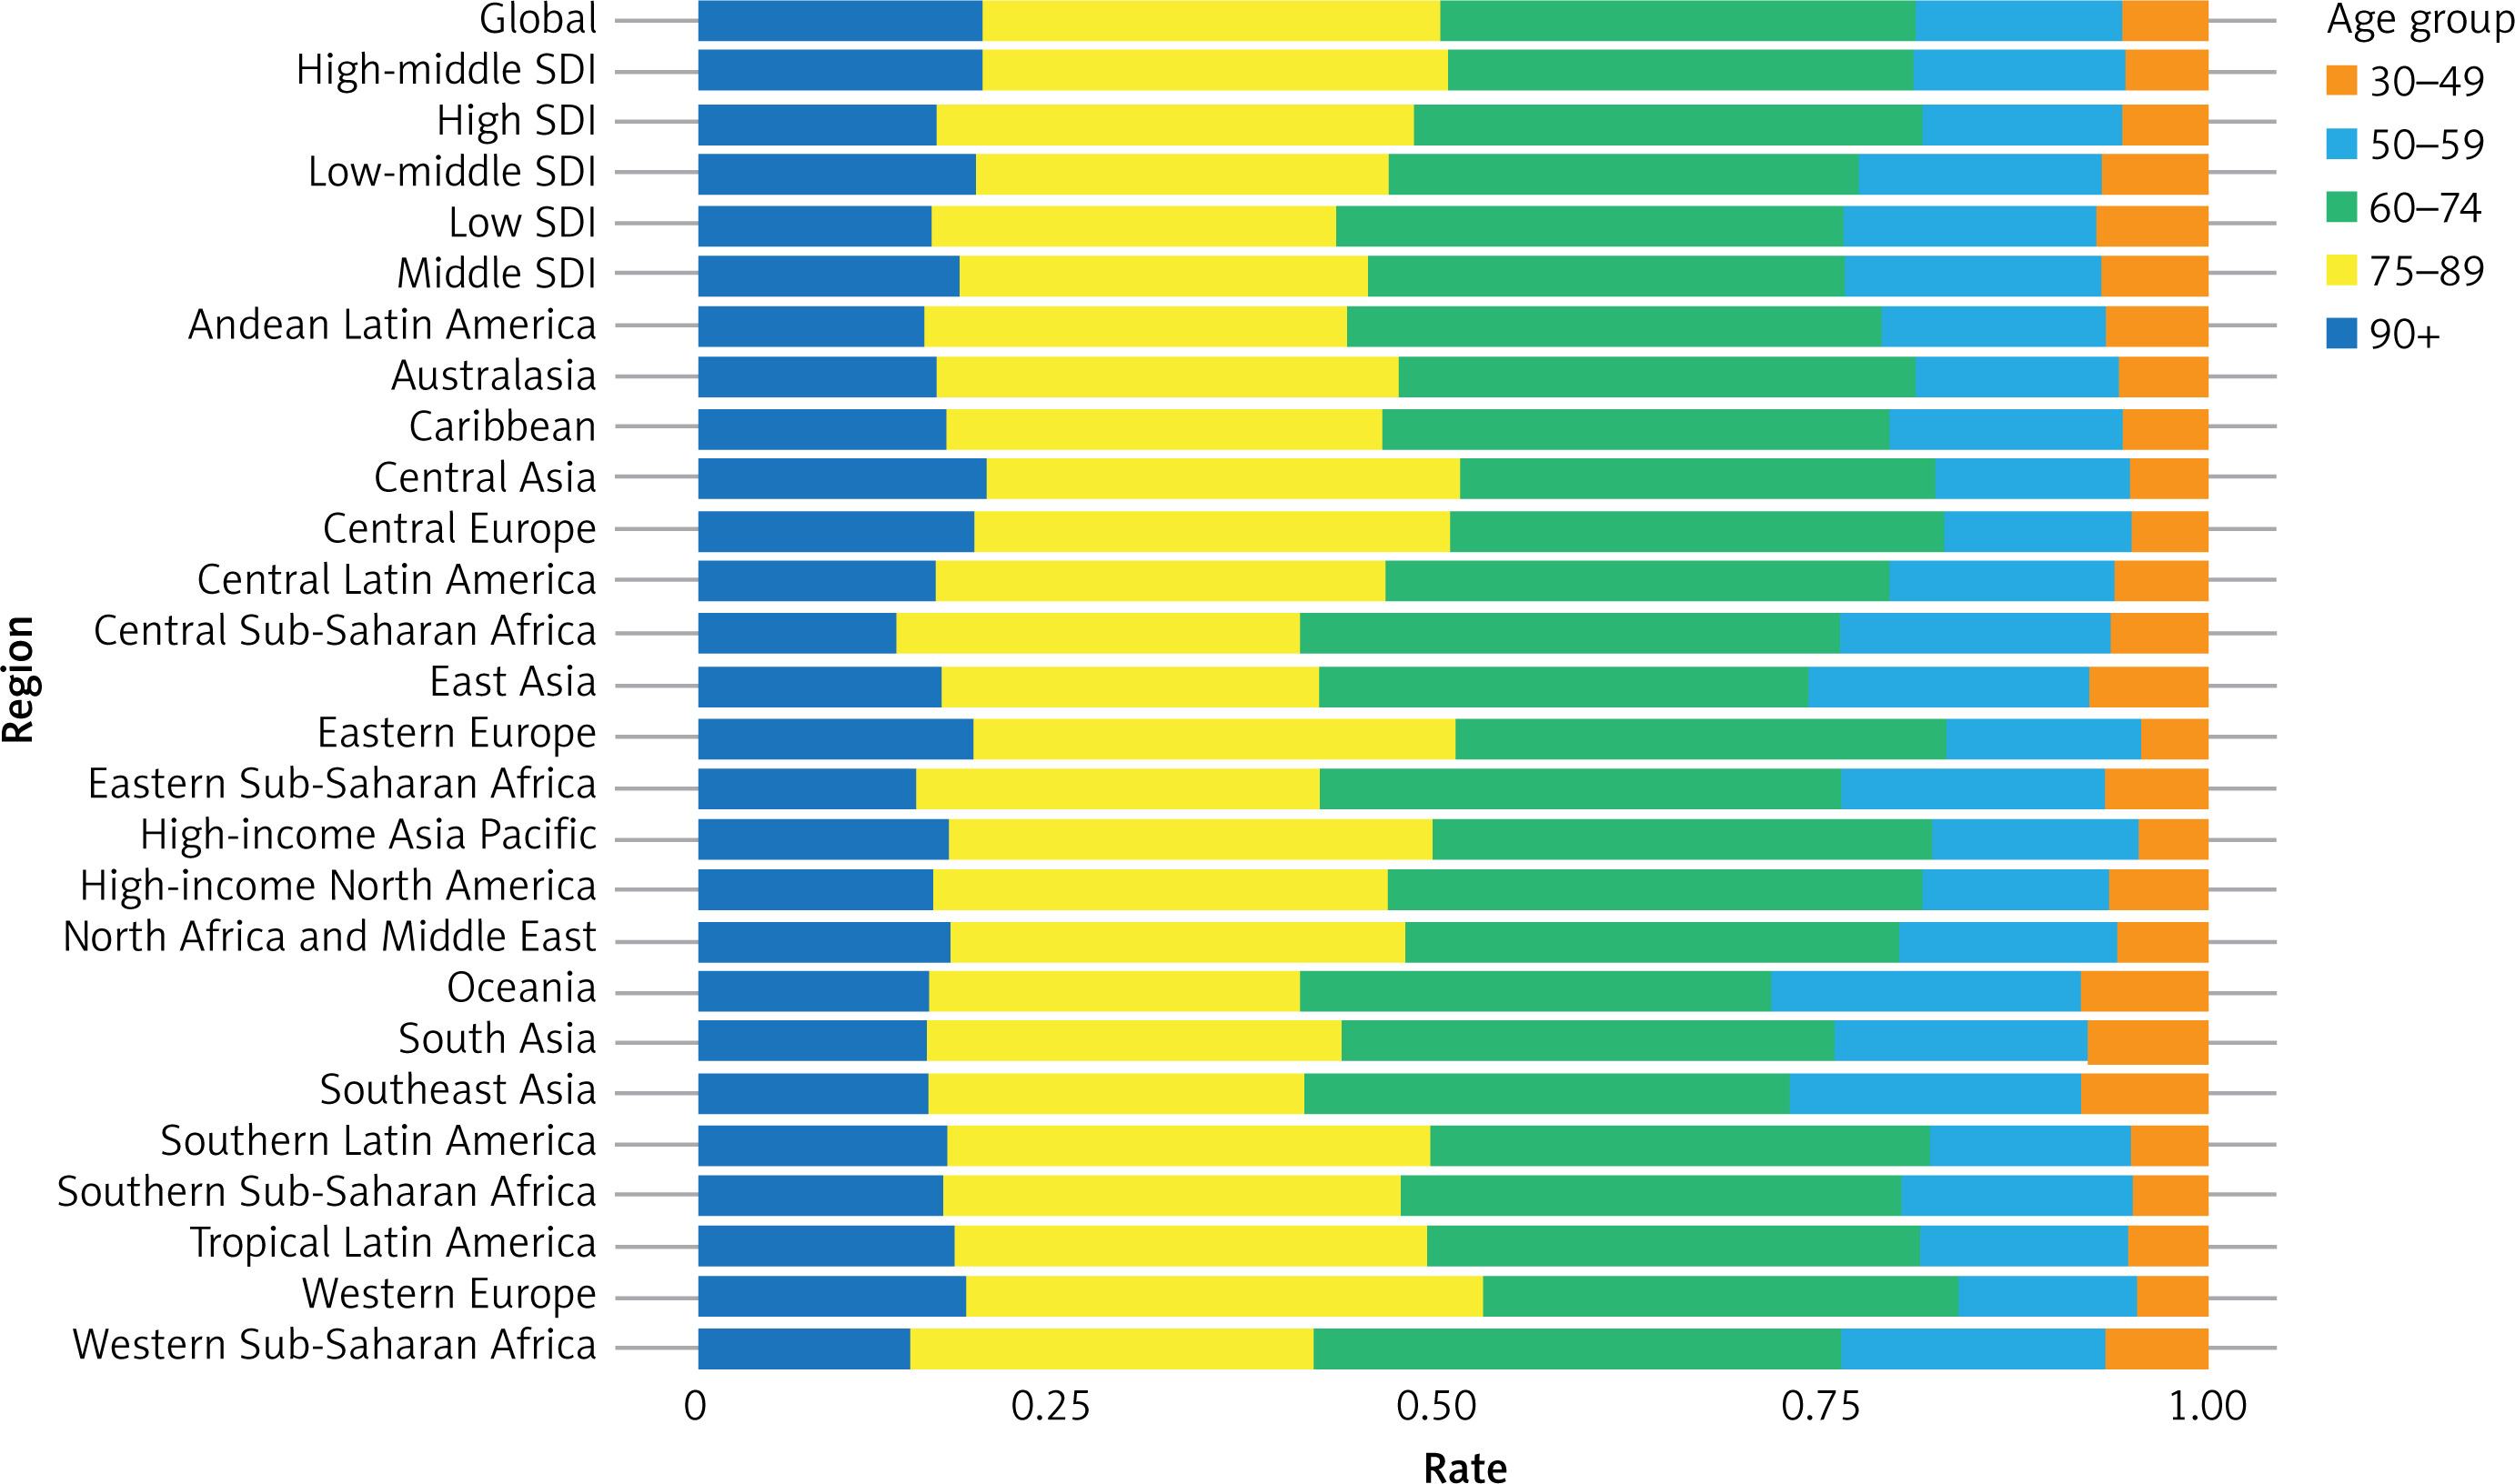
Regarding the age distribution of the OA burden attributable to high BMI in various regions, the DALY rate in people aged over 90 in Oceania, High-income North America, and Eastern Europe was higher than the average DALY rate across all age groups globally. Conversely, the DALY rate in people aged over 90 in Central Sub-Saharan Africa, Eastern Sub-Saharan Africa, and South Asia was lower than the average DALY rate across all age groups globally (Supplementary Table SI, Figure 3).
Gender distribution of the burden of OA attributable to high BMI from 1990 to 2019
From 1990 to 2019, the number of DALYs for OA attributable to high BMI increased in both men and women: from 575,866.58 (95% UI: 21,485.22–1,309,899.06) to 1,715,478.01 (95% UI: 647,529.66–3,755,348.50) in women, and from 279,365.54 (95% UI: 86,646.17–644,516.62) to 952,851.82 (95% UI: 333,582.22–2,088,145.45) in men (Table I). Similarly, from 1990 to 2019, the age-standardized DALY rate for OA attributable to high BMI increased in both men and women: from 27.00 (95% UI: 9.46–61.40) to 39.32 (95% UI: 14.84–86.04) in women, and from 14.55 (95% UI: 4.53–33.59) to 23.74 (95% UI: 8.35–52.23) in men. Moreover, from 1990 to 2019, the EAPC in the age-standardized DALY rate for OA attributable to high BMI trended upward in both men and women, being 1.74 (95% CI: 1.72–1.77) in men and 1.35 (95% CI: 1.33–1.37) in women.
Overall, from 1990 to 2019, the upward trend in the age-standardized DALY rate for OA attributable to high BMI was less pronounced in women than in men, and the increases in this rate and number of DALYs for OA attributable to high BMI were not as substantial in women as they were in men.
In addition, the number of DALYs and age-standardized DALY rate for OA attributable to high BMI in both 1990 and 2019 were lower in men than in women (Table I).
Geographic distribution of the burden of OA attributable to high BMI from 1990 to 2019
Among the 21 geographical regions worldwide (which encompass 195 countries), in 2019, Western Europe (184.94) had the highest age-standardized DALY rate attributable to high BMI, followed by Australasia (181.71) and High-income North America (141.32), whereas Western sub-Saharan Africa (17.25) had the lowest age-standardized DALY rate attributable to high BMI (16.81), followed by Eastern Sub-Saharan Africa (27.96) South Asia (33.23) (Table I, Supplementary Table SIII). From 1990 to 2019, the age-standardized DALY rate attributable to high BMI increased the most in South Asia (3.94), Southeast Asia (3.79), and East Asia (3.32), whereas it increased the least in Oceania (0.49), Central Sub-Saharan Africa (0.55), and High-income North America (0.60) (Table I, Supplementary Table SII).
Among the countries worldwide, in 2019, Puerto Rico had the highest age-standardized DALY rate for OA attributable to high BMI (66.34), followed by the United States Virgin Islands (64.55) and American Samoa (63.60), whereas Somalia had the lowest age-standardized DALY rate attributable to OA (6.39), followed by Timor-Leste (7.04), and the Democratic People’s Republic of Korea (9.95). From 1990 to 2019, the age-standardized DALY rate for OA attributable to high BMI increased the most in Equatorial Guinea (EAPC = 7.42), followed by Nepal (EAPC = 5.30) and Bangladesh (EAPC = 5.48), whereas it decreased the most in the Demographic Republic of the Congo (EAPC = –0.67) (Table I, Supplementary Table SIII, Figure 4).
Figure 4
Estimated annual percentage change (EAPC) of age-standardized disability adjusted life-year (DALY) rate for global osteoarthritis disease burden attributable to high BMI in 204 countries in 2019: A – total group, B – male group, C – female group
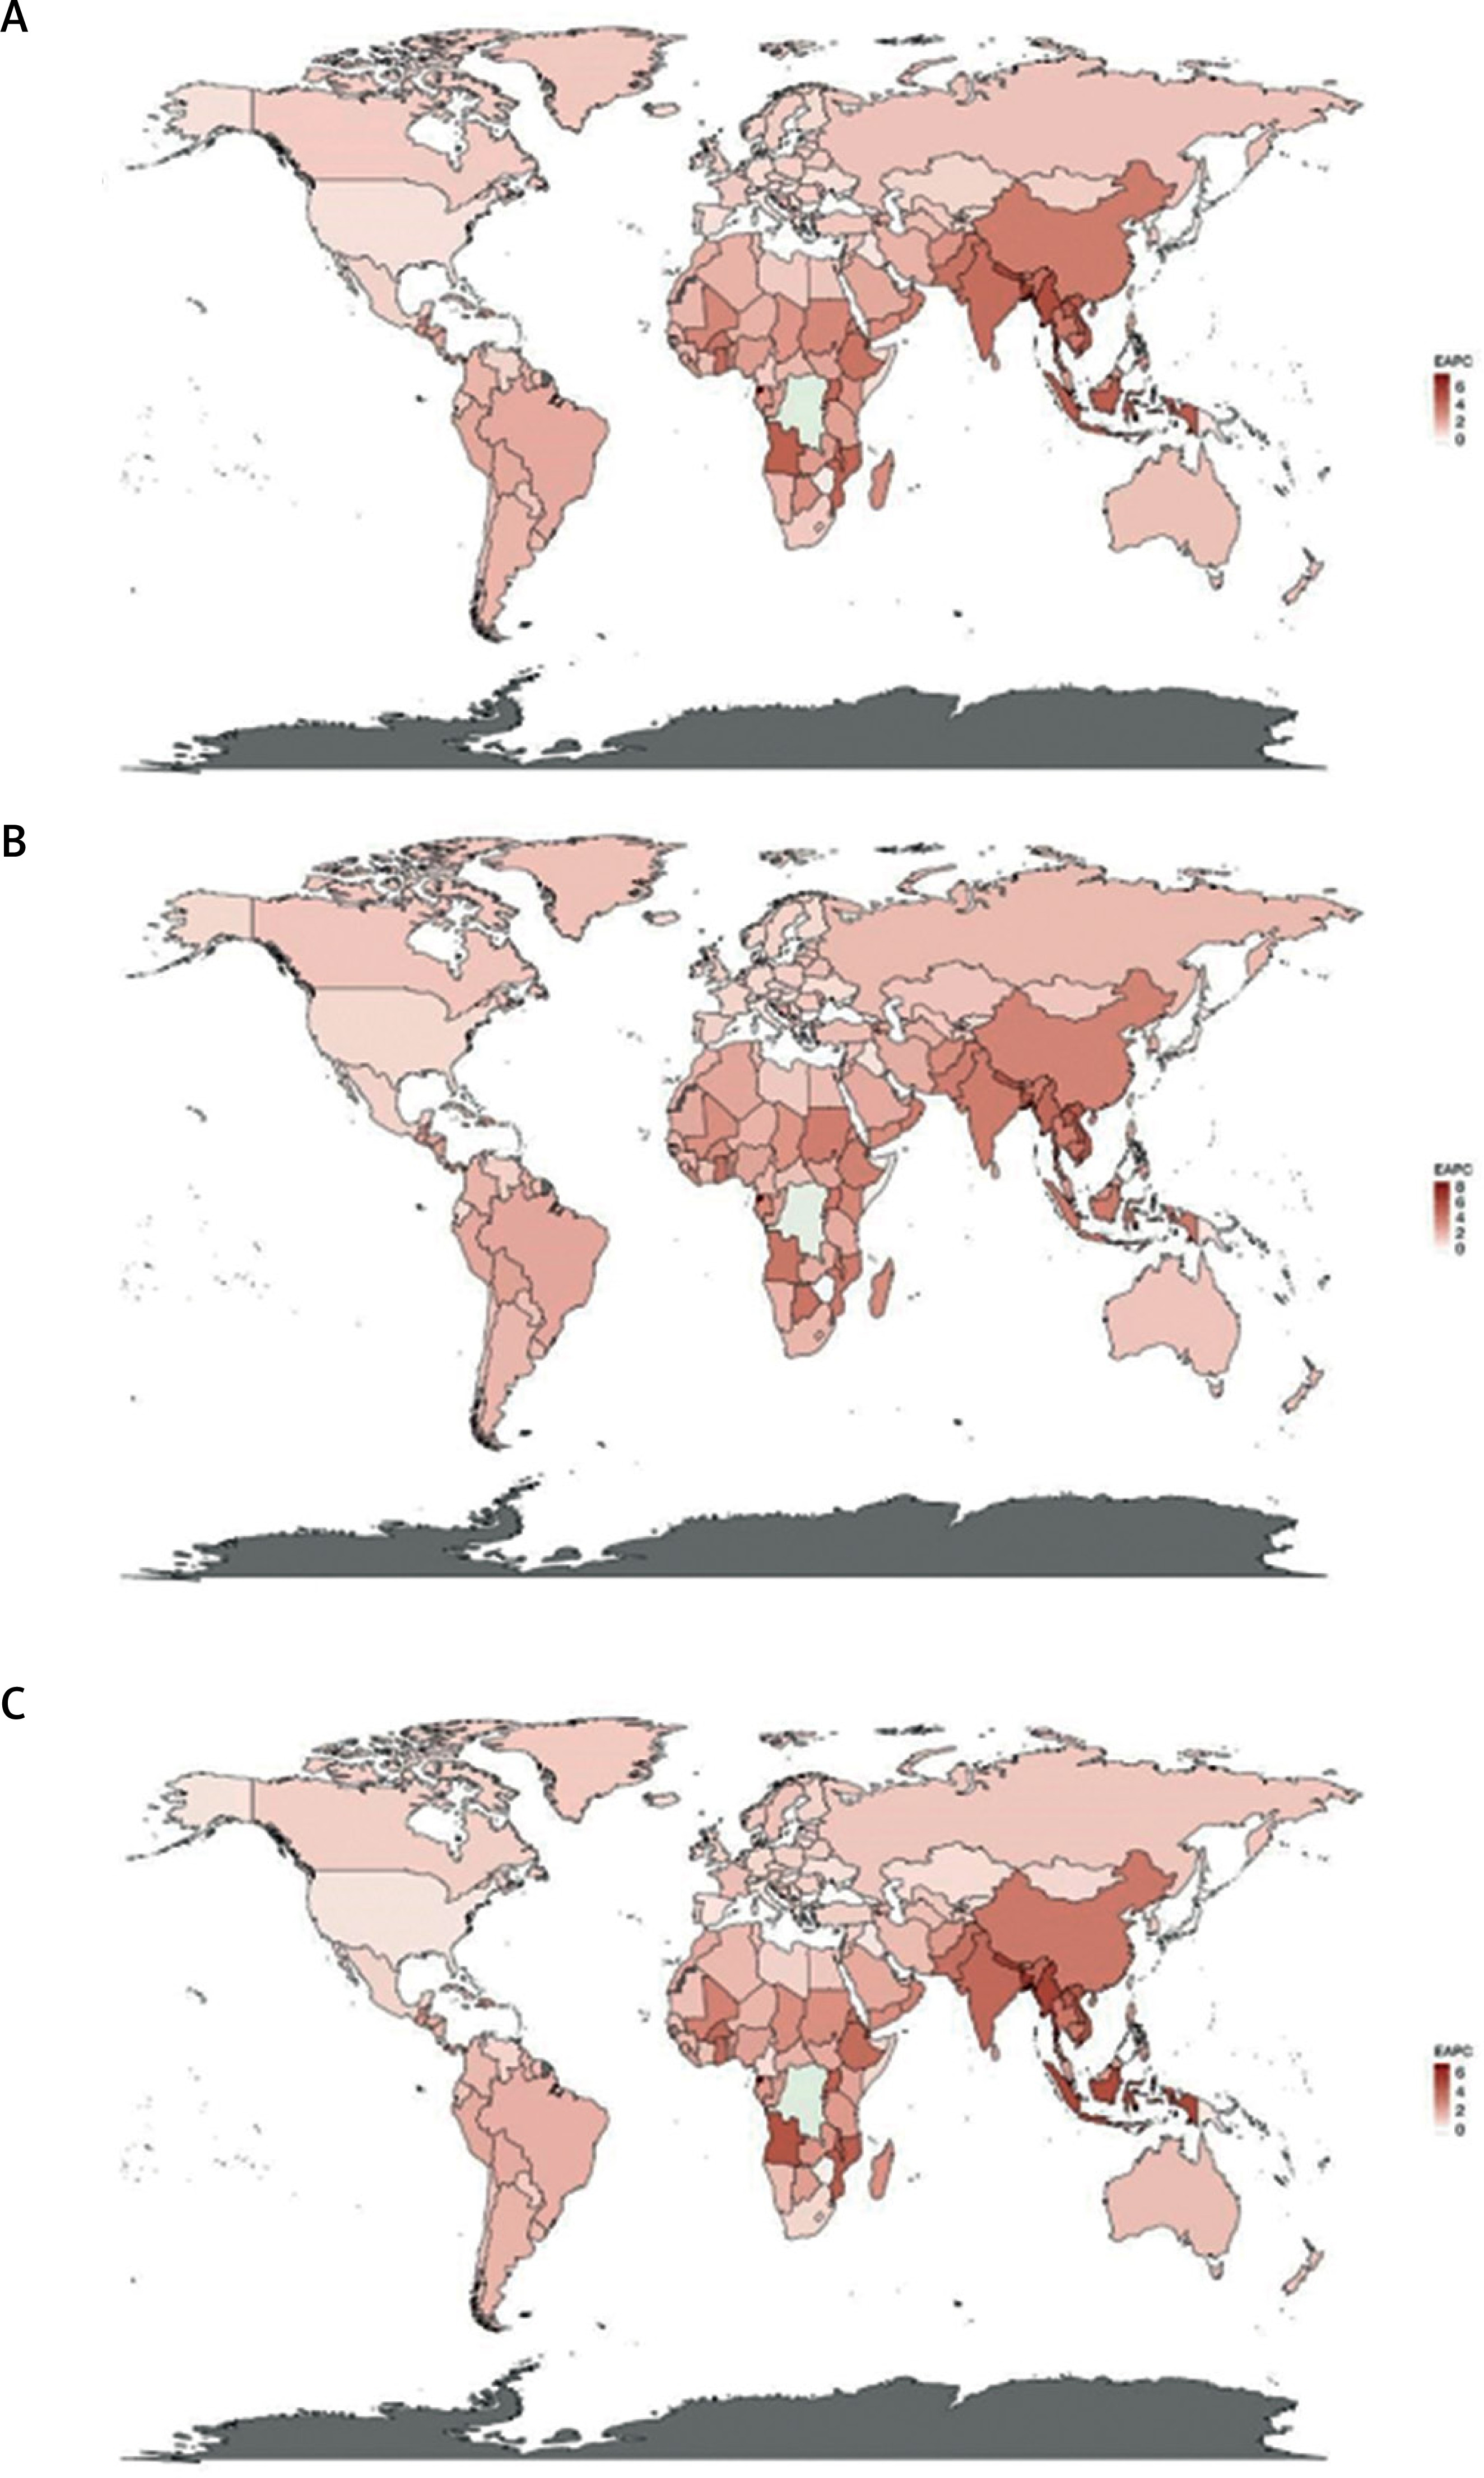
In addition, from 1990 to 2019, among 204 countries in the world, there were marked differences by gender in the EAPCs of age-standardized DALY rates for OA attributable to high BMI. In women, Equatorial Guinea (EAPC = 6.87), Nepal (EAPC = 5.49) and Bangladesh (EAPC = 5.19) had the largest increases in the burden of OA for OA attributable to high BMI, with this ranking being the same in the group with both genders. However, in men, there was only a small difference between Nepal and Bangladesh in terms of the increase in the burden for OA attributable to high BMI (EAPC = 5.33 vs. 5.32) (Table I, Supplementary Table SIII, Figure 4).
Relationship between the burden of OA attributable to high BMI and SDI from 1990 to 2019
In 1990 and 2019, high-SDI regions showed high numbers of DALYs and high age-standardized DALY rates for OA attributable to high BMI. Specifically, in 1990, the number of DALYs in high-SDI regions was 342,409.19 (95% CI: 129,267.65–755,159.72), whereas in low-SDI regions, it was much lower at 21,647.37 (95% CI: 5,540.115–4,752.98). Similarly, in 2019, the number of DALYs in high-SDI regions was 744,139.23 (95% CI: 296,478.79–1,631,379.34), whereas in low-SDI regions it was lower at 93,844.04 (95% CI: 31,644.97–213,835.21) (Supplementary Table SIII). Furthermore, in high-SDI regions in 1990, the age-standardized DALY rate was 33.81 (95% CI: 12.77–74.78), whereas in low-SDI regions, it was only 8.43 (95% CI: 2.15–21.27). Similarly, in 2019, the age-standardized DALY rate was 43.67 (95% CI: 17.41–96.19) in high-SDI regions, whereas it was much lower at 16.50 (95% CI: 5.48–37.72) in low-SDI regions. Thus, as the SDI of a region increased, so did its burden of OA attributable to high BMI (Table I, Supplementary Table SIV).
However, from 1990 to 2019, the growth trends in the age-standardized DALY rates for OA attributable to high BMI varied with regions’ SDIs. The highest EAPC in the age-standardized DALY rate occurred in low-middle SDI regions (EAPC = 3.29, 95% CI: 3.23–3.36), whereas the lowest EAPC in the age-standardized DALY rate occurred in high-SDI regions (EAPC = 0.82, 95% CI: 0.76–0.87). Thus, the growth trend in the burden of OA attributable to high BMI from 1990 and 2019 did not correspond to the burdens in 1990 and 2019, but the global burden generally increased from 1990 to 2019.
As the SDI increased, the global age-standardized DALY rate for OA attributable to high BMI first decreased, then increased, then decreased again, and then finally increased again. In regions with an SDI that was initially less than 0.60, as the SDI increased, the age-standardized DALY rate first decreased and then increased, and then decreased to a minimum at an SDI of approximately 0.37, and finally increased until an SDI of 0.60. In regions with an SDI that was initially greater than 0.60, as the SDI increased, the age-standardized DALY rate first decreased and then increased, but generally remained unchanged. This indicates that the burdens of OA attributable to high BMI were almost identical across high-SDI regions, whereas they were significantly different across low-SDI regions (Table I, Supplementary Table SIV, Supplementary Figure S1).
The overall global growth in the burden of OA attributable to high BMI exhibited a slow downward trend as the SDI increased. In regions with an SDI that was initially less than 0.30, the growth in the burden increased slightly as the SDI increased, whereas in regions with an SDI that was initially greater than 0.30, the growth in the burden decreased rapidly as the SDI increased, and finally increased slightly in the highest-SDI regions. This indicates that the growth in this burden will continue decreasing in the near future, as regions’ SDIs increase (Table I, Supplementary Tables SIII, SIV, Supplementary Figure S2).
Factors influencing EAPCs in the global burden of OA attributable to high BMI
We found that the SDI of a country or region in 2019 significantly correlated with the EAPC in its age-standardized DALY rate for the OA burden attributable to high BMI from 1990 to 2019 and the age-standardized DALY rate for this burden in 1990. The latter represents the baseline health burden, and the SDI in 2019 is a measure of the level of healthcare and development in a country or region in that year.
Specifically, first, we found that there was a significant negative correlation (t = –14.651, r = –0.7177588; p < 2.2e-16) between the EAPC in the age-standardized DALY rate from 1990 to 2019 and the DALY rate in 1990 with respect to the burden of OA in a region or country attributable to high BMI. This shows that compared with countries or regions with a lower baseline burden of OA attributable to high BMI, those with a higher baseline burden of OA attributable to high BMI had a slower rate of growth in this burden from 1990 to 2019 (Supplementary Figure S 3A).
Second, we found that there was a significant moderately negative correlation between the EAPC in the age-standardized DALY rate of the global burden of OA attributable to high BMI from 1990 to 2019 and SDIs (t = –7.7957, r = –0.5294821; p < 2.2e-16). Specifically, the graph shows that in regions with SDIs less than 0.5, there was a slight positive correlation between SDIs and the EAPC in the age-standardized DALY rate of the global burden of OA attributable to high BMI. This indicates that from 1990 to 2019, as SDIs increased, there was faster growth in this burden in regions that initially had lower SDIs than in those that initially had higher SDIs. Conversely, in this period in regions with SDIs of 0.5 to 1, there was a significant negative correlation between SDIs and the EAPC in this rate. This indicates that in this period, as SDIs increased, there was a slower increase in the OA burden attributable to high BMI in regions that initially had higher SDIs than in those that initially had lower SDIs (Supplementary Figure S 3B, Supplementary Tables SV, SVI).
Discussion
This study analyzed data on the global burden of OA attributable to high BMI that were obtained from the GBD 2019. The results show that the distribution of this burden differed substantially between countries and regions.
From 1990 to 2019, the number of DALYs and age-standardized DALY rates for the global OA burden attributable to high BMI increased, which may be attributable to the significant increase in obesity rates worldwide in the past few decades. The result is the same as in previous studies [6, 7]. A high BMI is typically associated with obesity, which may be an important factor contributing to increases in the burden of OA [8–10]. For example, obesity may increase pressure on joints, especially the knee and hip joints, thus increasing the risk of OA. Another possible reason for the increase in this burden is population aging: as this occurs globally, the incidence rate of OA may increase, as the elderly are more likely to suffer from OA than younger people, because the wear and tear of joints increases with age [11]. A further possible reason for the increase in this burden is the adoption of modern lifestyles, which can feature unhealthy eating habits and a lack of exercise, which may lead to an increase in BMI and thereby increase the risk of developing OA. A final possible reason is that advances in medical technology have resulted in increases in the number of diagnoses of OA [10].
In 2019, the global burden of OA attributable to high BMI increased with age and peaked in those aged 70–74. The age at which this maximum occurred varied with regions’ SDIs, but the overall burden across regions of the world was concentrated in those aged 60–89 [11, 12]. This may be because OA is an age-related disease, as described above. However, in the very old age group, a decrease in this burden was observed; this may be because compared with other age groups, this age group is smaller and has other, more serious health problems. In low-, low-middle-, and middle-SDI regions, the burden peaked in the young age group, which may because people in these regions have poor living conditions and malnutrition, and lack necessary medical care, which can lead to early onset of OA. In contrast, in middle-high- and high-SDI regions, the burden of OA peaked in the older age group, which may be because people in these regions have better living conditions and medical care, which can delay the age of onset of OA. Regarding the between-region differences in the age distribution of the burden of OA attributable to high BMI, the proportion of the burden in those aged over 90 was high in High-income North America, Oceania, and Eastern Europe, which may be due to the long lifespans of populations in these regions [13–15]. In contrast, the proportion of the burden in those aged over 90 was low in Central Sub-Saharan Africa, Eastern Sub-Saharan Africa, and Southeast Asia, which may be due to the short lifespans of populations in these regions [8, 9, 16].
From 1990 to 2019, the burden of OA attributable to high BMI increased in both men and women, but increased more in women than in men. In addition, although the growth rate of the age-standardized DALY rate of the burden increased more slowly in women than in men, the baseline rate was higher in women than in men [11]. This is likely attributable to the relationship between gender and OA. For example, studies have shown that women are more likely to develop OA than men, especially post-menopausal women. This may be because estrogen supports bone health, and thus post-menopausal decreases in women’s estrogen concentrations may increase their risk of OA [14]. There is also a relationship between gender and BMI. In many communities, women have a higher BMI than men, which may be due to socio-cultural, biological, or lifestyle factors, and a high BMI is a risk factor for OA [14]. Gender differences also play a role in the growth trends in OA burden; although this growth trend was found to be slower in women than in men, this might have been because more women than men had OA at baseline, which ultimately led to the numbers of DALYs for OA attributable to high BMI being higher in women than in men [11, 13, 17].
In 2019, among 21 geographical regions in the world, the highest age-standardized DALY rate for OA attributable to high BMI occurred in Oceania, followed by High-income North America and Andean Latin America, whereas the lowest occurred in Central Sub-Saharan Africa. From 1990 to 2019, the rate increased the most in South Asia, Southeast Asia, and East Asia, whereas it increased the least in Oceania, Central Sub-Saharan Africa, and High-income North America. Among all of the countries of the world, in 2019, the rate was highest in Puerto Rico and lowest in Somalia. From 1990 to 2019, the rate increased the most in Equatorial Guinea and decreased only in the Democratic Republic of the Congo.
The burden of OA attributable to high BMI might have varied between geographical regions due to region-specific factors. For example, the fact that the burden was highest in Oceania, High-income North America, and Andean Latin America might have been because people in these regions have lifestyles and dietary habits that lead to an increase in BMI [11, 18], e.g., a high intake of calories and a low level of physical activity, which in turn increases the risk of OA. In contrast, the fact that the burden was lowest in Central Sub-Saharan Africa, Eastern Sub-Saharan Africa, and South Asia might have been because people in these regions have poor living conditions and malnutrition, which leads to a decrease in BMI and thus reduces the risk of OA [11]. Similarly, the burden might have varied between countries due to country-specific factors. For example, the burden was highest in Puerto Rico, the United States Virgin Islands, and American Samoa, which may be because people in these countries have lifestyles and dietary habits that lead to high BMIs. In contrast, the burden was lowest in Somalia, Timor Leste, and the Democratic People’s Republic of Korea, which may be because people in these countries have poor living conditions and malnutrition, which lead to a decrease in BMI. Furthermore, in 204 countries worldwide, the burden increased faster in women than in men, which is probably because women are more likely to develop OA than men due to post-menopausal decreases in the concentration of estrogen, as mentioned above [4, 11, 18].
We also found that from 1990 to 2019, the burden of OA attributable to high BMI was higher in high-SDI regions than in low-SDI regions [19]. However, as the SDI increased, the growth trend in the burden first decreased and then increased, which indicates that there is a complex relationship between the SDI and the burden of OA attributable to high BMI [11, 18]. Several types of factors may account for this relationship. The first type of factors comprises lifestyle and environmental factors. Compared with people living in low-SDI countries, those living in high-SDI countries may have lifestyles, such as those featuring a high intake of high-calorie foods and a lack of exercise, that make them more likely to have a high BMI [20]. In addition, compared with environments in low-SDI countries, those in high-SDI countries may tend to be more contributory to the development of a high BMI; e.g., convenient transportation facilities may lead people to favor their use over walking or cycling. The second type of factors comprises medical resource factors. In high-SDI countries, medical resources are usually abundant, so it may be easy to detect and diagnose diseases such as OA, thereby leading to a high burden of OA being identified. Aging is also an important factor; that is, compared with low-SDI countries, high-SDI countries have better healthcare systems and higher living standards, and thus their residents may have longer average lifespans [21]. Therefore, as the occurrence of OA is closely associated with increased age, the burden of OA may be higher in high-SDI countries than in low-SDI countries. In contrast, in low-SDI countries, as the SDI increases, the corresponding increase in the burden of OA attributable to high BMI may be most related to rapid urbanization and lifestyle changes. For example, the transformation from a traditional agrarian economy to an industrial or service-industry economy may significantly reduce people’s level of activity and alter their dietary habits, thereby leading to an increase in BMI [22].
Finally, we found that from 1990 to 2019, the global growth rate of (i.e., EAPC in) the age-standardized DALY rate for OA attributable to high BMI was significantly negatively correlated with the burden in 1990 and the SDI in 2019. That is, the growth rate of the burden slowed as the baseline burden and SDI increased [23]. There are two possible reasons why an increase in the baseline burden had this effect. First, as the baseline burden increases, more public health interventions and strategies may be implemented to mitigate its effects [24], such as interventions and strategies to improve diets and lifestyles, provide improved medical services, and increase public awareness of the relationship between a high BMI and OA. Second, over time, more effective treatments for and methods of managing OA (e.g., drugs, surgical techniques, or pain management strategies) may be developed and implemented. Similarly, an increase in the SDI might have had this effect because compared with low-SDI countries, high-SDI countries might have better healthcare systems and more resources (e.g., better medical facilities, more doctors and nurses, and better public health strategies) to prevent and manage OA. In addition, compared with residents of low-SDI countries, residents of high-SDI countries may have better health knowledge and behaviors (e.g., healthier diets and higher levels of physical activity), which may help to maintain healthy BMIs [25].
In general, the above-described analysis of our findings shows that a high BMI is an important factor affecting the global burden of OA. Efforts to prevent and control OA worldwide should focus on achieving the following five goals. First, health education and publicity should be strengthened, and public awareness of BMI, OA, and their relationship should be increased. The public should be educated on the importance of having a healthy diet and performing a moderate level of exercise for maintaining a healthy BMI, and how this can reduce the risk of OA. Second, diet and exercise interventions should be used to promote healthy lifestyles, such as by providing nutritional guidance, encouraging regular exercise, and providing healthy food choices. These measures can help people to reduce their BMI and thereby their risk of OA. Third, early screening and interventions should be implemented in high-risk populations (such as those with high BMI or a family history of OA) [26], as this can reduce the risk of OA [27]. Fourth, medical services should be improved such that high-quality pain management, physical therapy, and surgical treatments are available for those with OA to help them to manage symptoms, improve their quality of life, and reduce the burden of OA. Fifth, policy interventions should be devised by governments to reduce the risk of developing a high BMI. These could include restricting advertising of high-sugar and high-fat foods, providing tax incentives for healthy foods, and building additional public sports facilities.
Our study has some distinct strengths. This study included OA in the hip, knee, hand (the common sites of OA), and other sites; the types of OA were more comprehensive than in previous studies. This study used the standardized GBD methodology for comparison across geographies and years, and reported the OA disease burden trend over the last three decades in all of the world. In data scarcity, the GBD study uses covariates and other techniques that borrow strength over space and time to generate the best possible estimates [28].
There were some limitations in this study: The major limitation of the GBD analysis of the burden of diseases and injuries is the availability of primary data [29]. This study was based on the GBD 2019 study; since OA measurement is heterogeneous, it is difficult to compare estimates across populations, and it can lead to errors [30]. Nonetheless, efforts are required to develop population-level registries and disease surveillance systems to monitor OA burden trends and their risk factors worldwide.
In conclusion, this study found that the distribution of the global burden of OA attributable to high BMI varied substantially between countries and regions. From 1990 to 2019, the global number of DALYs and age-standardized DALY rate for OA attributable to high BMI increased. Moreover, in this period, the number of DALYS and the age-standardized DALY rate increased in both men and women. In 2019, the age-standardized DALY rate increased with age, but decreased in the very old age group. In regions with different SDIs, the age trends in the DALY rate remained largely the same: there was a significant increase with age and a decrease in the elderly. From 1990 to 2019, among the 21 geographical regions worldwide, the age-standardized DALY rate in South Asia (EAPC = 3.94) increased the most, while that in Oceania (EAPC = 0.49) increased the least. From 1990 to 2019, among the 204 countries worldwide, Equatorial Guinea had the largest increase in the age-standardized DALY rate (EAPC = 7.42), whereas the Democratic Republic of the Congo had the largest decrease (EAPC = –0.67). In general, the burden was higher in high-SDI regions than in low-SDI regions.
The correlation analysis revealed that the global growth rate of the age-standardized DALY rate for OA attributable to high BMI was significantly negatively correlated with the age-standardized DALY rate in 1990 and with the SDI in 2019. As the baseline burden and SDI increased, the growth rate of the age-standardized DALY rate slowed.
The above conclusions indicate that high BMI is an important factor affecting the global burden of OA, which increases with age and is higher in some regions and populations than in others. This highlights the importance of preventing and managing high BMI to reduce the burden of OA worldwide.