Introduction
Polycystic ovary syndrome (PCOS) is one of the most common endocrine, reproductive and metabolic disorders in women of childbearing age [1]. The prevalence of PCOS in Europe varies widely, which could be attributable to different environmental and genetic factors [2]. Lifestyle modification in combination with metformin is considered as the main treatment strategy for the metabolic phenotype of the syndrome. However, treatment goals including weight loss and normalization of glycaemic and lipid profile often remain unmet with the established approach, and the need for novel treatment options is growing [1, 3].
Cholecystokinin (CCK) is a digestive hormone, neuromodulator and neurotransmitter. Its biological actions are mediated by its binding and activation of cholecystokinin A receptor (CCKAR) and cholecystokinin B receptor (CCKBR) [4]. Binding of CCK via CCKAR increases postprandial satiety, increases secretion of digestive enzymes and endocrine hormones in the pancreas, acts as a growth factor on pancreatic β cells, increases postprandial gallbladder emptying and delays gastric emptying. Binding of CCK or gastrin via CCKBR regulates pancreatic growth [4]. Furthermore, studies in mice with a homozygous Cckbr deletion suggest that CCKBR could also increase postprandial satiety and improve glucose tolerance [5]. Therefore, CCK receptor agonists have a potential for the treatment of obesity, type 2 diabetes and also PCOS with high metabolic risk [6].
Many common functional polymorphisms are present in CCKAR and CCKBR genes that might affect signalling of endogenous CCK. Only a few studies addressing their genetic variability have been conducted to date [7, 8]. A study of middle-aged and elderly adults showed that the homozygous carriers of two CCKAR promoter polymorphisms had increased fat content, higher insulin and higher leptin levels than wild-type and heterozygous individuals [7]. Another study reported an association between CCKBR polymorphisms and antipsychotic-induced weight gain in patients with schizophrenia [8].
According to our knowledge, the role of the CCKAR and CCKBR polymorphisms in patients with PCOS has not been addressed yet. We aimed to investigate genetic variability of CCKAR and CCKBR and their relationship with anthropometric and metabolic parameters in patients with PCOS.
Material and methods
Our cross-sectional study included 168 patients with PCOS treated at the outpatient clinics of Department of Endocrinology, Diabetes and Metabolic Diseases at the University Medical Centre (UMC), Ljubljana. Women were eligible for enrolment if they were more than 18 years old, premenopausal and diagnosed with phenotype A PCOS according to Rotterdam criteria. Pregnant women and women who had diabetes were excluded. The study was approved by the Republic of Slovenia National Medical Ethics Committee and was carried out according to the Helsinki Declaration.
Anthropometric characteristics included were height, weight, waist circumference, body mass index (BMI) and visceral adipose tissue (VAT) area. Waist circumference was measured in a standing position midway between the lower costal margin and the iliac crest. BMI was calculated as the weight in kilograms divided by square of height in meters. Whole-body composition was assessed by dual-energy X-ray absorptiometry (DXA) (Discovery A; Hologic, Waltham, MA, USA) with the software provided by the manufacturer (QDR for Windows Version 12.5). Metabolic characteristics were obtained by drawing fasting blood and determining fasting blood glucose and insulin. Afterwards patients underwent a standard 75 g oral glucose tolerance test (OGTT). Glucose levels were determined using a standard glucose oxidase method (Beckman Coulter Glucose Analyzer, Beckman Coulter Inc., Brea, CA). Insulin levels were determined by immunoradiometric assay (Biosource Europe S.A., Nivelles, Belgium). Homeostasis model assessment (HOMAIR) score calculation was applied as a measure for insulin resistance (IR) [9]. Values greater than 2.0 were considered as indicative of the presence of IR [10]. The World Health Organization diagnostic criteria of 2006 were used to determine basal baseline glycemia, impaired glucose tolerance and type 2 diabetes [11].
In addition, the healthy control group included 82 first year female students of the Nursing programme at the University of Ljubljana, Faculty of Health Sciences. The data on anthropometric characteristics included weight, BMI, waist circumference, visceral fat, fat mass and fat free mass, and the metabolic syndrome burden was defined as described by Šoštarič et al. [12].
With regards to molecular genetic analysis, genomic DNA was extracted from venous blood using a FlexiGene DNA kit (Qiagen, Hilden, Germany). Polymorphisms in CCKAR and CCKBR were selected using the LD TAG SNP Selection tool [13]. We considered only polymorphisms with a minor allele frequency (MAF) equal to or greater than 0.05 in the European population and a putative functional effect predicted using the SNP function prediction [13]. Linkage disequilibrium was checked using the LDlink program for final selection of tag polymorphisms [14]. In total, two CCKAR tag polymorphisms (rs6448456, rs1800857) and four CCKBR tag polymorphisms (rs2929180, rs1800843, rs1042047, rs1042048) were genotyped using competitive allele specific KASPar assays according to the manufacturer’s instructions (LGC, England). The selected polymorphisms, their predicted effect and genotype frequencies in our sample are shown in Supplementary Table SI. The genotype frequencies of the CCKBR rs2929180 and the CCKBR rs1042047 polymorphisms were not in Hardy-Weinberg equilibrium (HWE) in PCOS patients; thus, CCKBR rs1042047 was excluded from further statistical analysis.
Statistical analysis
In the statistical analysis, the median and interquartile range were used to describe the central tendency and variability of continuous variables. Frequencies were used to describe the distribution of categorical variables. Deviation from HWE was evaluated using a standard χ2 test. If the genotype frequencies for a polymorphism were not in HWE, we used Fisher’s exact test to compare the distribution of genotype frequencies of our sample with the expected distribution in the European population. In the subsequent analyses, a dominant genetic model was used. A nonparametric Mann-Whitney test was used to assess the associations of polymorphisms with continuous variables. Spearman’s rho (ρ) was used to evaluate correlations between continuous variables. A p-value of < 0.05 was considered statistically significant. All statistical analyses were performed with IBM SPSS Statistics, version 21.0 (IBM Corporation, Armonk, NY, USA).
Results
Anthropometric and metabolic characteristics of PCOS patients (N = 168) are presented in Table I. The median total cholesterol and TAG were within the reference interval, while the median HDL was lower, and LDL was higher than the reference value. Insulin resistance was present in 71 out of 98 (72.4%) patients as assessed by HOMAIR. Median fasting glucose and glucose concentration after 120 min and fasting insulin and insulin concentration after 120 min were within the reference interval. Nevertheless, 17 out of 142 patients (12.0%) had impaired fasting glucose and 37 out of 140 patients (26.4%) had impaired glucose tolerance. Several biochemical parameters were correlated with both increased BMI and increased waist circumference: TAG (ρ = 0.211, p = 0.015 and ρ = 0.285, p = 0.002, respectively), HOMAIR (ρ = 0.357, p < 0.001 and ρ = 0.261, p = 0.011, respectively), fasting glucose (ρ = 0.232, p = 0.006 and ρ = 0.187, p = 0.034, respectively), glucose concentration after 120 min (ρ = 0.291, p = 0.001 and ρ = 0.295, p = 0.001, respectively) and fasting insulin (ρ = 0.326, p = 0.001 and ρ = 0.219, p = 0.033, respectively).
Table I
Characteristics of patients with polycystic ovary syndrome (N = 168)
Anthropometric and metabolic characteristics of healthy controls (N = 82) are presented in Table II. Controls were significantly younger compared to PCOS patients (p < 0.001), and had lower body weight, BMI and waist circumference (all p < 0.001). Among healthy controls, only 2 (2.4%) had dyslipidaemia and 29 (35.4%) had a higher burden of metabolic syndrome.
Table II
Characteristics of healthy controls (N = 82)
Genotype distribution of the investigated polymorphisms is presented in Supplementary Table SI. None of the investigated polymorphisms was associated with PCOS susceptibility in univariable analysis or after adjustment for age (Supplementary Table SII).
None of the investigated polymorphisms in either CCKAR or CCKBR was associated with anthropometric characteristics of patients with PCOS, as shown in Supplementary Tables SIII and SIV, respectively. CCKAR polymorphisms were also not associated with anthropometric characteristics of healthy controls (Supplementary Table SV). On the other hand, carriers of at least one polymorphic CCKBR rs1800843 allele among healthy controls had a larger waist circumference (p = 0.027) and tended to have more visceral fat (p = 0.046). Weight and BMI were also higher in these subjects, but the difference did not reach statistical significance (Supplementary Table SVI).
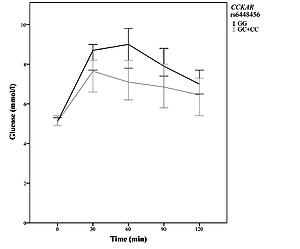
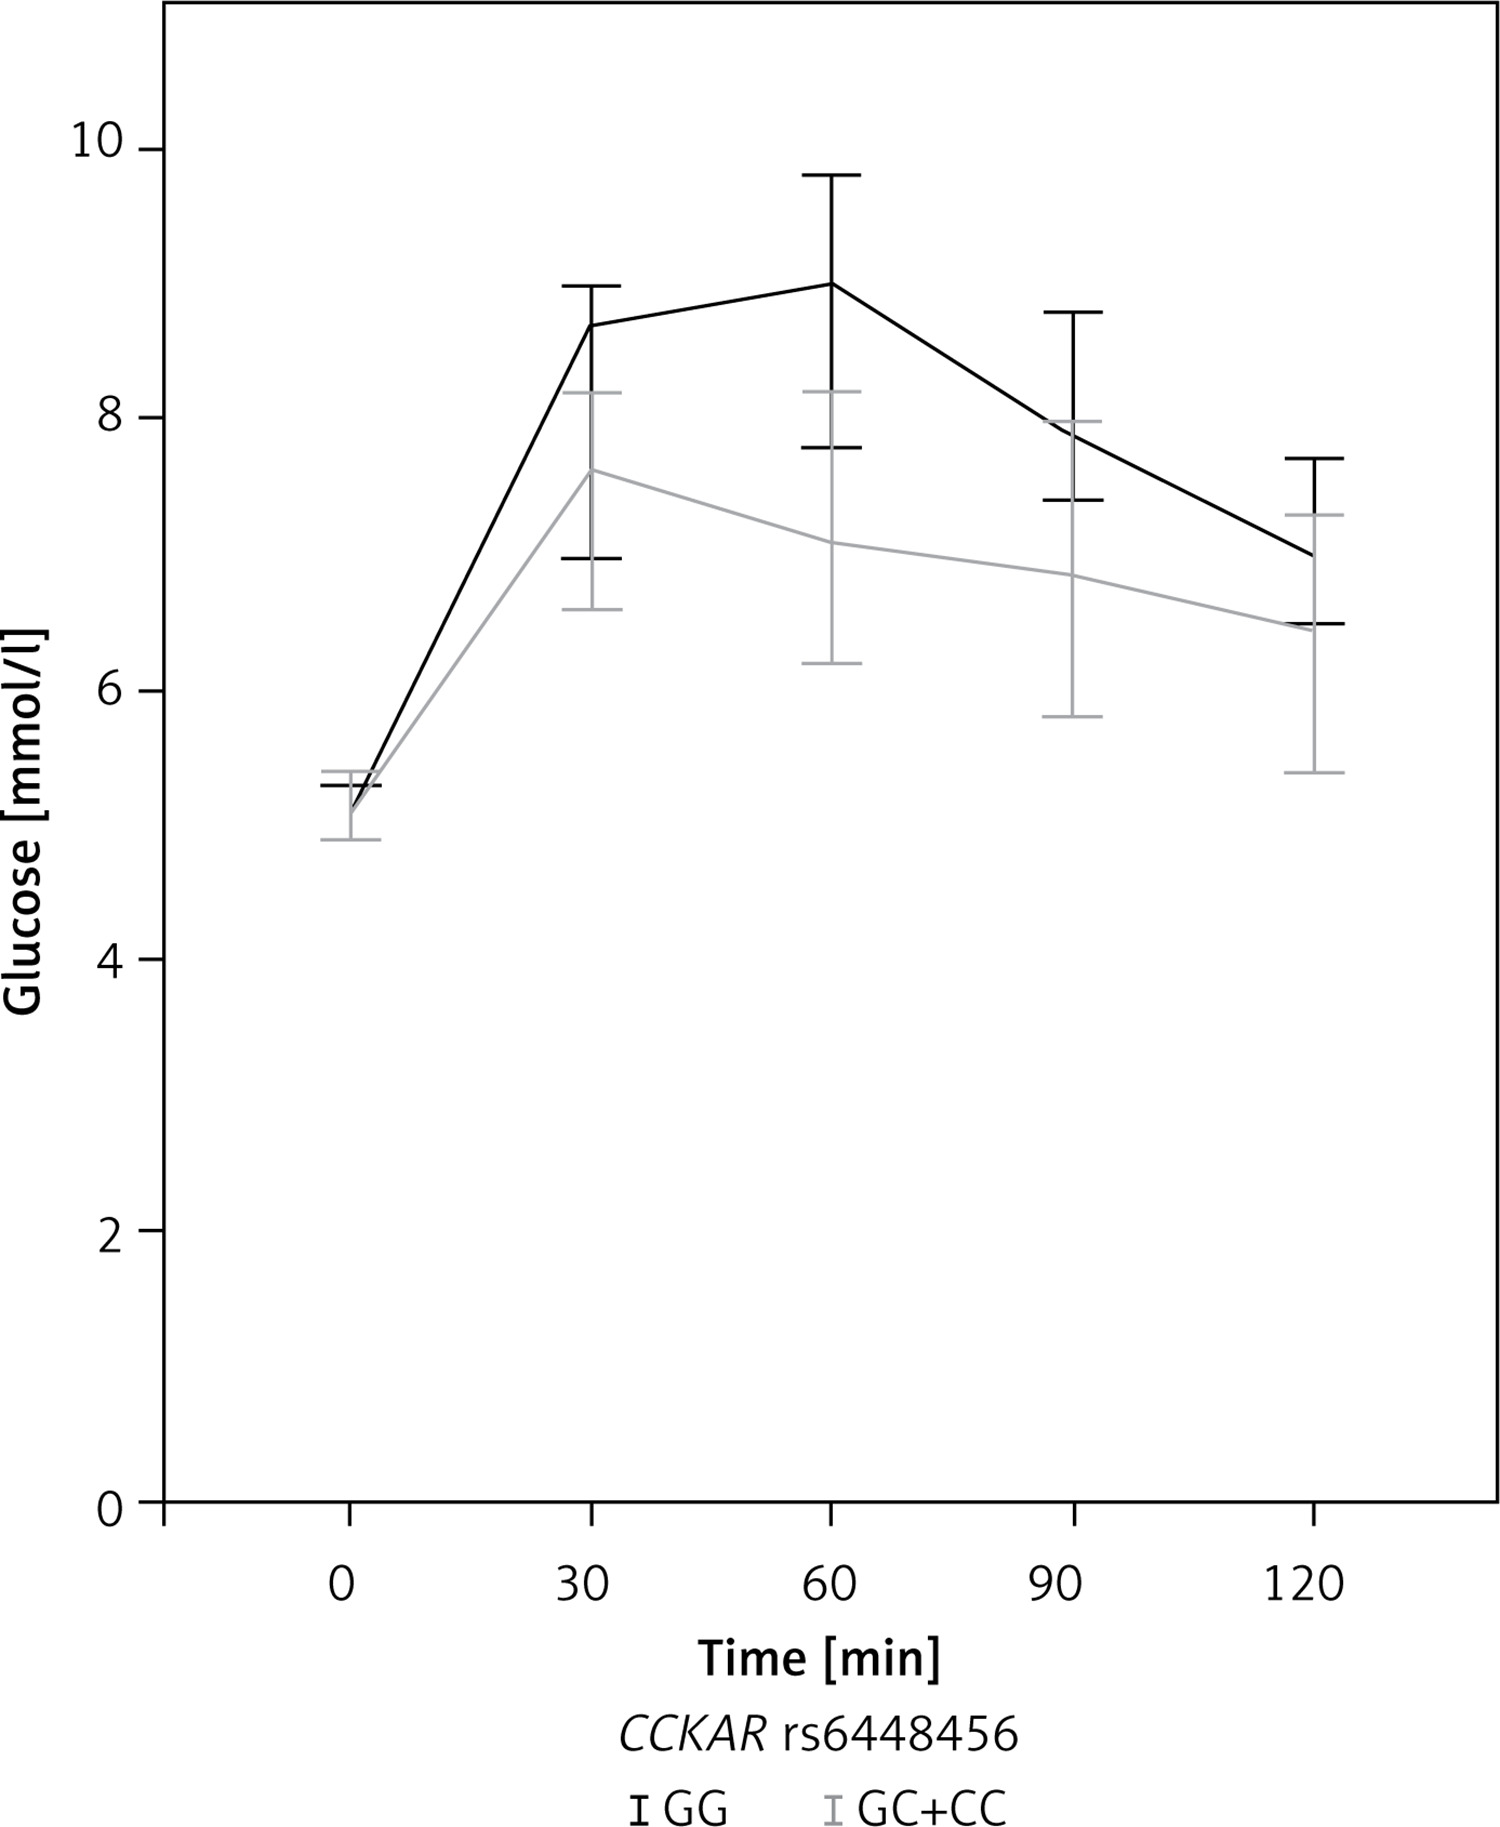
The impact of the two CCKAR polymorphisms on metabolic characteristics of patients with PCOS is shown in Table III. Carriers of at least one polymorphic CCKAR rs6448456 C allele had significantly higher levels of total cholesterol (p = 0.034) and LDL (p = 0.036) compared to the wild-type genotype. Although there was no significant difference in fasting glucose concentration (p = 0.253), carriers of at least one polymorphic CCKAR rs6448456 C allele had significantly lower blood glucose after 30 (p = 0.022), 60 (p = 0.001), and 90 (p = 0.010) min of OGTT (Figure 1). After 120 min of OGTT, carriers of at least one polymorphic CCKAR rs6448456 C allele still had a lower median blood glucose, but the difference was no longer statistically significant (p = 0.092). No other significant associations between CCKAR polymorphisms and metabolic characteristics of patients with PCOS were observed.
Table III
CCKAR polymorphisms and metabolic characteristics of patients with polycystic ovary syndrome (N = 168)
| Characteristic | Genotype* | CCKAR rs6448456 | CCKAR rs1800857 | ||
|---|---|---|---|---|---|
| Median (25–75%) | P-value | Median (25–75%) | P-value | ||
| Total cholesterol [mmol/l] [33] | X/X | 4.6 (4.2–5.1) | 0.034 | 4.7 (4.2–5.3) | 0.880 |
| X/x+x/x | 5.1 (4.4–5.6) | 4.8 (4.2–5.3) | |||
| HDL [mmol/l] [33] | X/X | 1.2 (1–1.4) | 0.749 | 1.2 (1.1–1.4) | 0.053 |
| X/x+x/x | 1.2 (1–1.4) | 1.2 (1–1.3) | |||
| LDL [mmol/l] [34] | X/X | 2.8 (2.3–3.4) | 0.036 | 2.9 (2.4–3.4) | 0.944 |
| X/x+x/x | 3.2 (2.5–3.6) | 2.9 (2.4–3.4) | |||
| TAG [mmol/l] [33] | X/X | 1.4 (1.1–2) | 0.373 | 1.3 (1–1.9) | 0.282 |
| X/x+x/x | 1.4 (1–1.7) | 1.6 (1.2–1.8) | |||
| HOMAIR [/] [70] | X/X | 2.7 (1.7–4.6) | 0.180 | 2.7 (1.7–5.1) | 0.503 |
| X/x+x/x | 3.1 (2.5–5.6) | 3.2 (2–4.9) | |||
| Glucose 0 min OGTT [mmol/l] [26] | X/X | 5.2 (4.8–5.7) | 0.253 | 5.1 (4.8–5.5) | 0.219 |
| X/x+x/x | 5.1 (4.9–5.4) | 5.2 (4.9–5.7) | |||
| Glucose 30 min OGTT [mmol/l] [79] | X/X | 8.7 (7.3–9.5) | 0.022 | 8 (6.8–9.3) | 0.236 |
| X/x+x/x | 7.7 (6.5–8.5) | 8.7 (7.1–10.3) | |||
| Glucose 60 min OGTT [mmol/l] [80] | X/X | 9.3 (7.4–10.7) | 0.001 | 7.8 (6.6–9.6) | 0.059 |
| X/x+x/x | 7.1 (5.9–8.7) | 9 (7.3–11.2) | |||
| Glucose 90 min OGTT [mmol/l] [82] | X/X | 7.9 (6.3–9.5) | 0.010 | 7.4 (5.9–8.8) | 0.204 |
| X/x+x/x | 6.7 (5.6–8.1) | 7.9 (6.4–9.6) | |||
| Glucose 120 min OGTT [mmol/l] [28] | X/X | 6.9 (5.6–8.2) | 0.092 | 6.6 (5.4–7.8) | 0.488 |
| X/x+x/x | 6.3 (5.4–7.4) | 6.5 (5.8–8) | |||
| Insulin 0 min OGTT [mU/l] [70] | X/X | 11.5 (7.4–19.7) | 0.141 | 12.4 (7.1–20.2) | 0.839 |
| X/x+x/x | 15.1 (11–21.8) | 13 (8.8–19.5) | |||
| Insulin 30 min OGTT [mU/l] [84] | X/X | 70.3 (43.2–106.3) | 0.468 | 77.4 (50.6–110.8) | 0.324 |
| X/x+x/x | 78.5 (52.3–102.7) | 65.7 (40.9–102.9) | |||
| Insulin 60 min OGTT [mU/l] [84] | X/X | 98 (63.5–136.3) | 0.681 | 86.4 (63.2–120.5) | 0.302 |
| X/x+x/x | 89.5 (63.9–127.3) | 100.7 (67.3–146) | |||
| Insulin 90 min OGTT [mU/l] [84] | X/X | 82.3 (60.5–145) | 0.873 | 88.2 (58.3–125) | 0.730 |
| X/x+x/x | 93.6 (67.7–118) | 87.9 (69.6–119.5) | |||
| Insulin 120 min OGTT [mU/l] [76] | X/X | 79.3 (53.3–127) | 0.730 | 78 (51.8–125) | 0.981 |
| X/x+x/x | 74.9 (52.3–118.3) | 79.5 (56.1–121.5) | |||
* X – major (common) allele, x – minor (variant) allele. HDL – high-density lipoproteins, LDL – low-density lipoproteins, TAG – triacylglycerols, HOMAIR – homeostatic model assessment for insulin resistance, OGTT – oral glucose tolerance test, [] – number of missing data. Statistically significant p-values are shown in bold.
Figure 1
Graph of blood glucose as a function of time (median with 95% confidence interval) in 83 PCOS patients with complete oral glucose tolerance test data. The grey curve indicates carriers of at least one polymorphic CCKAR rs6448456 allele. The black curve indicates carriers of two normal Alleles
The impact of CCKBR polymorphisms on metabolic characteristics of patients with PCOS is shown in Table IV. Carriers of at least one polymorphic CCKBR rs2929180 T allele had a higher insulin concentration after 90 (p = 0.004) minutes of OGTT. However, CCKBR rs2929180 T genotype was not associated with insulin concentration after 60 (p = 0.152) or 120 (p = 0.634) min of OGTT. No other significant associations between CCKBR polymorphisms and metabolic characteristics of patients with PCOS were detected.
Table IV
CCKBR polymorphisms and metabolic characteristics of patients with polycystic ovary syndrome (N = 168)
| Characteristic | Genotype* | CCKBR rs2929180 | CCKBR rs1800843 | CCKBR rs1042048 | |||
|---|---|---|---|---|---|---|---|
| Median (25–75%) | P-value | Median (25–75%) | P-value | Median (25–75%) | P-value | ||
| Total cholesterol [mmol/l] [33] | X/X | 4.8 (4.3–5.4) | 0.226 | 4.7 (4.2–5.5) | 0.805 | 4.7 (4.2–5.4) | 0.679 |
| X/x+x/x | 4.6 (4.1–5.3) | 4.7 (4.2–5.2) | 4.7 (4.2–5.3) | ||||
| HDL [mmol/l] [33] | X/X | 1.2 (1–1.4) | 0.358 | 1.2 (1.1–1.4) | 0.998 | 1.2 (1–1.3) | 0.332 |
| X/x+x/x | 1.2 (1–1.3) | 1.2 (1–1.4) | 1.2 (1–1.4) | ||||
| LDL [mmol/l] [34] | X/X | 2.9 (2.4–3.4) | 0.471 | 2.9 (2.4–3.5) | 0.962 | 2.9 (2.4–3.5) | 0.484 |
| X/x+x/x | 2.8 (2.3–3.6) | 2.8 (2.4–3.4) | 2.8 (2.3–3.4) | ||||
| TAG [mmol/l] [33] | X/X | 1.5 (1.1–2) | 0.083 | 1.5 (1.1–1.8) | 0.331 | 1.4 (1.2–1.8) | 0.979 |
| X/x+x/x | 1.2 (0.9–1.7) | 1.4 (0.9–1.9) | 1.5 (1–2) | ||||
| HOMAIR [/] [70] | X/X | 3.1 (1.9–5.1) | 0.171 | 2.8 (1.8–4.6) | 0.838 | 3.2 (2.3–5.1) | 0.290 |
| X/x+x/x | 2.4 (1.5–4.6) | 2.9 (1.7–5.6) | 2.7 (1.7–4.9) | ||||
| Glucose 0 min OGTT [mmol/l] [26] | X/X | 5.1 (4.8–5.6) | 0.980 | 5.2 (4.8–5.5) | 0.784 | 5.2 (4.8–5.6) | 0.917 |
| X/x+x/x | 5.2 (4.9–5.6) | 5.2 (4.9–5.6) | 5.2 (4.9–5.6) | ||||
| Glucose 30 min OGTT [mmol/l] [79] | X/X | 8.1 (6.9–9.4) | 0.542 | 8.2 (6.8–9.4) | 0.513 | 8.3 (6.8–10) | 0.990 |
| X/x+x/x | 8.7 (7–9.4) | 8.4 (7.3–9.4) | 8.1 (7.1–9.3) | ||||
| Glucose 60 min OGTT [mmol/l] [80] | X/X | 8.1 (6.6–9.8) | 0.199 | 8.3 (6.6–9.8) | 0.909 | 8.6 (6.2–11.1) | 0.571 |
| X/x+x/x | 9.2 (7.3–10.7) | 8.7 (7.1–9.8) | 7.8 (7–9.5) | ||||
| Glucose 90 min OGTT [mmol/l] [82] | X/X | 7.1 (5.8–8.8) | 0.106 | 7.4 (5.8–9.1) | 0.704 | 7.7 (5.7–9.6) | 0.826 |
| X/x+x/x | 8.1 (6.8–9.5) | 7.9 (6.4–8.9) | 7.6 (6.5–8.7) | ||||
| Glucose 120 min OGTT [mmol/l] [28] | X/X | 6.6 (5.6–7.9) | 0.661 | 6.6 (5.4–7.8) | 0.695 | 6.3 (5.4–7.9) | 0.594 |
| X/x+x/x | 6.4 (5.3–7.8) | 6.6 (5.6–7.9) | 6.8 (5.6–7.8) | ||||
| Insulin 0 min OGTT [mU/l] [70] | X/X | 13 (8.3–20.2) | 0.185 | 12.4 (7.6–19.1) | 0.655 | 13.3 (9.6–21.1) | 0.321 |
| X/x+x/x | 10.4 (6.3–19.8) | 13.5 (7.3–23) | 11.8 (6.8–19.7) | ||||
| Insulin 30 min OGTT [mU/l] [84] | X/X | 71.2 (45.9–99.4) | 0.831 | 69.3 (42.7–98.3) | 0.067 | 72.2 (44.8–106.3) | 0.834 |
| X/x+x/x | 80.5 (38.7–115.5) | 87.7 (53–124.5) | 71.4 (44.4–105.5) | ||||
| Insulin 60 min OGTT [mU/l] [84] | X/X | 87.7 (62–115.5) | 0.152 | 90.7 (68.4–129) | 0.670 | 99.2 (66.8–133.8) | 0.397 |
| X/x+x/x | 117.5 (64.7–145.5) | 97.9 (58.1–145) | 88.2 (52.3–131) | ||||
| Insulin 90 min OGTT [mU/l] [84] | X/X | 80.1 (58.3–113.5) | 0.004 | 82.5 (60.6–117.5) | 0.145 | 92.3 (70.6–123) | 0.461 |
| X/x+x/x | 118 (83.4–168.8) | 104 (66.4–183.5) | 81.8 (57.8–124) | ||||
| Insulin 120 min OGTT [mU/l] [76] | X/X | 79.5 (51.4–119.5) | 0.634 | 74.9 (51.7–107) | 0.121 | 86.7 (65.3–128) | 0.096 |
| X/x+x/x | 77.8 (57.8–142) | 88.7 (61.5–148) | 66.9 (46–118) | ||||
* X – major (common) allele, x – minor (variant) allele. HDL – high-density lipoproteins, LDL – low-density lipoproteins, TAG – triacylglycerols, HOMAIR – homeostatic model assessment for insulin resistance, OGTT – oral glucose tolerance test, [] – number of missing data. Statistically significant p-values are shown in bold.
Among healthy controls, only the association with metabolic syndrome burden could be assessed (Table V). Carriers of at least one polymorphic CCKAR rs1800857 C allele were less likely to have a high metabolic syndrome burden (p = 0.029). No other significant associations between CCKAR or CCKBR polymorphisms and metabolic characteristics of healthy controls were observed.
Table V
Association of selected CCKAR and CCKBR polymorphisms with metabolic syndrome burden in healthy controls (N = 82)
Discussion
We report for the first time on the impact of genetic variability in CCKAR and CCKBR on metabolic parameters in patients with PCOS. The main finding of our study was that the carriers of at least one polymorphic CCKAR rs6448456 C allele had a significantly higher total cholesterol and LDL and significantly lower blood glucose levels after 30, 60, and 90 min of OGTT.
First, we assessed whether the investigated CCKAR and CCKBR polymorphisms influence lipid profile in our group of patients with PCOS. A meta-analysis in 2011 showed that patients with PCOS have low HDL, increased triglycerides, increased LDL and increased non-HDL. Furthermore, these lipid parameters were found to be worse in women with PCOS than in healthy women regardless of BMI or ethnicity [15]. The guidelines from 2018 recommend that overweight and obese patients with PCOS, regardless of age, should have a fasting lipid profile at diagnosis and, thereafter, repeated measurements based on the presence of hyperlipidaemia and global cardiovascular disease risk [16]. In our study, carriers of at least one polymorphic CCKAR rs6448456 C allele had significantly higher total blood cholesterol and LDL than non-carriers. We have not found functional studies to explain our observations directly. The observed effect might be caused by an increased contraction of the gallbladder [4]. Our results could be in line with preclinical models, where intravenous administration of CCK in mice resulted in an increase in blood cholesterol and TAG due to increased bile secretion mediated by CCK via CCK receptors and subsequent reabsorption of the biliary lipids [17]. On the other hand, studies examining the effect of Cckar gene deletion on cholesterol metabolism in animal models report conflicting data [17–19]. Another possible explanation for higher total blood cholesterol and LDL in carriers of at least one polymorphic CCKAR rs6448456 C allele may be the effect of CCK on secretion of pancreatic lipase [4]. It was observed that inhibition of lipase led to decreased digestion of lipids, resulting in lower total cholesterol and LDL levels [20]. Although we cannot unequivocally explain the mechanisms leading to higher total blood cholesterol and LDL levels in carriers of at least one polymorphic CCKAR rs6448456 C allele, our findings may be of clinical importance. Since CCK levels increase with aging [21], the risk for hypercholesterolemia in these patients is expected to increase over time and appropriate medical surveillance may be needed to prevent the related late complications.
Next, we assessed whether the investigated CCKAR and CCKBR polymorphisms influence glucose tolerance in our group of patients with PCOS. We observed that carriers of at least one polymorphic CCKAR rs6448456 C allele had significantly lower blood glucose after 30, 60, and 90 min of OGTT. Since blood glucose is regulated by two processes, there are two possible explanations. The first explanation may be that delayed gastric emptying causes slower passage of glucose into the duodenum, leading to slower absorption and lower postprandial glucose. Our observation is in agreement with data reported in a study of eight healthy men who underwent OGTT, showing delayed gastric emptying, a lower glucose peak and a lower insulin peak when they were administered CCK as compared to when administered saline. It is less likely that the observed effect might be due to faster glucose uptake into tissues in carriers of at least one polymorphic CCKAR rs6448456 C allele [22]. Namely, CCK secretion is mainly stimulated by proteins and fats, whereas glucose causes a significant but smaller rise of plasma CCK [23]. Moreover, a study on five healthy men showed that physiological concentrations of CCK potentiate amino acid-induced insulin secretion but not glucose-induced insulin secretion [24].
All investigated CCKAR and CCKBR polymorphisms are also common in the general population (MAF between 9.5% and 38.2% according to the dbSNP Allele Frequency Aggregator (ALFA) project). In our study, none of the investigated polymorphisms was associated with PCOS susceptibility. However, in young healthy women, CCKBR rs1800843 was associated with anthropometric characteristics and CCKAR rs1800857 with metabolic syndrome burden. Therefore, further studies are needed to assess the association of these polymorphisms with metabolic parameters also in other, non-PCOS patients.
One of the limitations of our study was that the genotype distributions were not in HWE for two out of six polymorphisms, namely CCKBR rs2929180 and CCKBR rs1042047. We decided to include the CCKBR rs2929180 polymorphism in further analysis because the distribution of genotype frequencies was not significantly different from the distribution reported for the European population, and there were no other polymorphisms in the respective gene region that could affect PCR amplification. However, we did not include the CCKBR rs1042047 polymorphism. Although the distribution of CCKBR rs1042047 genotype frequencies was not significantly different from the distribution in the dbSNP database, we found a common rs8192471 polymorphism only three nucleotides away from rs1042047 at the 5′ end that could affect annealing and genotyping results. A similar conclusion was reported by other researchers [25].
Another limitation was that all the clinical data were not available for all patients, although they were managed in the same department at the UMC Ljubljana. Additionally, for healthy controls, not all anthropometric or metabolic parameters were measured. The association with dyslipidaemia could not be evaluated among healthy controls, as only two subjects had altered lipid levels. Therefore, only the association with metabolic syndrome burden was evaluated. As all the patients and controls were young adults, the risk that our data could be affected by treatments of other conditions was minimized. Furthermore, our study was not biased by genetic heterogeneity, as all subjects included in the study belonged to the Slovenian population, which is ethnically and genetically homogeneous [26].
In conclusion, our data indicate interesting associations between the CCKAR rs6448456 polymorphism and the metabolic characteristics of patients with PCOS. Better understanding of the role of genetic variability in CCKAR and CCKBR may be of clinical importance for future development of treatment strategies with CCK receptor agonists, which have already been shown to enhance the weight-lowering, appetite-suppressing, and positive β-cell actions of GLP-1-based drugs in preclinical models [27–29]. It needs to be pointed out that the investigated receptor polymorphisms could also play an important role in response to treatment with potential CCK receptor agonists as previously observed for other receptor polymorphisms, for example in liraglutide treatment in obese women with PCOS [30] as well as in other therapeutic fields [31].