Introduction
Pancreaticobiliary maljunction (PBM) is a rare congenital anomaly in which the junction of the pancreatic and biliary ducts is located outside the duodenal wall, with a long common channel [1–3]. The resulting two-way reflux of bile and pancreatic juice leads to several complications, including bile retention with cholangitis, pancreatitis, and malignancies [4–6].
Cyst excision and Roux-en-Y hepaticojejunostomy are the first choice for PBM treatment [7–9]. However, these procedures are associated with postoperative complications affecting the residual bile ducts, such as cholangitis, hepatolithiasis, and carcinogenesis [8, 10–13]. Identification of biomarkers associated with PBM complications of the bile duct could enable the early detection of these complications and support the development of effective diagnostic and therapeutic methods.
Long noncoding RNAs (lncRNAs), which are non-coding RNAs longer than 200 nucleotides, play an important role in regulating the occurrence and progression of many diseases, such as infectious and malignant tumors [14–16]. They exert these effects by modulating biological processes such as cellular proliferation, motility, and immune response to diseases [17–19]. In addition, some lncRNAs have been identified as biomarkers for diagnosis and prognosis of diseases [20–22]. However, the genome-wide expression and functional roles of lncRNAs in PBM are unclear.
To the best of our knowledge, this is the first study focused on lncRNAs in the common bile duct of PBM. Here, we investigated the expression profile of lncRNAs in the common bile duct of patients with PBM, and we identified lncRNAs differentially expressed relative to controls. We explored the potential functions of the differentially expressed lncRNAs and assessed their ability to serve as biomarkers.
Material and methods
Material
The study protocol was approved by the Ethics Committee of our hospital and complied with the Helsinki Declaration. Written informed consent was obtained from the guardian of each subject before surgery. A total of 15 pediatric subjects with PBM and 15 control subjects were included in the study between January 2017 and September 2020. In all patients, diagnosis was confirmed by imaging and surgical pathological examination. PBM was diagnosed based on the following criteria: (1) the union of the pancreatic and biliary duct was located outside the sphincter of Oddi, based on magnetic resonance cholangiopancreatography (MRCP) or intraoperative cholangiography (IOC); (2) the common duct was longer than 5 mm; (3) the biliary amylase level was greater than 1000 U/l [23].
RNA microarray analysis
Microarray experiments to investigate lncRNAs and messenger RNA (mRNAs) differentially expressed between the PBM and control groups were performed by Western SCI Biotech Company (Chongqing, China, www.westernsci.cn). Agilent Human lncRNA Microarray 2018 Version (4*180k, Design ID: 085630), Agilent Technologies, Inc., was used.
The common bile duct tissue from PBM subjects was collected and stored at –80°C before RNA extraction. Total RNA was isolated using TRIZOL (Invitrogen, Carlsbad, CA, USA) according to the manufacturer’s protocol and quantified using the NanoDrop ND-2000 (Thermo Scientific). RNA integrity was assessed using the Agilent Bioanalyzer 2100. Sample labeling, microarray hybridization, and washing were performed based on the manufacturer’s standard protocols. Briefly, total RNA was transcribed to double-stranded cDNA, then synthesized into cRNA and labeled with cyanine-3-CTP. The labeled cRNAs were then hybridized onto the microarray. After washing, the arrays were scanned using the Agilent Scanner G2505C (Agilent Technologies).
Array images were analyzed using Feature Extraction software (version 10.7.1.1, Agilent Technologies), and the raw data were further processed using Genespring (version 13.1, Agilent Technologies). First, the raw data were normalized using the quantile algorithm. The probes that had flags in “P” in at least 1 out of 2 conditions were chosen for further analysis. Differentially expressed mRNAs and lncRNAs were defined as those whose expression differed by ≥ 2.0-fold between PBM and control groups (p < 0.05). The potential roles of these differentially expressed mRNAs and lncRNAs were explored based on Gene Ontology (GO) and Kyoto Encyclopedia of Genes and Genomes (KEGG) pathways (see section 2.3). Finally, the differentially expressed genes were organized using hierarchical clustering.
Prediction of lncRNA function
Following the approach in a previous study [24], we examined differentially expressed mRNAs for enrichment of KEGG functional pathways, then we attributed the same functional pathways to lncRNAs that were co-expressed with those mRNAs. Co-expression of mRNAs and lncRNAs was defined as a Pearson correlation p-value < 0.05.
The enrichment of functional terms was analyzed using a hypergeometric cumulative distribution function, and the 200 and 500 most reliable predicted relationships were displayed in order to understand the distribution of functions of differentially expressed lncRNAs.
Fine mapping of co-expression of lncRNAs and adjacent coding genes
For each differentially expressed lncRNA, associated “cis-regulated mRNAs” were identified based on the following criteria: (1) the loci encoding the mRNAs were within 300 kb up- or downstream of the given lncRNA; and (2) the Pearson correlation coefficient for lncRNA-mRNA co-expression was significant (p ≤ 0.05). The co-expressed genes and enrichment significance for differentially expressed genes in each transcription factor (TF) entry were calculated for each differentially expressed lncRNA, using the hypergeometric distribution test. The calculated results return a p-value of enrichment significance, where a small p-value indicates that the gene is enriched.
The intersection between the coding gene set co-expressed by lncRNAs and the target gene set of the TF/chromatin regulatory complex was calculated, and the enrichment degree of the intersection was calculated using a hypergeometric distribution test. This calculation identified the TFs significantly related to differentially expressed lncRNAs, and thereby the TFs and chromatin regulatory factors that may regulate those lncRNAs. The network diagram was visualized based on the results of the hypergeometric distribution analysis.
According to hypergeometric distribution calculations, multiple lncRNA-TF pairs were obtained for each differentially expressed lncRNA. Each lncRNA-TF pair was the result of multiple gene enrichment.
Quantitative reverse transcription-polymerase chain reaction (qRT-PCR) assay
In order to verify the microarray results, we randomly selected six differentially expressed lncRNAs that were associated with carcinogenesis or chronic inflammation in the common bile duct. We measured the lncRNA expression levels of these genes using qRT-PCR and the SYBR Green PCR Kit (Applied BI) according to the manufacturer’s instructions. Expression levels were calculated using the 2–ΔΔCt method and normalized to those of β-actin lncRNA.
Statistical analysis
SPSS 20.0 software (IBM, Armonk, NY, USA) was used for statistical analysis. Data were expressed as mean ± standard deviation (SD), and inter-group differences were assessed for significance using the rank sum test. The diagnostic accuracy of certain differentially expressed lncRNAs was assessed in terms of the area under the receiver operating characteristic curve (AUC). Statistical significance was defined as p < 0.05.
Results
General information
Patients’ demographic and clinical data are summarized in Table I. There was no significant difference between the two groups in body weight, age, or sex distribution.
Differential gene expression between PBM and control subjects
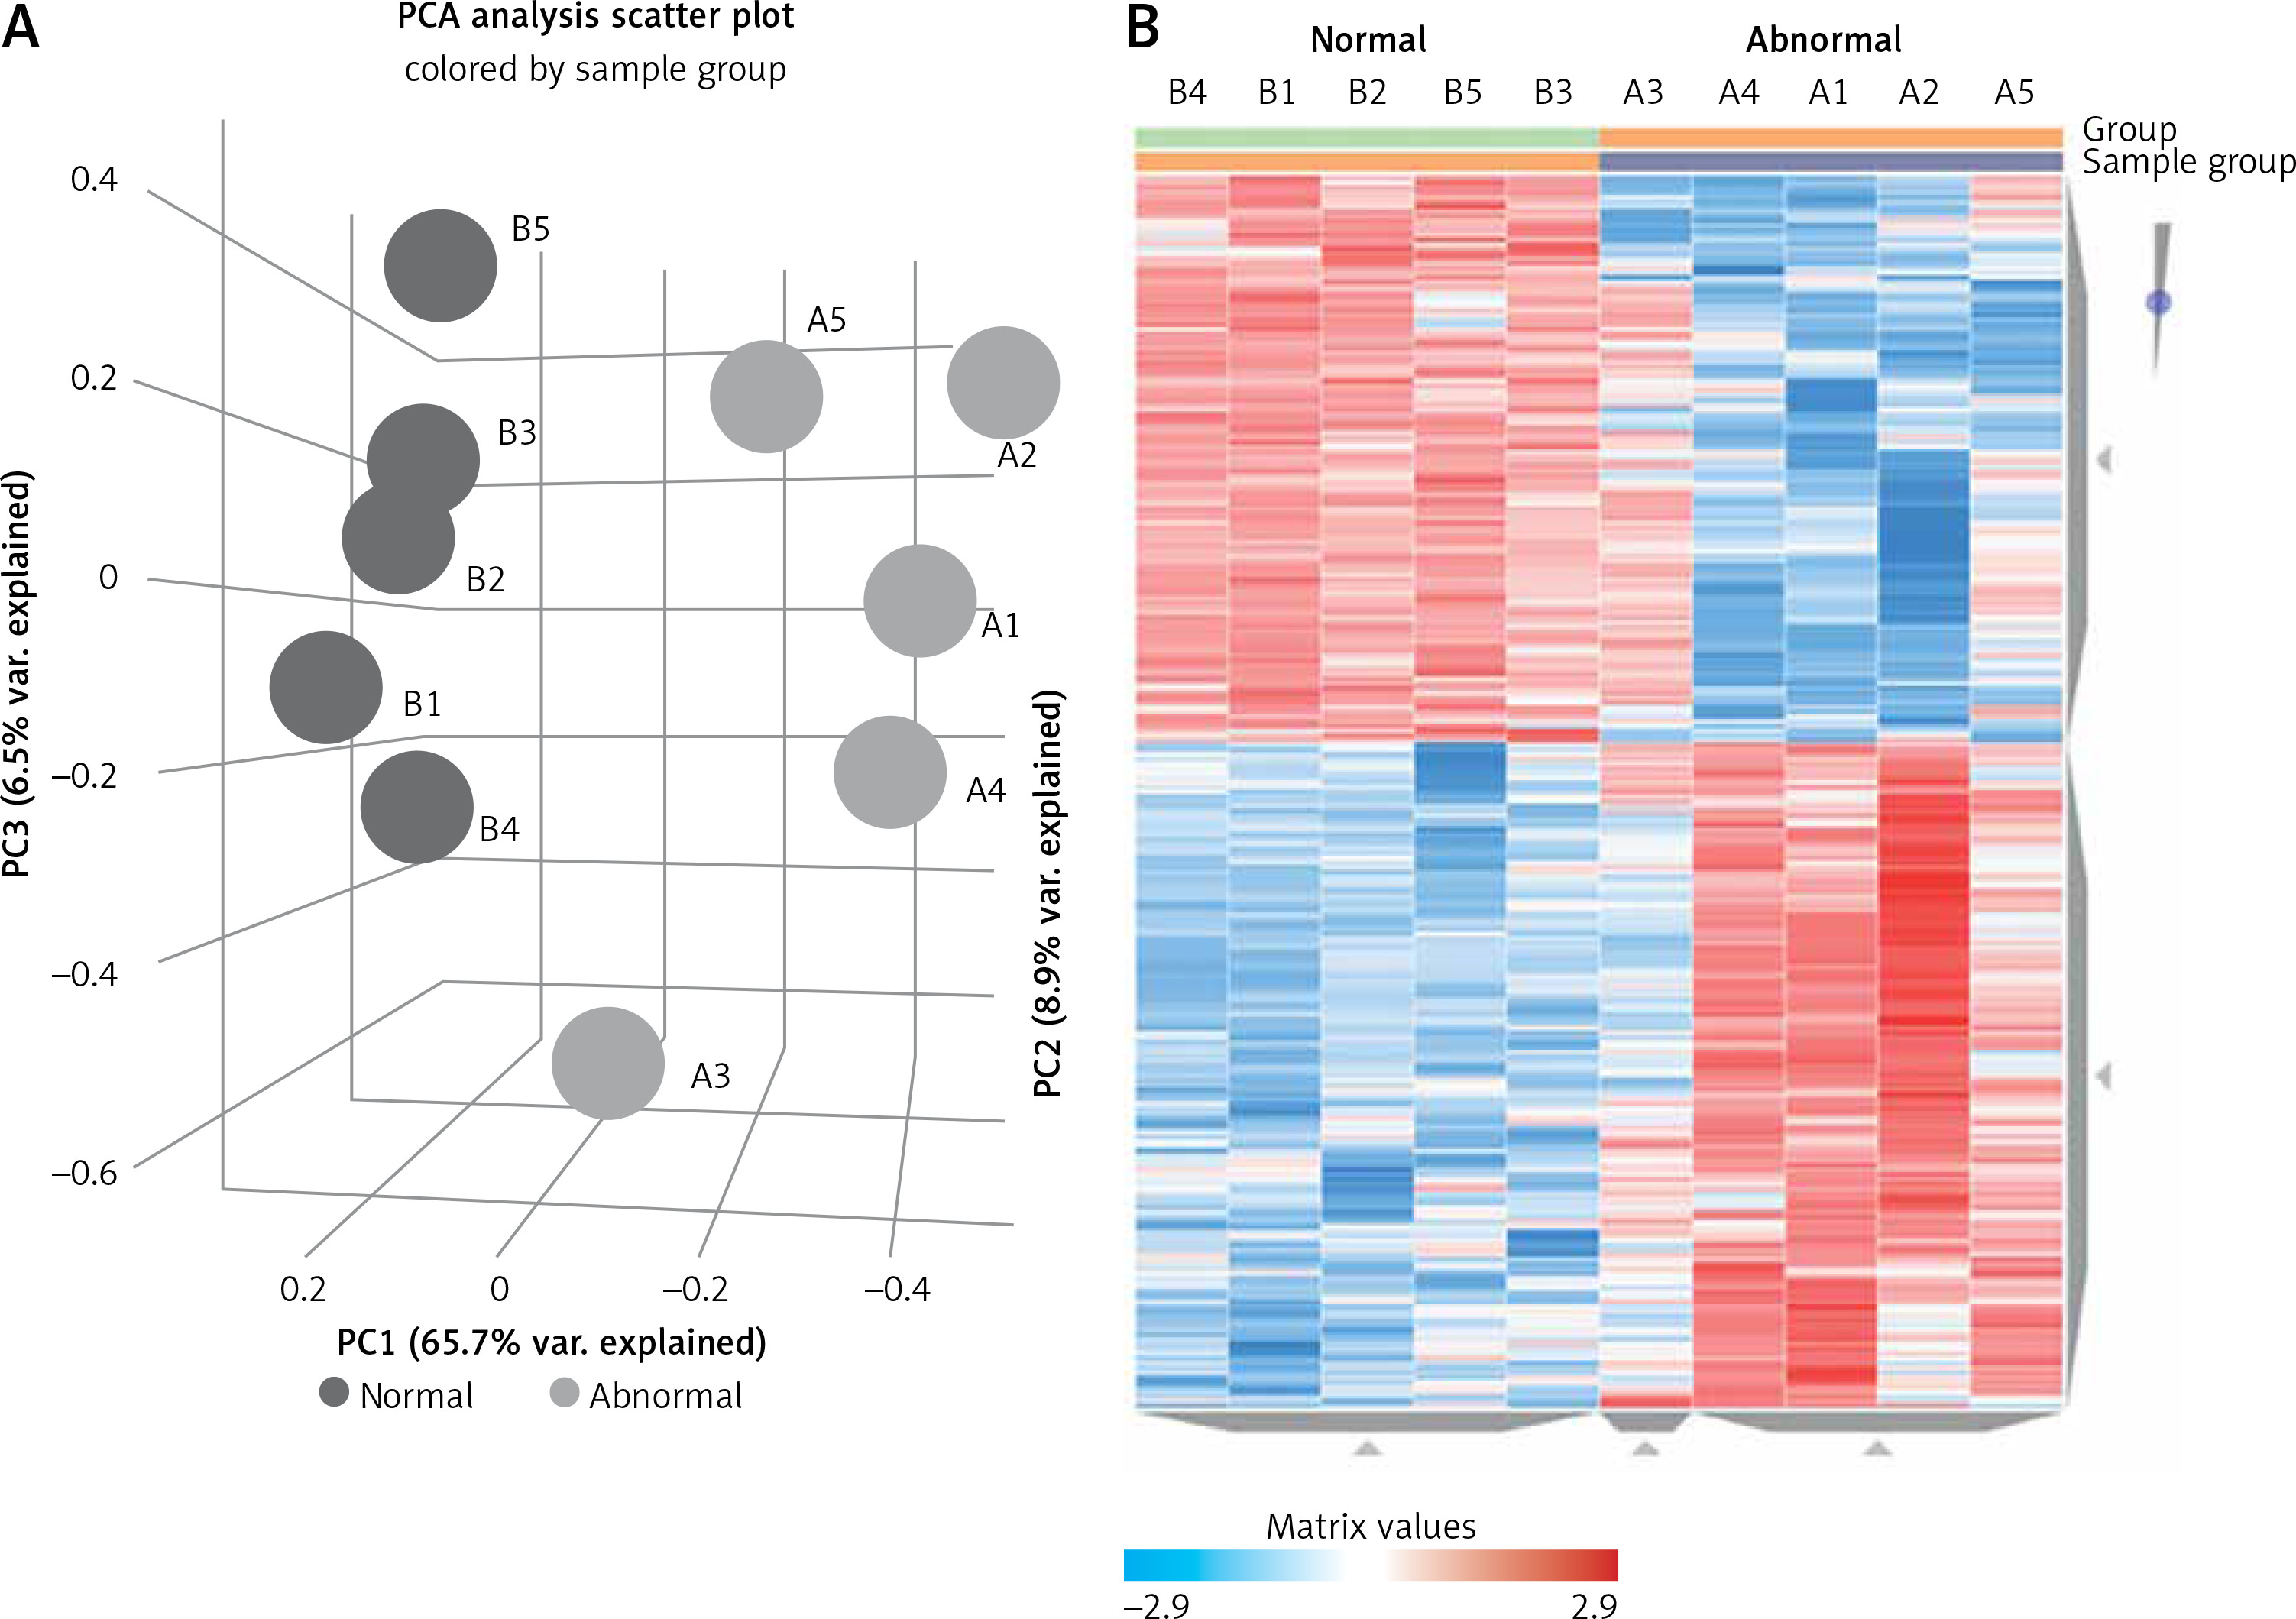
The microarray analysis identified 2915 upregulated mRNAs, 2121 downregulated mRNAs, 173 upregulated lncRNAs, and 316 downregulated lncRNAs in subjects with PBM compared to healthy controls. Principal component analysis of differentially expressed lncRNAs and a heatmap are presented in Figure 1, while the 20 most up- or downregulated lncRNAs are presented in Table II. The most highly upregulated lncRNA was LOC105378608, which showed a 14.39-fold difference from controls.
Table II
The top 20 differentially expressed lncRNAs in pancreaticobiliary maljunction (PBM) (up and down regulated)
Functional analysis of differentially expressed genes
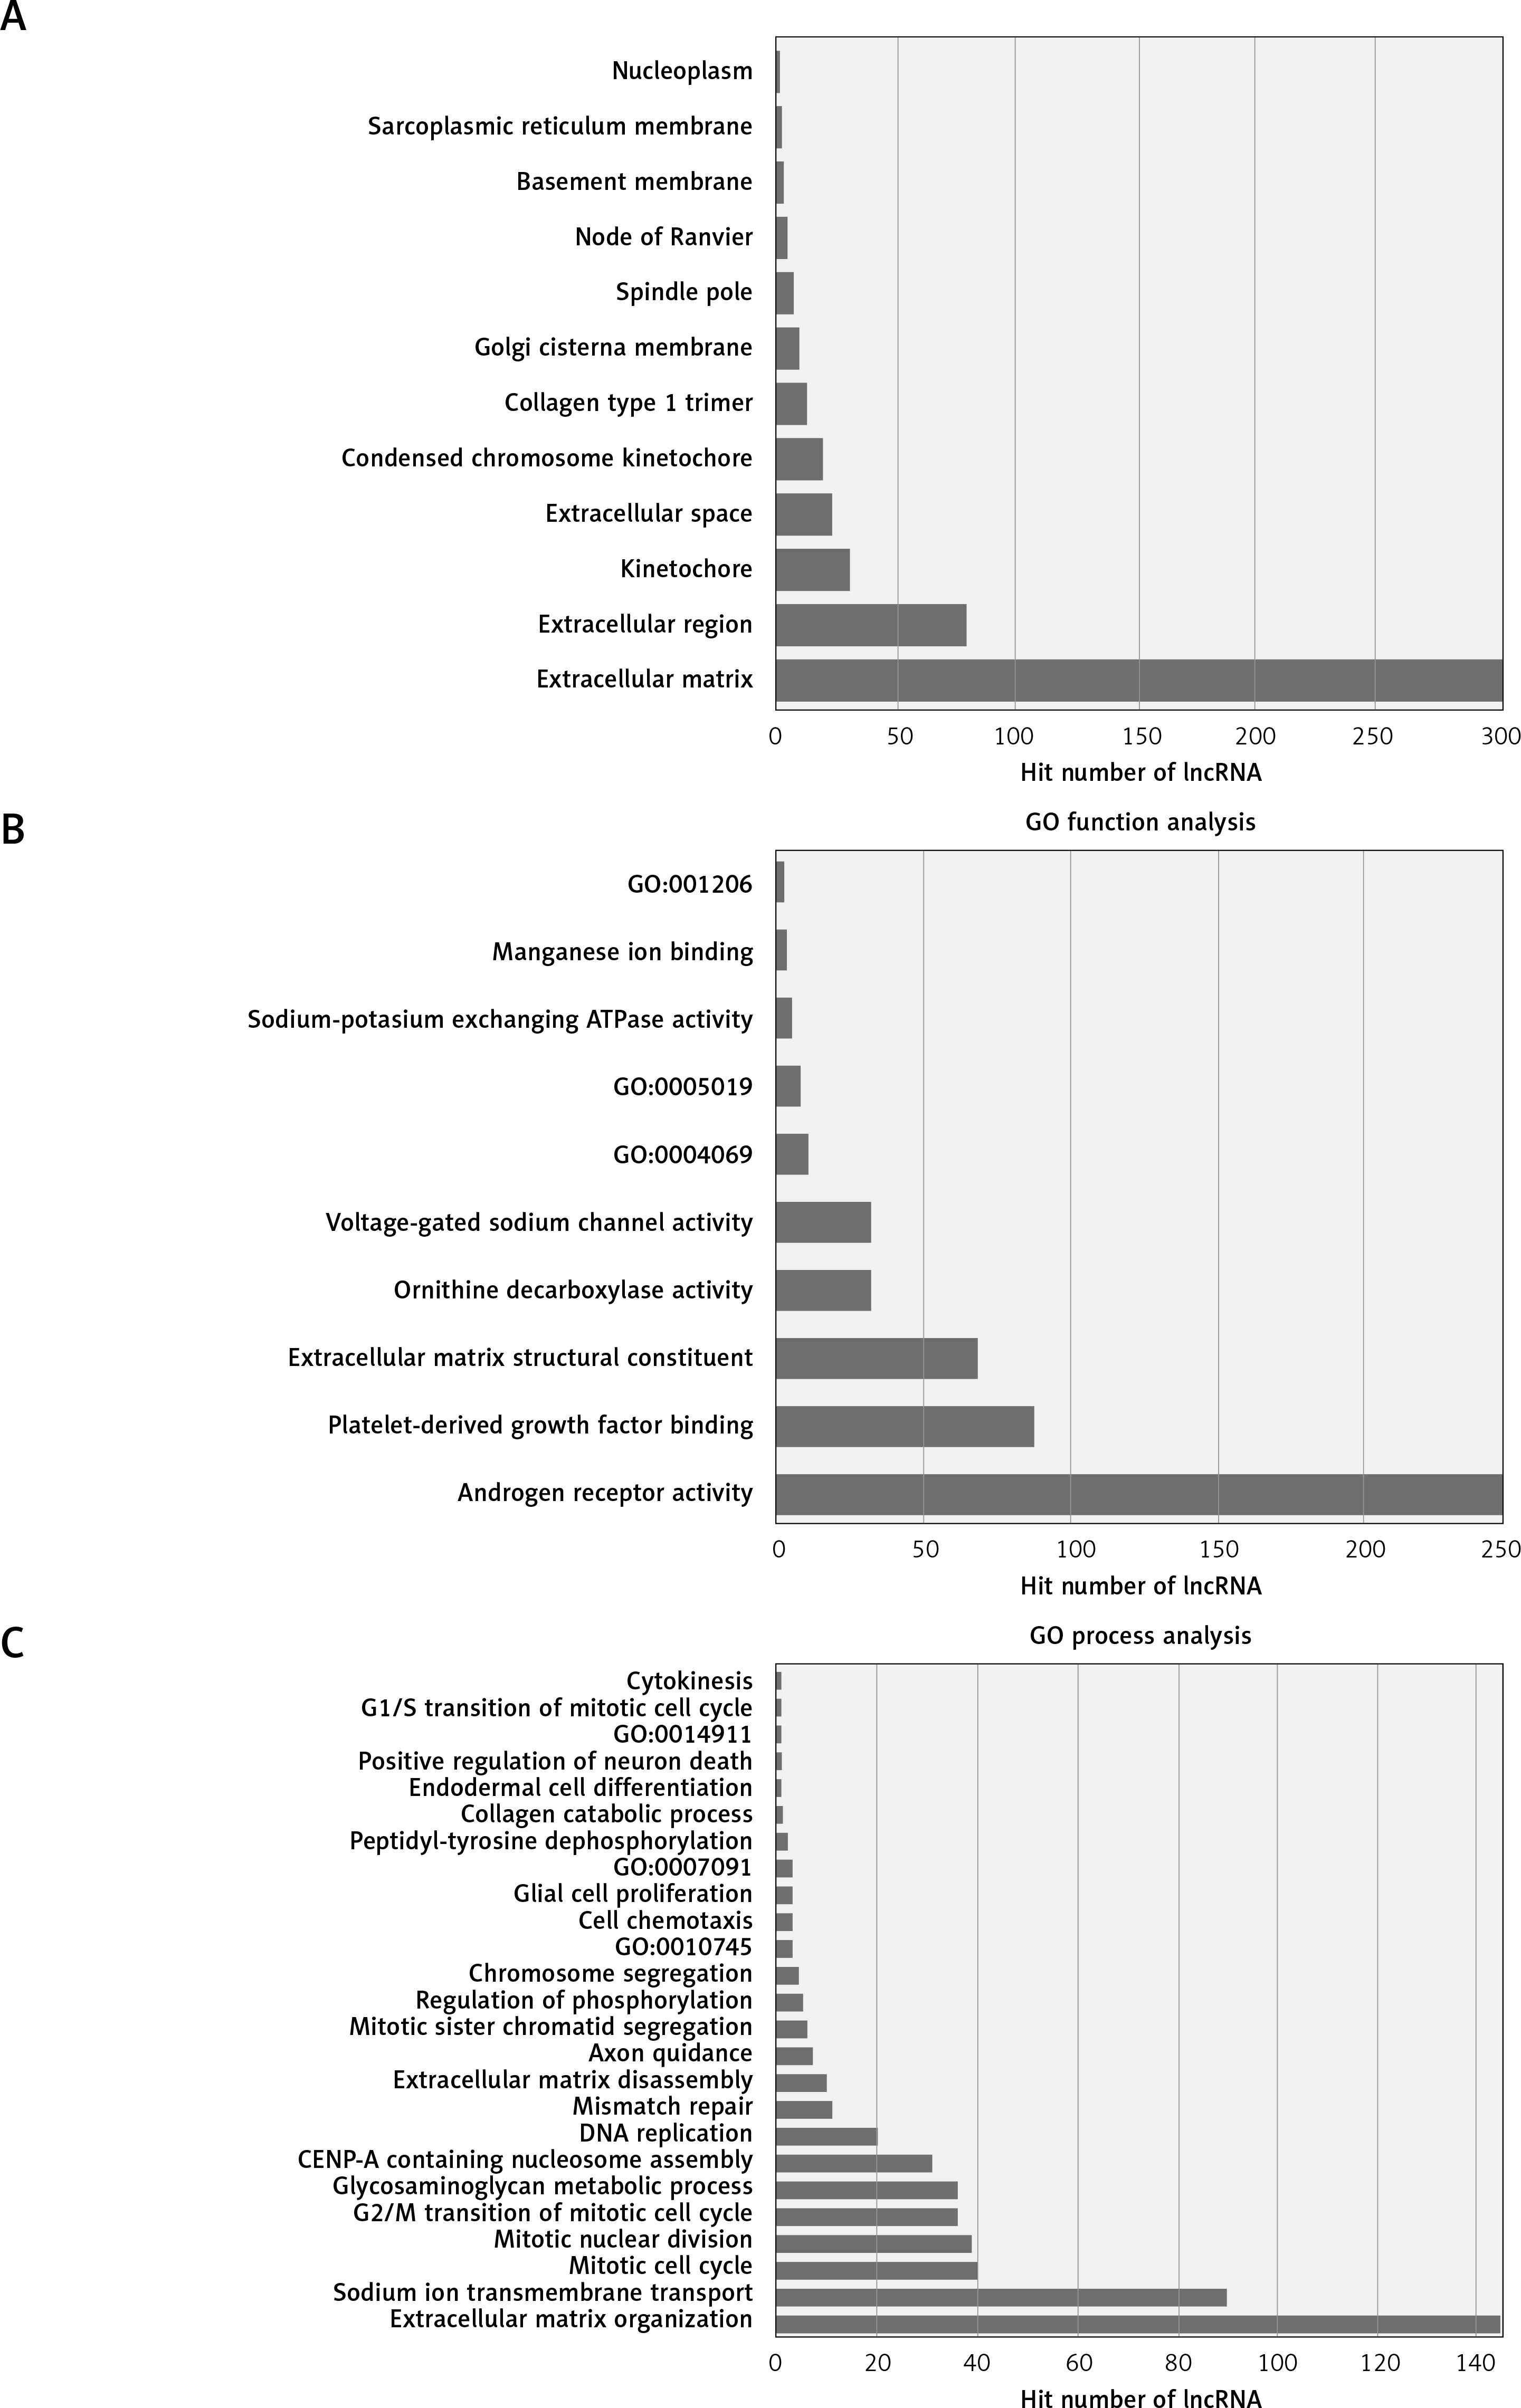
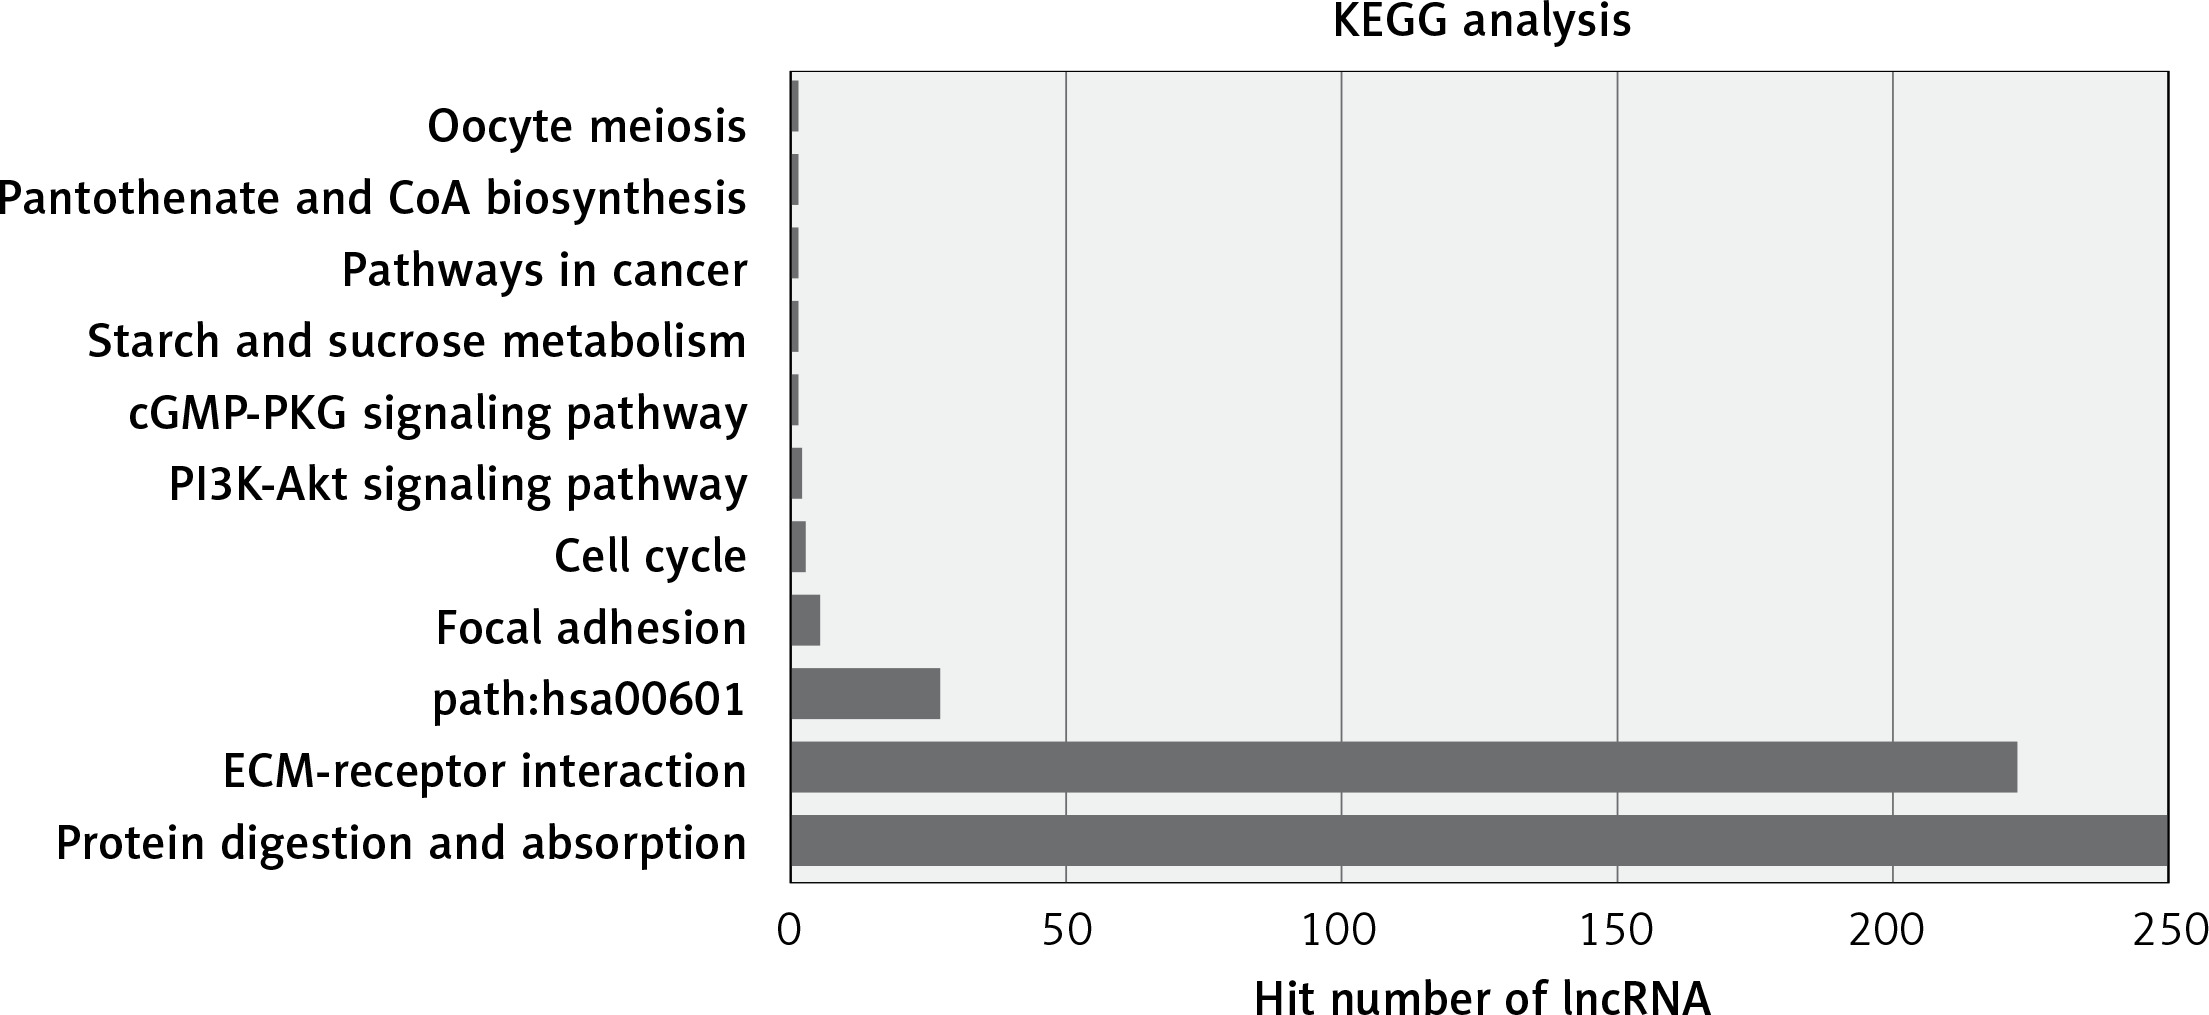
The most enriched GO categories associated with the differentially expressed transcripts were extracellular matrix (p = 2.9E-12, up-regulated), extracellular region (p = 0.000427, up-regulated), and kinetochore (p = 2.29E-8, up-regulated) (Figure 2). The most enriched KEGG pathway was protein digestion and absorption, in which 250 differentially expressed genes were involved. Some pathways were associated with cancer, such as pathways in cancer (associated with 11 genes) and the PI3K-Akt signaling pathway (associated with 15 genes, Figure 3).
Co-expression analysis and target prediction
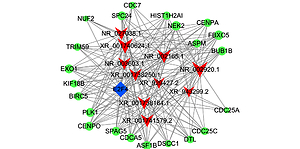
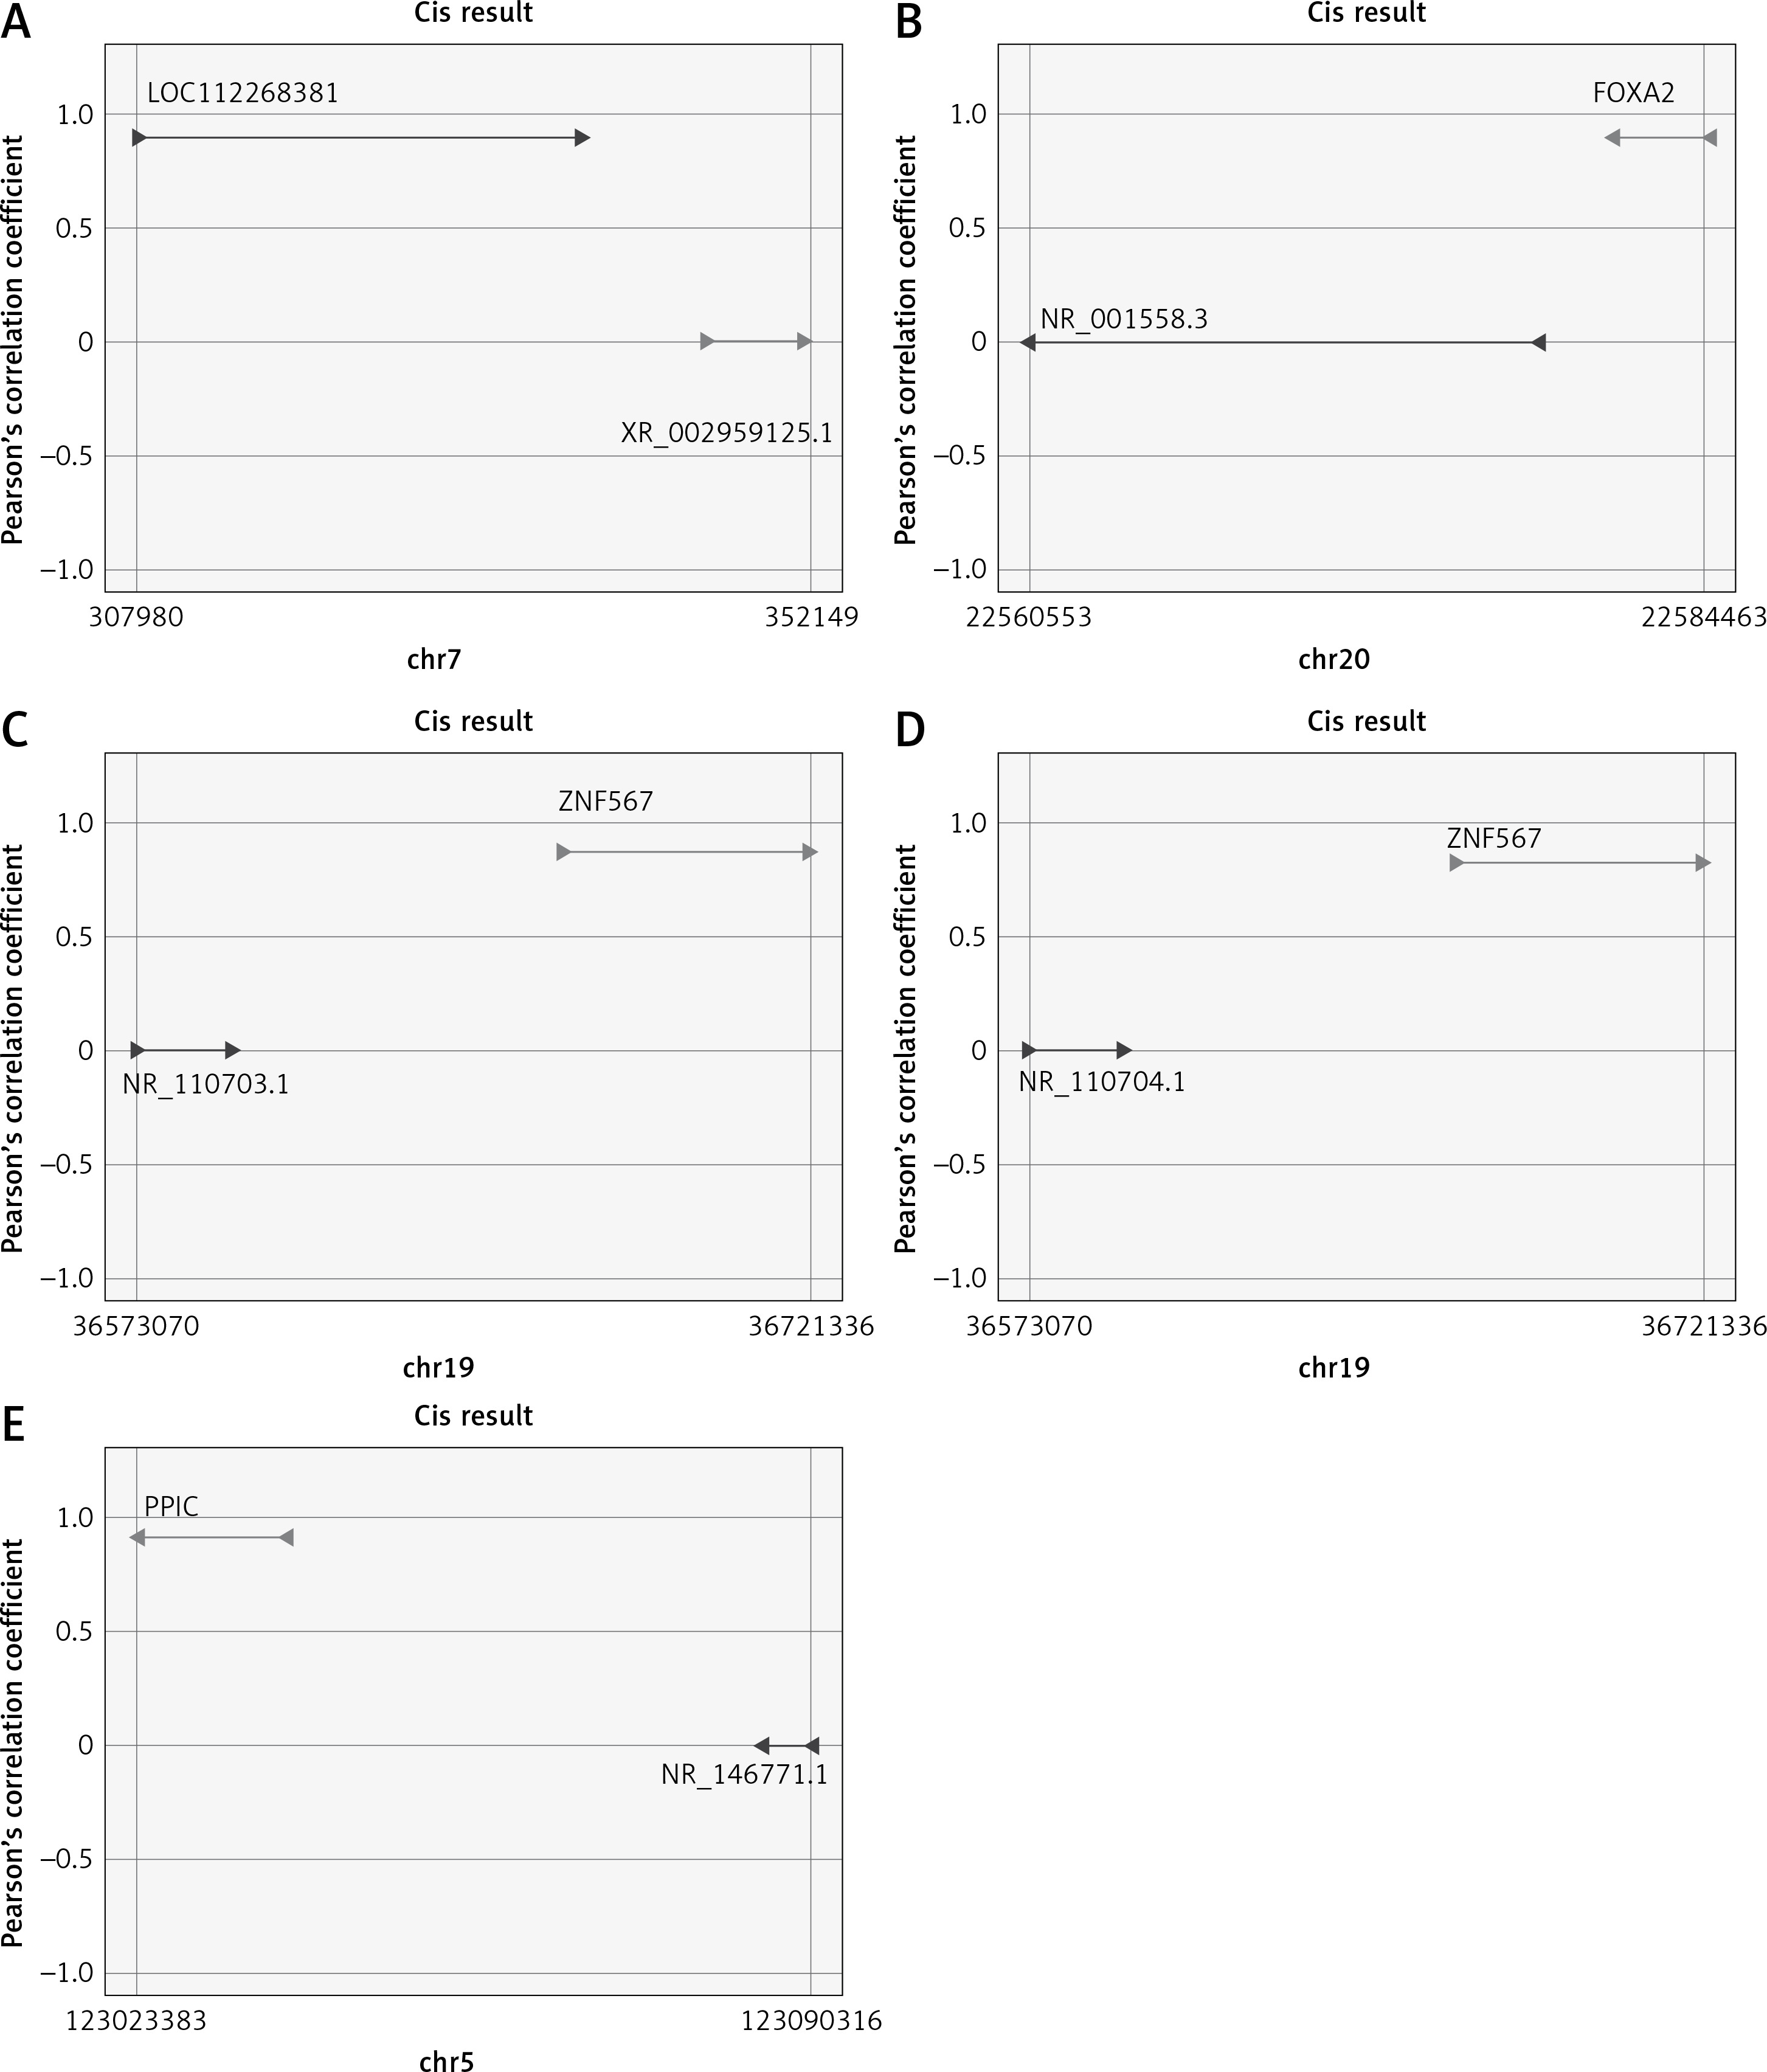
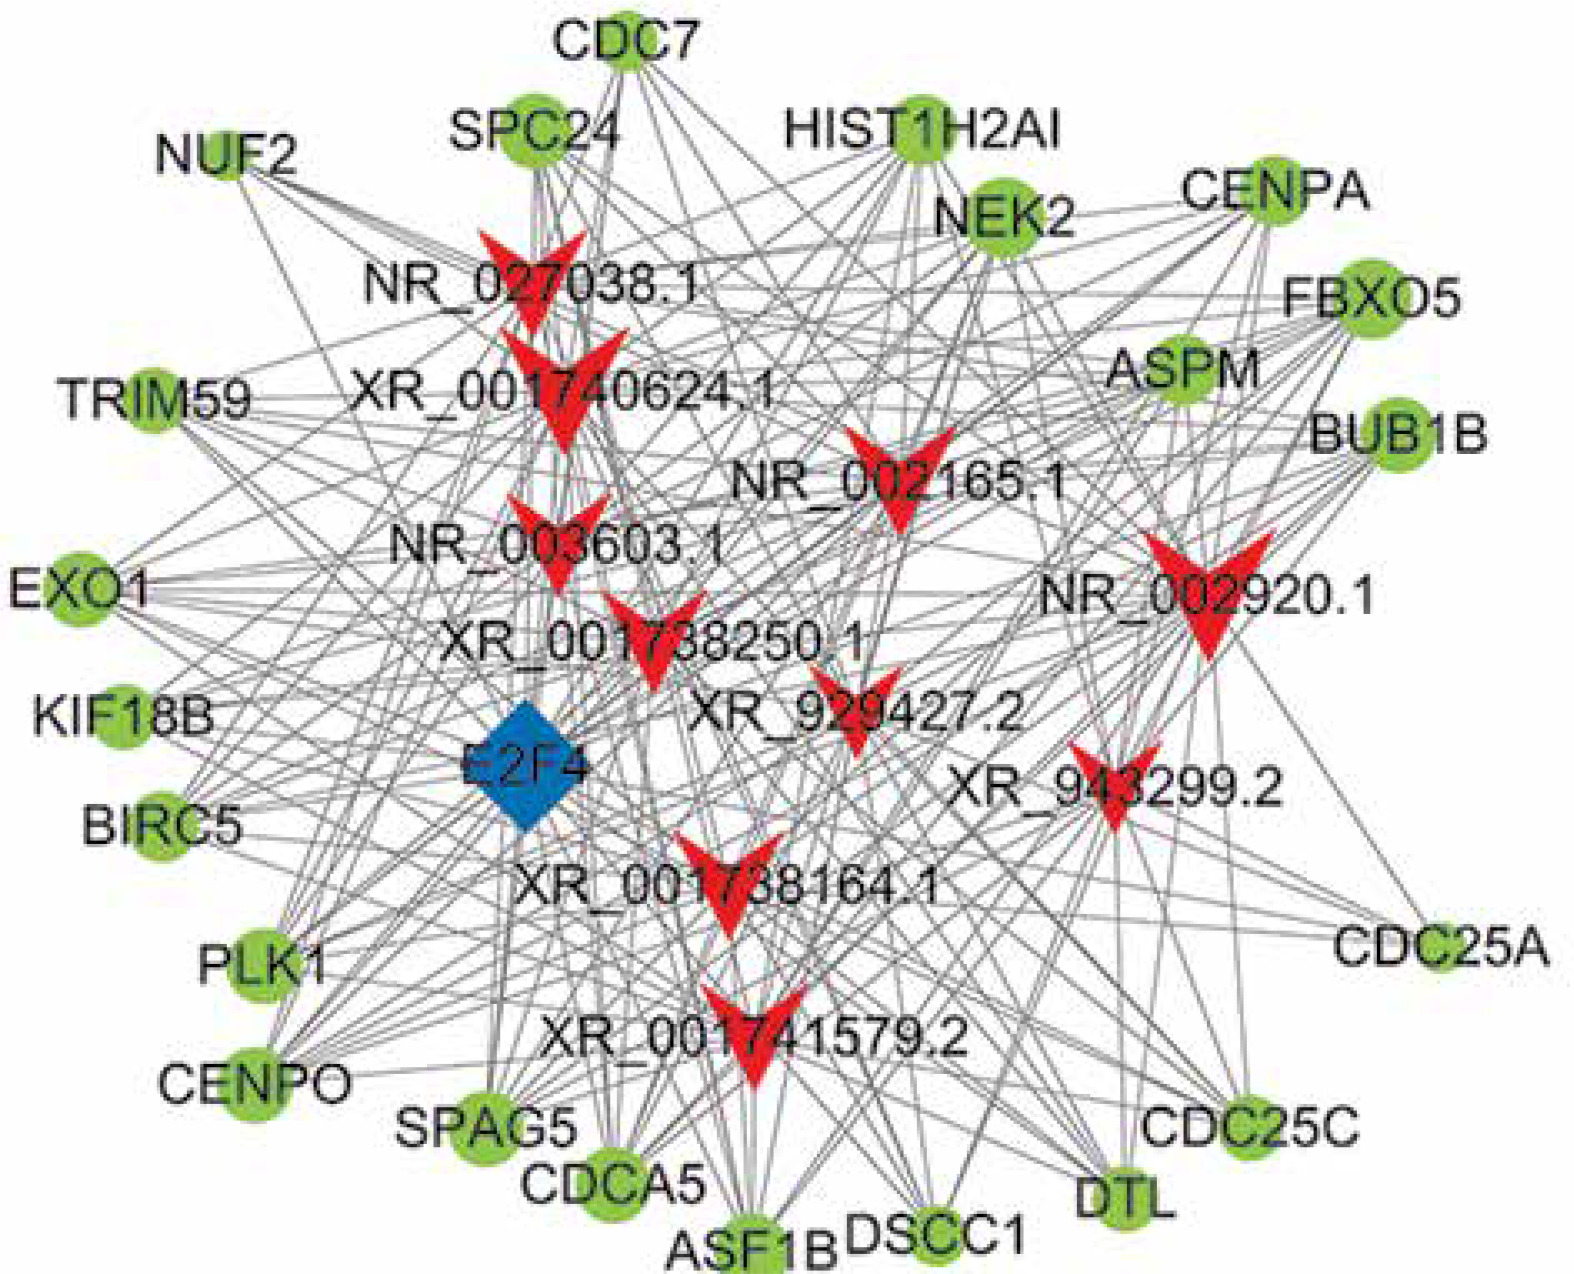
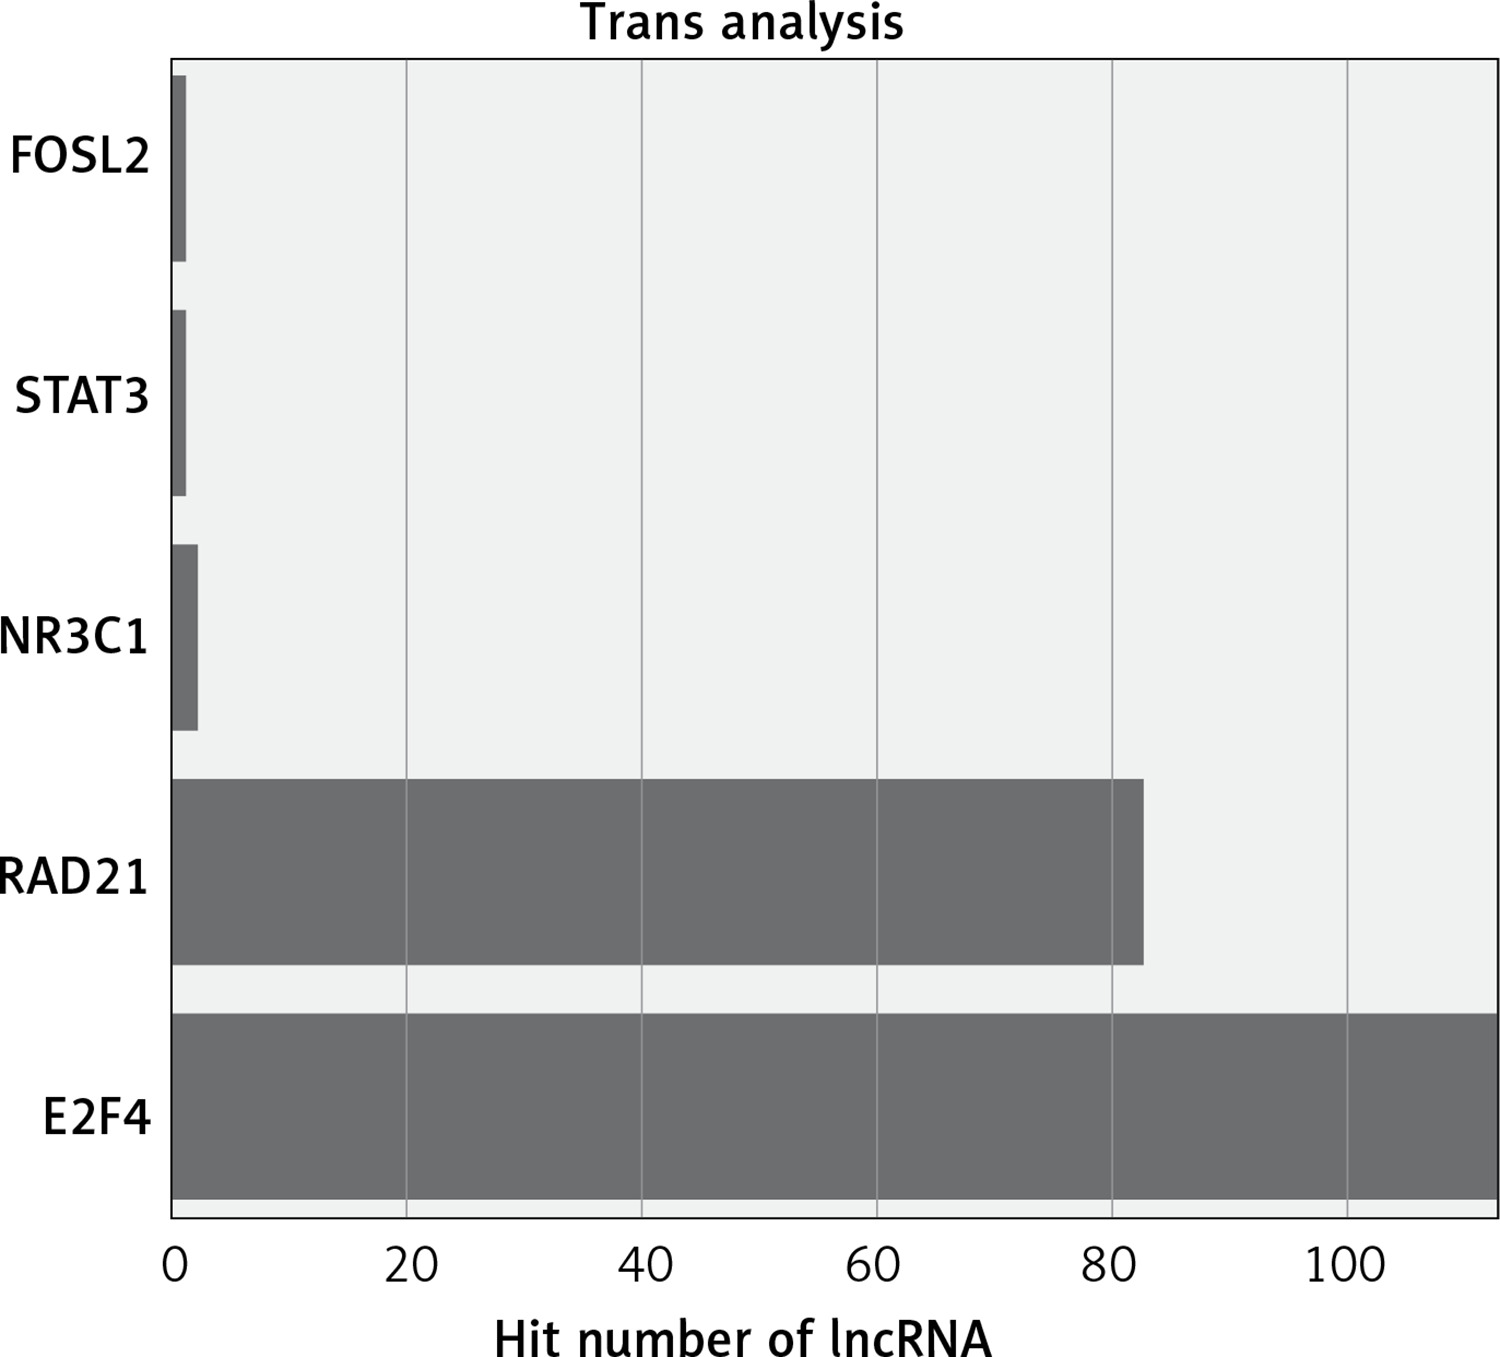
The functions of lncRNAs are performed by interacting with their targets. We predicted both cis- and trans-acting mRNAs that may interact with differentially expressed lncRNAs. The cis analysis searched for mRNAs 300 kb up- or downstream of the lncRNAs, and it identified 5 lncRNAs related to those cis target genes (Figure 4). The trans analysis of lncRNAs was performed by constructing co-expression networks of dysregulated mRNAs and lncRNAs based on Pearson expression correlation (Figure 5). Most of the differentially expressed lncRNAs acted in a trans manner. The top 200 predicted relationships with the highest prediction reliability were used to determine which TFs occurred most frequently, and the functions of these TFs were then attributed to the differentially expressed lncRNAs (Figure 6). Among the 964 differentially expressed lncRNAs and the predicted 9358 mRNA targets, more than one mRNAs were predicted to be regulated by one lncRNA and one mRNA corresponded to several lncRNAs.
Validation by qRT-PCR
Six up-regulated lncRNAs associated with carcinogenesis or chronic inflammation in the common bile duct were verified by qRT-PCR: NR_110876, NR_132344, XR_946886, XR_002956345, NR_135295, and XR_002957935. The expression differences between patients and controls for NR_110876, NR_132344, XR_946886, and XR_002956345 were consistent with the microarray results, and the difference was statistically significant for NR_132344, XR_946886, and XR_002956345. However, the qRT-PCR results for NR_135295 and XR_002957935 were inconsistent with the microarray results (Figure 7).
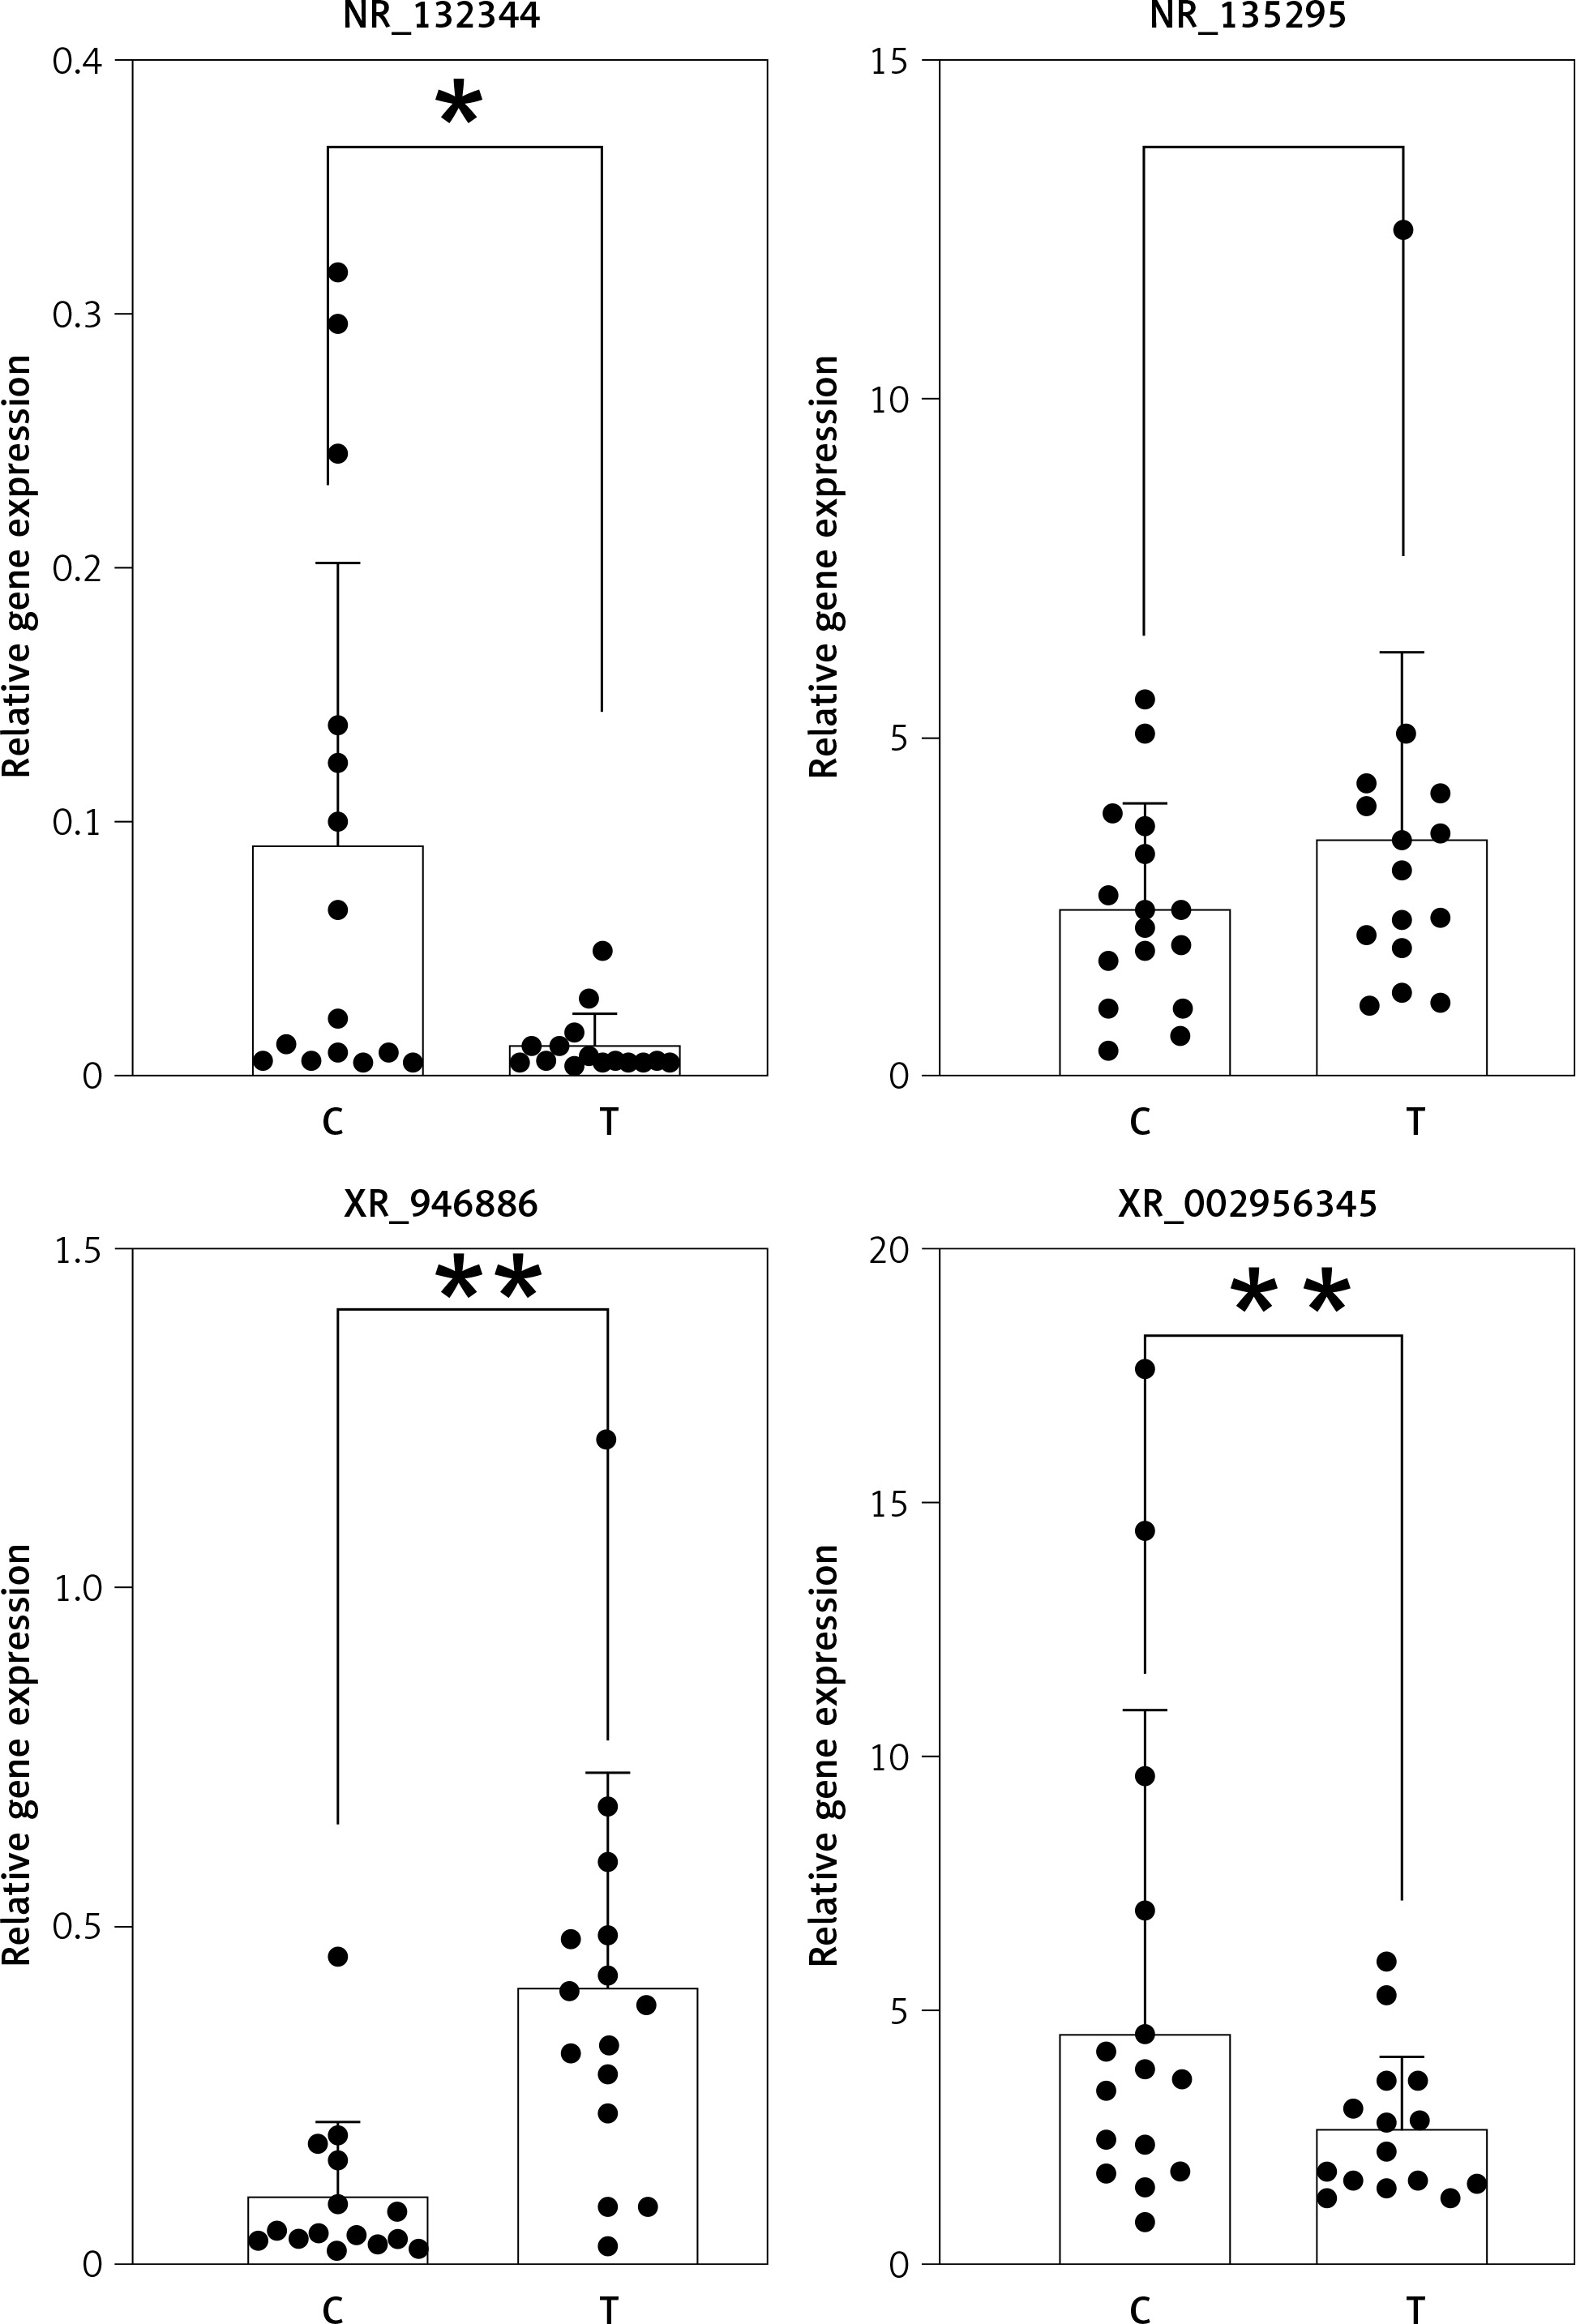
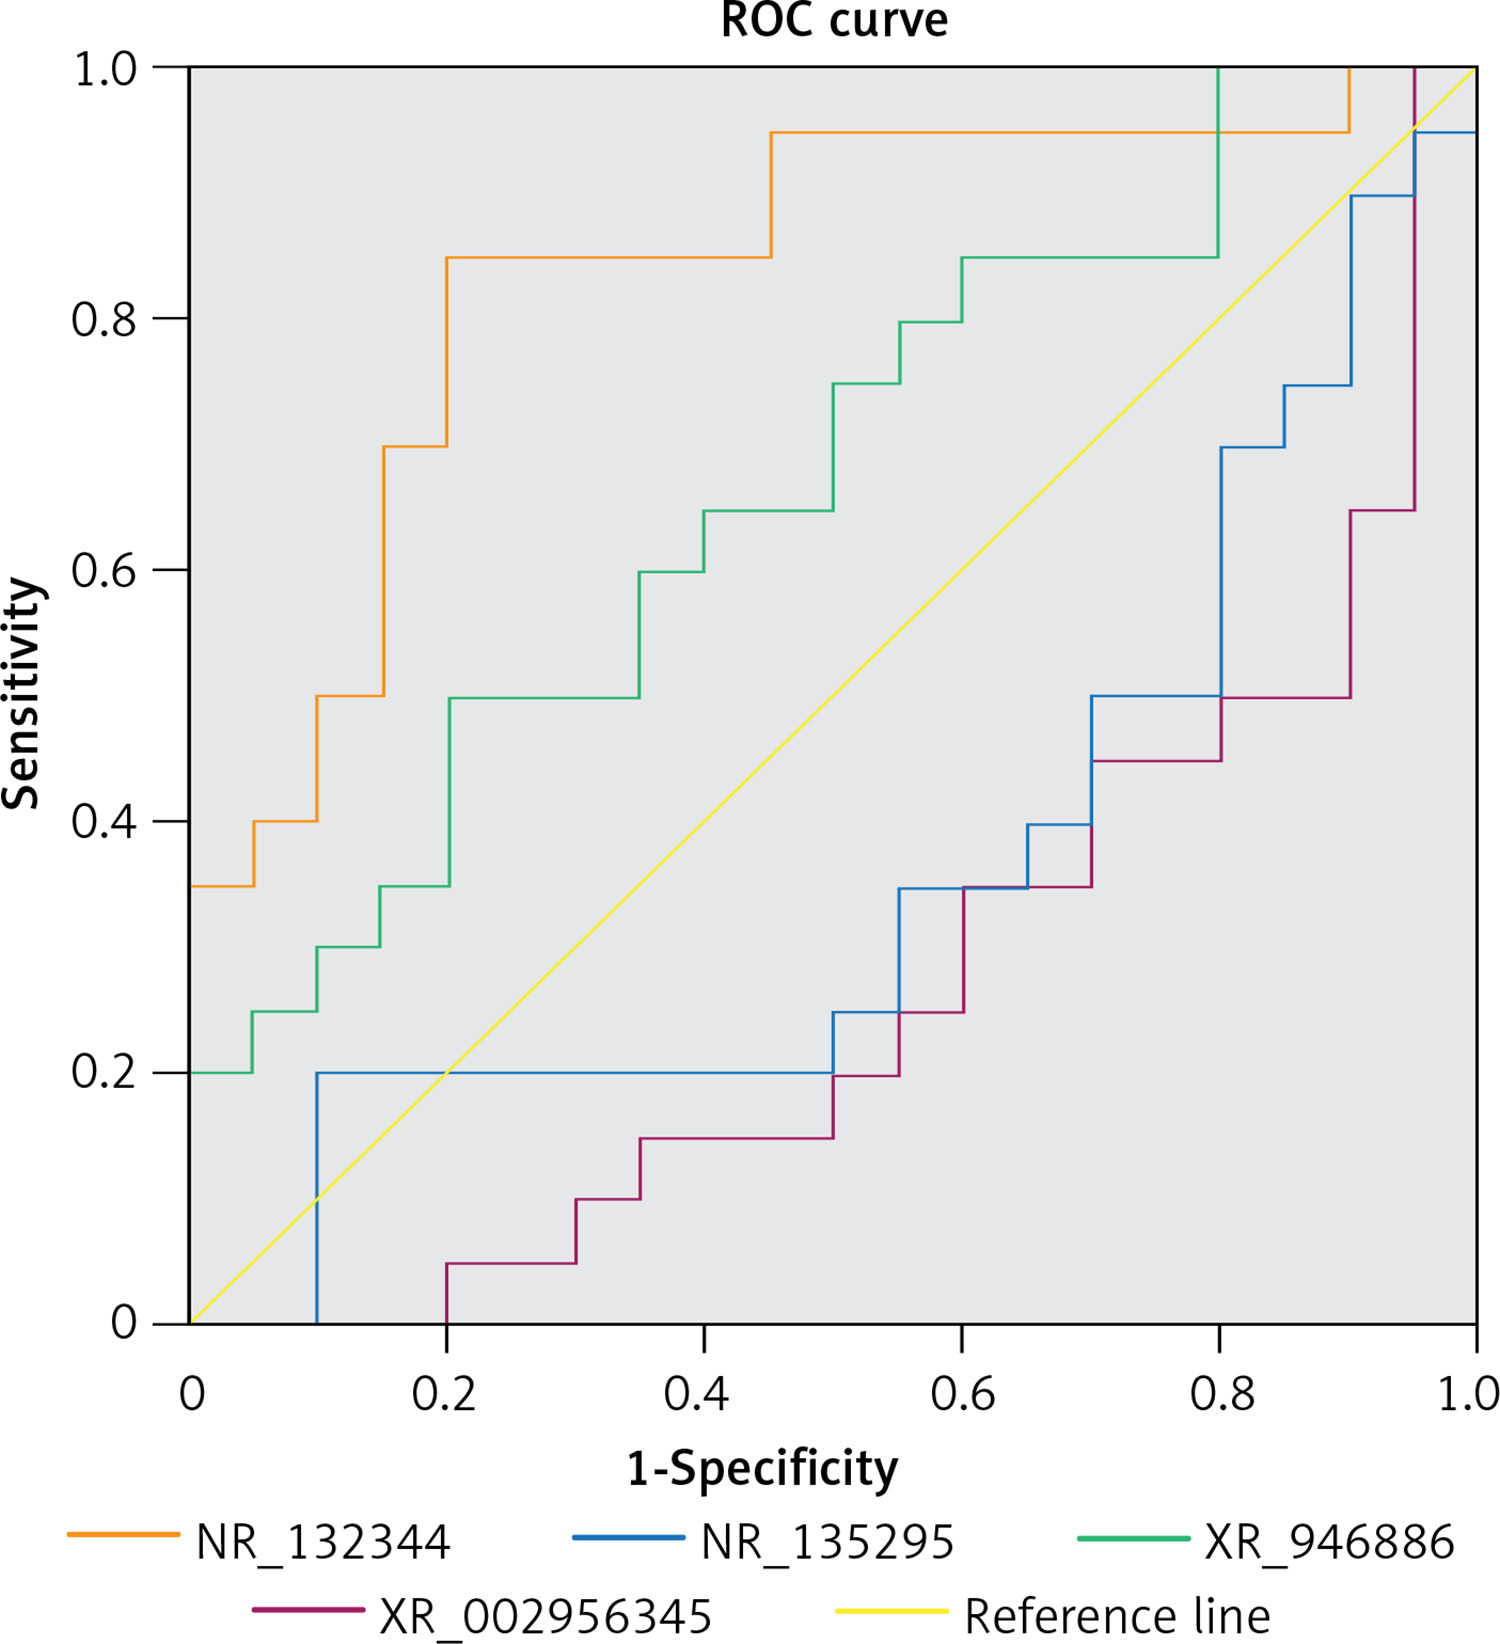
To assess the potential of NR_110876, NR_132344, XR_946886, and XR_002956345 as PBM biomarkers, we examined their ability to predict PBM in our sample. Only XR_946886 gave a significant AUC (0.837, p < 0.001) (Figure 8).
Discussion
Here we identified several lncRNAs that are differentially regulated in PBM, and we explored their potential biological functions.
Congenital dilation of the common bile duct has been shown to involve numerous alterations in the transcriptome, and PBM has been associated with downregulation of several genes in the gallbladder, as well as upregulation of some noncoding RNAs, which may contribute to biliary carcinogenesis [25]. In our previous study [26], we found 876 differentially expressed genes in children with PBM, of which 530 were up-regulated and 346 were down-regulated. Wong et al. reported on patients with congenital dilation of the common bile duct, human developmental disorders, cholangiocarcinoma or hepatocellular carcinoma [27]. However, we are unaware of investigations of lncRNAs in PBM.
In the present study, we identified 489 lncRNAs and 5036 mRNAs in bile duct tissues that were differentially expressed in PBM. These differentially expressed lncRNAs may affect many pathways, including those involved in protein digestion and absorption, interactions between extracellular matrix and surface receptors, focal adhesion, PI3K-Akt signaling, carcinogenesis, and inflammation. These predictions are consistent with previous studies [22, 24, 25]. In this way, our study implicates lncRNAs in PBM-associated chronic inflammation and carcinogenesis in the common bile duct.
We explored the potential functions of differentially expressed lncRNAs based on the functions of their target genes. We found that 5 cis-target genes were related to differentially expressed lncRNAs, and that most lncRNAs acted in a trans manner. For example, we found that one lncRNA (NR_027038.1) was closely associated with E2F4, which is consistent with previous reports linking E2F4 to development and progression of cancers [28, 29].
Of the many lncRNAs that we identified as differentially expressed, validation of a subset using qRT-PCR showed that not all microarray results were accurate. Nevertheless, we were able to validate upregulation of NR_110876, NR_132344, XR_946886, and XR_002956345. Among these lncRNAs, XR_946886 showed significant diagnostic potential. Thus, this lncRNA seems likely to be involved in the development of PBM complications, and it may serve as a novel biomarker for carcinogenesis or chronic inflammation involving the common bile duct [30].
This is the first study focused on lncRNAs in the common bile duct of PBM. Our findings may provide a basis for developing novel diagnostic and therapeutic targets in PBM. There were some limitations to the present study. The sample was relatively small, and only six lncRNAs identified in microarray experiments were validated using qRT-PCR. Future studies should be conducted with larger samples and more detailed validation and analysis of candidate genes. Future studies should also explore the potential mechanism of XR_946886 in PBM and its clinical potential as a biomarker.
In conclusion, the present study provided an overall analysis of lncRNAs in the common bile duct in PBM. By further exploring potential functions and pathways in which differentially expressed lncRNAs are involved, we anticipate that lncRNAs such as XR_946886 will be validated as biomarkers or even potential therapeutic targets for PBM treatment.