Introduction
Rheumatoid arthritis (RA), a chronic systemic autoimmune disease distributed in all racial and ethnic groups, leads to joint stiffness, deformity and damage [1]. It is characterized by irreversible, alternating episodes, swelling, pain and tenderness, which results in worsening of physical condition, a reduction of life quality, a decline in employment and increasing direct or indirect expenses [2]. Based on recent statistics, the morbidity of patients with RA in developed countries was approximately 1% in the adult population [3]. Generally, the prevalence of RA in Asian countries was less than that in North America (1.1–1.6%) or in Northern Europe (0.4–0.8%) [4].
A number of drugs which were used in treating the patients with RA separately or together responded well. Among them, infliximab, etanercept, adalimumab, golimumab, tocilizumab, abatacept, certolizumab pegol, methotrexate, and conventional disease-modifying anti-rheumatic drugs (cDMARDs) were the most common choices [5]. A report showed that the difference between certolizumab pegol and placebo in the American College of Rheumatology 20% response rate (ACR20) was statistically significant from 1 week to 24 weeks. For example, the ACR20 was 45.5% for certolizumab pegol (400 mg every 4 weeks) compared to 9.3% for placebo at week 24 [6]. However, in order to minimize the risk of neutralizing antibodies and to enhance efficacy, biologic agents are combined with cDMARDs most of the time, though several biologic agents were applied as single therapy [7]. According to the studies, patients with RA treated with placebo plus methotrexate, golimumab (100 mg) plus placebo, golimumab (50 mg) plus methotrexate and golimumab (100 mg) plus methotrexate had ACR20 response rates of 33.1%, 44.4%, 55.1% and 56.2% respectively. Apparently, the therapy combining golimumab with methotrexate can significantly relieve the disease and improve the physical condition [8].
Up to now, there have been dozens of pair-wise meta-analyses (MA) and network meta-analyses (NMA) which evaluate the efficacy and safety of different drug therapies for patients with RA. Nevertheless, most of the trials only focused on two interventions or just a few kinds of drugs, and some of the initial MAs were contradicted by subsequent studies. For instance, a 55% increase in risk of serious infection for patients who were treated with biologics was reported by a Cochrane review [9], while another trial evaluating malignancy risk in RA patients concluded that there was no significant evidence of an increased risk of malignancy using biologics [10]. In contrast, Bongartz et al. reported that RA patients who were treated by anti-TNF therapies had an increased risk of serious infections and malignancies [11]. Therefore, although previous studies have shown abundant data and information, they just verified the efficacy or safety of various therapies for patients with RA. However, the lack of head-to-head comparisons and the absence of systematical comparison made the results incomplete and inconclusive.
An NMA seeks to infer the relative efficacy of two treatments by direct and indirect comparisons. Simultaneously, it extracts and analyzes data from all randomized control trials (RCTs) to select the best therapy [12]. Four efficacy outcomes and two safety outcomes were chosen to systematically assess 15 therapies from 56 RCTs with a sample size of 20,898 patients. The objective of the current study is to better characterize the efficacy and safety of each treatment for patients with RA and then make the best choice in clinical practice.
Material and methods
Search strategy
We performed a systematic literature search in electronic databases, including PubMed, Embase and Cochrane Library, to retrieve eligible RCTs from 1997 to 2016. Key words and subject terms included “rheumatoid arthritis”, “biological factors”, “anti-TNF agents”, “infliximab”, “etanercept”, “adalimumab”, “golimumab”, “certolizumab pegol”, and “rituximab”. Two reviewers performed the initial search, and all references were reviewed to identify additional studies that were not included in the retrieval. After that, they screened the titles and abstracts to make sure that the studies met predefined selection criteria individually.
Inclusion and exclusion criteria
Studies included should meet the following criteria: (1) the study design should be RCT; (2) the trials included at least one pairwise comparison between two interventions, which should be used to treat patients with RA; (3) detailed data of at least one relevant outcome were provided. In addition, we excluded duplicate data, reviews, meeting or conference abstracts and case reports from the current analysis.
Outcome measurement and data extraction
The information as follows was extracted from each eligible study: study code, first author, year of publication, country in which the study was conducted, length of follow-up, interventions, sample size of each therapy and respective outcomes for efficacy and safety. There were 6 outcome indicators to assess the efficacy and safety. American College of Rheumatology 20%, 50%, and 70% response rate (ACR20, ACR50 and ACR70, defined as a 20%, 50% and 70% improvement in patients) at 12–54 weeks and remission were the efficacy outcomes. Among them, the primary efficacy endpoints were ACR20 and ACR50, and the secondary endpoints were ACR70 and remission. Meanwhile, adverse events (AEs) and serious adverse events (SAEs) were safety outcomes.
Statistical analysis
The indirect and direct evidence from a wide range of data was analyzed through a Bayesian NMA. After each pair-wise comparison was conducted, the network diagrams of ACR20, ACR50, ACR70, remission, AEs and SAEs were plotted with different interventions. The size of circles indicated the quantity of specific interventions and the boldness of arms showed the number of included studies. The results of these binary variables were presented as odds ratios (ORs) with corresponding 95% credible intervals (CrIs). In addition, net heat plots and node-splitting test were used to analyze the inconsistency level between indirect and direct evidence. The rank probabilities of efficacy and safety of 15 therapies were assessed using surface under the cumulative ranking curve (SUCRA), and the Jadad scale was used to evaluate the methodological quality of eligible studies. All statistical analyses were implemented by STATA version 12.0.
Results
Studies included in the network meta-analysis
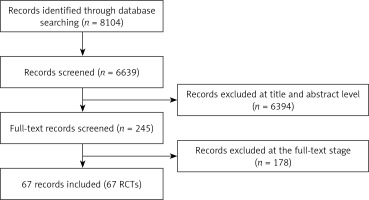
According to a systematic literature search in electronic databases, a total of 8,104 records were identified. Among them, 1,465 duplicate publications and 6,394 articles were excluded due to their irrelevant titles and abstracts. The remaining 245 articles were selected for full-text review and 178 articles assessed as ineligible were excluded. Eventually, 67 RCTs dating from 1997 to 2016 met the inclusion criteria with 20,898 patients [13–79]. The searching and selection steps are shown in Figure 1.
Characteristics of included studies
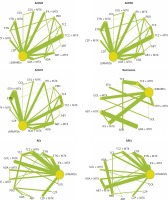
The characteristics of included trials are shown in Table I. In detail, 33 of 56 different trials covered patients around the world and 15 trials included patients predominantly from Asia. The rest of the trials were reported to include patients from Europe (5 studies) and America (3 studies). The length of follow-up ranged from 12 to 54 weeks. Most of the trials included a comparison between two interventions. Only 5 trials mentioned comparisons among three interventions. All trials involved 10 drugs as follows: infliximab (INF), etanercept (ETN), adalimumab (ADA), golimumab (GOL), tocilizumab (TCZ), abatacept (ABT), certolizumab pegol (CZP), methotrexate (MTX), conventional disease-modifying anti-rheumatic drugs (cDMARDs) and placebo (PBO). The full network of comparisons categorized in different outcomes was shown in Figure 2.
Table I
Patient characteristics in the studies included in the mixed-treatment comparison (MTC) analysis
[i] PBO – placebo, MTX – methotrexate, IFX – infliximab, ETN – etanercept, ADA – adalimumab, GOL – golimumab, TCZ – tocilizumab, ABT – abatacept, CZP – clonazepam, cDMARDs – traditional synthetic disease modifying antirheumatic drugs, ACR – American College of Rheumatology, AEs – adverse events, SAEs – serious adverse events.
American College of Rheumatology 20% response rate (ACR20)
ACR20 was normally defined as a 20% improvement for patients with rheumatoid arthritis. The estimated ORs with 95% CrIs of ACR20 for each comparison are shown in the lower panel of Table II. Among these 15 therapies, ABT + MTX (OR = 5.42, 95% CrI: 2.12–14.0), ADA (OR = 4.31, 95% CrI: 2.53–7.39), ADA + MTX (OR = 5.81, 95% CrI: 2.39–14.7), CZP (OR = 11.3, 95% CrI: 4.48–28.8), CZP + MTX (OR = 9.68, 95% CrI: 3.86–24.5), ETN (OR = 4.22, 95% CrI: 2.23–8.17), ETN + MTX (OR = 6.31, 95% CrI: 3.10–14.0), GOL + MTX (OR = 6.23, 95% CrI: 2.46–15.6), INF + MTX (OR = 5.75, 95% CrI: 2.39–14.1), TCZ (OR = 5.64, 95% CrI: 2.8–11.47) and TCZ + MTX (OR = 7.10, 95% CrI: 3.16–16.1) revealed superior efficacy under the endpoint of ACR20 compared with PBO. In addition, CZP + MTX was more efficacious than ETN when comparing ACR20 (OR = 2.29, 95% CrI: 1.03–5.10).
Table II
Odds ratio estimates with 95% credible intervals of ACR20 and ACR50 for each comparison
[i] PBO – placebo, MTX – methotrexate, IFX – infliximab, ETN – etanercept, ADA – adalimumab, GOL – golimumab, TCZ – tocilizumab, ABT – abatacept, CZP – clonazepam, cDMARDs – traditional synthetic disease modifying antirheumatic drugs, ACR – American College of Rheumatology, AEs – adverse events, SAEs – serious adverse events.
American College of Rheumatology 50% response rate (ACR50)
Base on the upper panel of Table II, PBO showed the worst performance for ACR50 compared with all therapies except cDMARDs (OR = 1.86, 95% CrI: 0.94–3.71). As for cDMARDs, it revealed worse efficacy than the other treatments except ABT, GOL and PBO. In addition, ETN + MTX, CZP + MTX and TCZ + MTX were superior to ETN for the efficacy of ACR50 (ETN + MTX: OR = 1.59, 95% CrI: 1.01–2.56; CZP + MTX: OR = 2.27, 95% CrI: 1.07–4.76; TCZ + MTX: OR = 2.10, 95% CrI: 1.06–4.01.
American College of Rheumatology 70% response rate (ACR70)
As shown in the lower panel of Table III, only cDMARDs (OR = 2.41, 95% CrI: 0.91–7.10) demonstrated no statistically significant difference from PBO. Similarly, all the therapies appeared superior to cDMARDs when comparing ACR70, except for ABT (OR = 1.60, 95% CrI: 0.32–7.54), ADA (OR = 2.77, 95% CrI: 0.93–8.08) and GOL (OR = 2.69, 95% CrI: 0.37–10.3) Additionally, CZP enjoyed obvious superiority to ABT (OR = 0.05, 95% CrI: 0.01–0.62) and ADA (OR = 0.09, 95% CrI: 0.01–0.84).
Table III
Odds ratio estimates with 95% credible intervals of ACR70 and remission for each comparison
[i] PBO – placebo, MTX – methotrexate, IFX – infliximab, ETN – etanercept, ADA – adalimumab, GOL – golimumab, TCZ – tocilizumab, ABT – abatacept, CZP – clonazepam, cDMARDs – traditional synthetic disease modifying antirheumatic drugs, ACR – American College of Rheumatology, AEs – adverse events, SAEs – serious adverse events.
Remission
The efficacy endpoint of remission was evaluated among 11 treatments as displayed in the upper panel of Table III. It could be observed that TCZ and TCZ + MTX were significantly better than ABT + MTX (OR = 0.06, 95% CrI: 0.01–0.45; OR = 0.15, 95% CrI: 0.03–0.87), cDMARDs (OR = 0.01, 95% CrI: 0.01–0.07; OR = 0.04, 95% CrI: 0.01–0.11), ETN (OR = 0.03, 95% CrI: 0.01–0.32; OR = 0.07, 95% CrI: 0.01–0.64), ETN + MTX (OR = 0.05, 95% CrI: 0.01–0.34; OR = 0.13, 95% CrI: 0.02–0.65), GOL + MTX (OR = 0.08, 95% CrI: 0.01–0.55; OR = 0.22, 95% CrI: 0.05–0.98) and IFX + MTX (OR = 0.05, 95% CrI: 0.01–0.44; OR = 0.15, 95% CrI: 0.02–0.86) in disease remission. However, there was no particular evidence to confirm which one of TCZ and TCZ + MTX was better. ABT + MTX (OR = 0.25, 95% CrI: 0.06–0.97), ETN + MTX (OR = 0.29, 95% CrI: 0.08–0.98) and GOL + MTX (OR = 0.18, 95% CrI: 0.06–0.50) also presented greater remission of pain compared to cDMARDs. Additionally, GOL (OR = 0.05, 95% CrI: 0.01–0.66) was less efficacious than TCZ.
Adverse events (AEs)
The safety outcomes are shown in Table IV. Statistically, ABT (OR = 1.86, 95% CrI: 1.03–3.42), ADA (OR = 2.10, 95% CrI: 1.32–3.25) and CZP (OR = 2.01, 95% CrI: 1.25–3.29) presented a higher risk of AEs than PBO. ADA was more likely to cause adverse events than ADA + MTX (OR = 2.10, 95% CrI: 1.02–4.48), cDMARDs (OR = 2.59, 95% CrI: 1.35–5.00), CZP + MTX (OR = 2.08, 95% CrI: 1.01–4.31), ETN + MTX (OR = 2.10, 95% CrI: 1.08–4.14), GOL (OR = 2.51, 95% CrI: 1.04–5.99) and PBO (OR = 2.10, 95% CrI: 1.32–3.25). In comparison with ETN + MTX (OR = 2.01, 95% CrI: 1.01–4.10) and GOL (OR = 2.44, 95% CrI: 1.00–5.81) more patients taking CZP dropped out due to AEs. Moreover, the safety of cDMARDs for adverse events was superior to CZP (OR = 0.40, 95% CrI: 0.20–0.79), ETN (OR = 0.62, 95% CrI: 0.43–0.87), IFX + MTX (OR = 0.73, 95% CrI: 0.52–0.98), TCZ (OR = 0.65, 95% CrI: 0.47–0.92) and TCZ + MTX (OR = 0.69, 95% CrI: 0.53–0.90).
Table IV
Odds ratio estimates with 95% credible intervals of AEs and SAEs for each comparison
[i] PBO – placebo, MTX – methotrexate, IFX – infliximab, ETN – etanercept, ADA – adalimumab, GOL – golimumab, TCZ – tocilizumab, ABT – abatacept, CZP – clonazepam, cDMARDs – traditional synthetic disease modifying antirheumatic drugs, ACR – American College of Rheumatology, AEs – adverse events, SAEs – serious adverse events.
Serious adverse events (SAEs)
The comparison of SAEs for all the treatments is displayed in the upper panel of Table IV. CZP (OR = 3.86, 95% CrI: 1.48–11.5) presented a worse performance than PBO (OR = 0.26, 95% CrI: 0.09–0.68), INF + MTX (OR = 0.23, 95% CrI: 0.06–0.91), cDMARDs (OR = 0.21, 95% CrI: 0.05–0.78), ADA + MTX (OR = 0.21, 95% CrI: 0.05–0.86), ADA (OR = 0.26, 95% CrI: 0.08–0.74) and ABT + MTX (OR = 0.16, 95% CrI: 0.04–0.66). In contrast, ABT + MTX was more efficacious in reducing the SAEs in comparison with CZP + MTX (OR = 0.51, 95% CrI: 0.24–0.99), ETN (OR = 0.51, 95% CrI: 0.25–0.92), GOL + MTX (OR = 0.35, 95% CrI: 0.14–0.78) and TCZ (OR = 0.50, 95% CrI: 0.24–0.96). Furthermore, cDMARDs (OR = 0.44, 95% CrI: 0.20–0.89) worked better than GOL + MTX in withdrawal due to SAEs.
Relative ranking analysis
Relative ranking of the treatments is assessed by SUCRA in Table V. Since CZP + MTX not only had high efficacy in ACR20 (83.3%), ACR50 (84.2%) and ACR70 (75.1%) but also performed well in AEs and SAEs, we recommend CZP + MTX as the optimal drug therapy. Another alternative was TCZ + MTX for the same reason. By contrast, ABT was regarded as the worst choice in treating RA because of its low probability in efficacy outcomes (ACR20: 10.8%, ACR50 = 2.4%, ACR70 = 20.0%) and safety outcomes (AEs = 14.8%, SAEs = 17.2%). Also, cDMARDs are not recommended due to their low efficacy, though their safety seemed to be superior.
Table V
Relative ranking of the treatments assessed by surface under cumulative ranking curve area
[i] PBO – placebo, MTX – methotrexate, IFX – infliximab, ETN – etanercept, ADA – adalimumab, GOL – golimumab, TCZ – tocilizumab, ABT – abatacept, CZP – clonazepam, cDMARDs – traditional synthetic disease modifying antirheumatic drugs, ACR – American College of Rheumatology, AEs – adverse events, SAEs – serious adverse events.
Consistency test
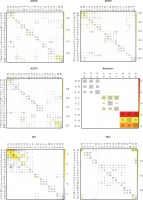
The node-splitting method was used to evaluate the consistency level between direct and indirect evidence. P-values < 0.05 implied the existence of a significant inconsistency. As listed in Table VI, a significant inconsistency did exist in the analysis of remission and AEs. As for remission, obvious inconsistency was found in the comparisons between TCZ and cDMARDs (p = 0.013), TCZ + MTX and cDMARDs (p = 0.015), as well as TCZ + MTX and TCZ (p = 0.019). On the other hand, no consistency between ETN + MTX and cDMARDs (p < 0.001), TCZ and ETN + MTX (p = 0.034), TCZ + MTX and ETN + MTX (p = 0.025) was demonstrated when comparing them with AEs. The results of the consistency test are also visually presented in Figure 3 with net heat plots, which indicated the same results as in Table VI.
Table VI
Results of consistency analysis by node-splitting plot
[i] PBO – placebo, MTX – methotrexate, IFX – infliximab, ETN – etanercept, ADA – adalimumab, GOL – golimumab, TCZ – tocilizumab, ABT – abatacept, CZP – clonazepam, cDMARDs – traditional synthetic disease modifying antirheumatic drugs, ACR – American College of Rheumatology, AEs: adverse events, SAEs – serious adverse events.
Figure 3
Results of consistency analysis by heat plot. Inconsistency between direct and indirect evidence was assessed using the net heat plots, which visually displayed the inconsistency level with different colors. The more vibrant the color was, the more serious was the indicated inconsistency
A – TCZ + MTX, B – TCZ, C – PBO, D – IFX + MTX, E – GOL + MTX, F – GOL, G – ETN + MTX, H – ETN, I – CZP + MTX, J – CZP, K – cDMARDs, L – ADA + MTX, M – ADA, N – ABT + MTX, O – ABT.

Publication bias
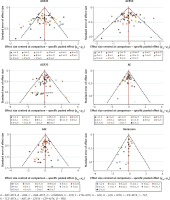
The estimate of publication bias was performed by the symmetry characteristics of the dots representing included trials with different colors in the funnel plots. According to Figure 4, all of the funnel plots were focused in the triangle funnel areas in left and right directions, which suggested that the distribution of dots verified no significant publication bias or small study effect among the trials in ACR20, ACR50, ACR70, AEs, SAEs and remission.
Evaluation of the methodological quality of eligible studies
The Jadad scale was used to appraise the methodological quality of included studies, and the scores of the Jadad scale of each individual study are shown in Table VII. As shown in Table VII, most scores are greater than 4, which indicates that those included studies are of high quality.
Table VII
Jadad scale of 67 included studies
[i] Each question was to be answered with either a yes or a no. Each yes would score a single point, each no zero points. Additional points were given if: The method of randomization was described in the paper, and that method was appropriate (1 extra point in the randomization part); the method of blinding was described, and it was appropriate (1 extra point in the blinding part).
Discussion
Based on the data and information of included RCTs, our study aims to evaluate the efficacy and safety of 15 drug therapies for RA patients. All available direct and indirect evidence of various treatment options was analyzed and compared simultaneously by NMA, which has a great advantage over traditional MA and makes up for the lack of head-to-head comparisons [80]. Therefore, our studies are much more reliable than the other MAs or NMAs. Moreover, it is more reasonable to select 4 efficacy and 2 safety endpoints as the evaluation indexes. Although there are also some NMA studies on this topic, they mostly include two or three outcomes to be compared. For example, some researchers only select ACR20 as the efficacy outcome and AEs as the safety outcome [1], which is not comprehensive enough.
After a systematic analysis of 15 therapies for patients with RA from 56 RCTs, we prefer to recommend CZP + MTX as the best treatment due to it having the highest rankings in ACR20 (83.3%) and ACR50 (84.2%) response rates and relatively low risk of adverse events. TCZ + MTX is recommended as an alternative treatment due to its good performance in all efficacy and safety outcomes. ABT is considered as the worst therapy, and cDMARDs is also not recommended though its safety seemed to be superior.
Interestingly, among these 15 drug therapies, six are biologics and another six are different combinations of MTX and biologics, including comparisons between ABT and ABT + MTX, ADA and ADA + MTX, CZP and CZP + MTX, ETN and ETN + MTX, GOL and GOL + MTX as well as TCZ and TCZ + MTX. It is easy to find that in most cases the efficacy and safety of a biological agent plus MTX are superior to the corresponding biologic agent alone. For example, the SUCRAs of efficacy and safety outcomes for ABT are as follows: 10.8% (ACR20), 23.9% (ACR50), 20% (ACR70), 14.8% (AEs) and 17.2% (SAEs). By contrast, ABT + MTX is more efficacious and safer with corresponding SUCRAs of 51%, 56.4%, 60.5%, 54.9% and 85.2%. Previous researchers have also conducted direct comparisons between biologic monotherapy and a biological agent combined with MTX. For instance, Klareskog et al. demonstrated that the proportions of RA patients achieving ACR20, ACR50 and ACR70 were higher under the treatment of ETN + MTX than the ETN monotherapy. At week 52, about 85%, 69%, 43% and 35% of patients in the ETN + MTX group achieved ACR20, ACR50, ACR70 and remission compared with 76%, 48%, 24% and 16% in the ETN groups [81], which is in line with our results.
However, a closer observation reveals that there is an exception. GOL + MTX performs better in all efficacy outcomes than GOL as the other treatments of a biologic agent plus MTX, while it performed worse in AEs and SAEs. There are also studies which presented a different conclusion. Some studies published before presented no difference between two kinds of treatment groups. Patients with RA treated with ETN and those treated with ETN + MTX were similar in ACR20, ACR50 and ACR70 (71.0% vs. 67.1%, 41.9% vs. 40.1% and 17.4% vs. 18.4%, respectively). The rates of adverse events and serious adverse events were also similar [82]. Maini et al. arrived at the same conclusion in the comparison between TCZ + MTX and TCZ [83]. Thus, further research should be conducted to estimate whether MTX benefits biologic monotherapy or not.
Although we have made the study as comprehensive as possible, there are still some limitations. Firstly, despite the fact that the inclusion trials were all RCTs, the results of efficacy and safety comparisons among 15 drug therapies still showed some statistical inconsistency. Perhaps the RCTs with contradictions between direct and indirect evidence should be reconsidered. Secondly, though disease durations of these interventions ranged from 14 weeks to 54 weeks, 16 of them only had a follow-up time of less than 20 weeks. A short duration is not enough to judge the safety of treatment [1]. Thirdly, medication dose, treatment cost, patient compliance and other influential factors also affected trial homogeneity. To some extent, the improvement in patients with RA is related to the dose of drugs, which was neglected in this study [83]. Last but not least, different RCTs included in our research had different definitions of safety outcomes. There is still a shortage of clear definition of AEs and SAEs.
In conclusion, we regard CZP + MTX as the optimal choice for RA patients in clinical practice and TCZ + MTX as an alternative treatment. Conversely, both ABT and cDMARDs are not recommended. It is necessary to conduct long-term studies on patients with RA in order to provide a more complete assessment of diverse treatments and make a more judicious choice in clinical practice. In other words, we ought not only take into account clinical parameters such as ACR response rates and safety outcomes, but should also consider medication dose, treatment cost, patient compliance and so on. All efforts should be made to improve the life quality and health standard for patients with RA.


