Introduction
Kidney transplantation is considered as the best treatment option for patients with end-stage renal disease, and knowledge of the immune system is crucial in its management [1]. Among the organs related to the immune system, the adipose tissue is gradually gaining importance. Thus, in the last few years, this tissue, which was believed to simply function as energy storage, has also been acknowledged to have an important role in endocrine and immune homeostasis by synthesizing a variety of hormones, known as adipocytokines [2].
Leptin is one of the most widely studied of these adipocytokines. It has been implicated in the pathogenesis of cardiovascular disease (CVD), through crosstalk between adipose tissue and blood vessels, as well as being associated with inflammation and NO production [3]. Patients with chronic kidney disease (CKD) have been shown to have increased circulating levels of leptin that may result from an increase in their systemic production and/or a decrease in their renal excretion [4–7]. In these patients, higher leptin levels have been related to coronary heart disease [8], hypertension [9] and diabetes mellitus [10]. Much less is known, however, about the role of leptin in renal transplant recipients. The few reported results in these patients reveal findings that do not necessarily reflect the same situation as in the general population [2, 11, 12]. In the same manner, how and why leptin levels fluctuate after grafting is not completely understood yet.
The leptin receptor, coded by the LEPR gene, is present in the cell membranes of a wide variety of cells of different tissues, indicating the critical physiological functions of this adipocytokine [13]. In this regard, a number of single nucleotide polymorphisms (SNPs) in this gene have been suggested to play an important role in different morbid conditions such as diabetes, hypertension and other cardiovascular events [12, 14–16], all of which are commonplace in renal transplant recipients.
In the present study we aimed to determine (i) whether three common, functional SNPs in the LEPR gene (Lys109Arg rs1137100, Gln223Arg rs1137101 and Lys656Asn rs1805094) were related to different outcomes in renal transplantation, (ii) whether leptin concentrations were associated with these outcomes and (iii) whether these SNPs may affect such concentrations in a population of renal transplant recipients.
Material and methods
Study design
The study sample consisted of 236 Caucasian patients who underwent kidney transplantation at the Badajoz University Hospital, the reference center for renal transplantation in the health district of Badajoz (Southwest Spain). Patients included in the study received a single kidney from deceased donors. We recruited all prevalent kidney transplant recipients who attended the Transplant Follow-up Unit between October 2014 and September 2015 and whose time since grafting was between 1 and 15 years. At the time of their visit, patients received detailed information regarding the study and written informed consent was obtained. Fifteen-milliliter blood samples were then collected from all participants into BD Vacutainer EDTA tubes (Becton Dickinson, New Jersey, USA); 10 ml were for DNA purification and the other 5 ml were immediately centrifuged to obtain plasma for the determination of leptin levels. Both plasma and whole blood samples were then stored at –80°C until analyzed.
The study was approved by the Ethics Committee of the Badajoz University Hospital and the Bioethics Committee of the University of Extremadura and was conducted in accordance with the Declaration of Helsinki and its subsequent revisions.
Variables and clinical outcomes
Medical records were retrospectively reviewed to retrieve meaningful clinical and demographic variables and different outcomes to assess their association with genetic polymorphisms and leptin levels. Delayed graft function (DGF) was defined as the need for dialysis within the first week after transplantation [17]. Acute allograft rejection was established by histological findings in renal biopsies according to the Banff classification and/or by clinical evaluation as previously described [18, 19]. Renal function was assessed 1 year after grafting and at the time of sampling by using the Modification of Diet in Renal Disease (MDRD) formula [20] as suggested by the K/DOQI Group [21].
Genotype analysis
We used a standard phenol/chloroform extraction method in order to isolate genomic DNA from the whole blood samples. Three variants in the leptin receptor (LEPR) gene, namely rs1137100, rs1137101 and rs1805094, were identified by real-time PCR using commercial TaqMan SNP Genotype Assays from Thermo Fisher Scientific (Rockford, Il, USA). These SNPs were selected based on existing reports linking their presence to significant clinical repercussions. Previously sequenced samples were used as negative and positive controls to rule out possible genotyping errors. Likewise, the analysis of 5% of the samples was duplicated and confirmed by direct sequencing (ABI3700 DNA Analyzer; Perkin-Elmer/Applied Biosystems).
Determination of leptin concentrations
Plasma leptin concentrations were measured using immunoassay kits based on solid-phase sandwich enzyme-linked immunosorbent assay following the manufacturer’s instructions (DRG Leptin Sandwich ELISA, DRG Instruments GmbH, Germany). A four-parameter curve fit was used for the calculation of the concentrations.
Statistical analysis
χ2 or Fisher’s exact test was used for the univariate analyses of differences between categorical variables. Differences between quantitative variables across groups were assessed by Mann-Whitney/Kruskal-Wallis or Student’s t/ANOVA tests, depending on the normality of the data and the number of groups studied. The analysis of the effect of both genetic and nongenetic variables was performed with multivariate regression modelling, adjusting for demographic and clinical covariates. These variables were chosen because of their significance observed in univariate studies (p < 0.15) and/or based on clinical criteria. The covariates considered in each case are listed either in the Results section or in the related tables.
For the haplotype study, the SNPassoc package in the R environment was utilized to estimate the frequency of the resulting haplotypes and to determine the effect of these allele combinations on the analyzed outcomes controlling for significant covariates. The frequency threshold for rare haplotypes was set at 0.01.
Statistical analyses were performed using the SNPassoc R package and the IBM SPSS Statistics package v.22 (IBM Corporation, Armonk, NY, USA).
Results
The study included 236 renal transplant recipients, 143 (60.6%) of whom were male; their mean age was 48.82 ±12.54 years. The majority of patients (210, 89.0%) were treated with tacrolimus, and only 26 (11.0%) received cyclosporine. Follow-up time ranged between 1 and 16 years (mean: 7.68 ±4.14 years). Mean donor age was 46.94 ±16.38 years.
Leptin concentrations and association with clinical outcomes
High interindividual variability was observed in the plasma leptin concentrations of our patients. Global mean and standard deviation values were 12.42 ±17.80 ng/ml, which are of the same order as those previously reported for kidney transplant recipients [22–24]. We did not find a significant correlation of leptin concentrations with the time elapsed since grafting (p > 0.05).
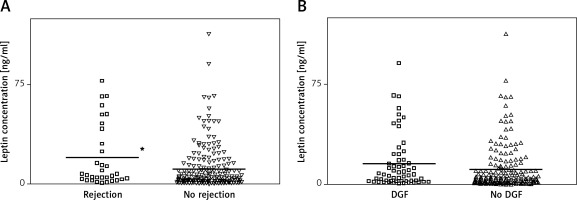
Figure 1 A shows that patients with a history of acute rejection (14.4%) had higher values of leptin than patients without that complication did (19.92 ±23.72 vs. 11.22 ±16.42 ng/ml). A regression model controlling for meaningful covariates, namely donor age, hypertension in the recipient, time on dialysis, human leukocyte antigen (HLA) mismatch and Homeostasis Model Assessment (HOMA) index produced a significant odds ratio (OR) with 95% confidence interval (CI) of 1.03 (1.01–1.05), p = 0.03, indicating increased risk of rejection for patients with higher leptin plasma levels. In the same manner, patients who had experienced DGF (25.0%) also had higher values of leptin than patients who did not have that complication (15.81 ±20.27 vs. 11.29 ±16.81; Figure 1 B). However, the association was not statistically significant after controlling for other relevant covariates (hypertension in the recipient, donor age, time on dialysis and cold ischemia time) (OR = 1.01 (1.00–1.03), p = 0.135) (Figure 1 B).
Figure 1
Distribution of leptin levels according to the occurrence of acute rejection (A) or delayed graft function (DGF) (B). *p < 0.05

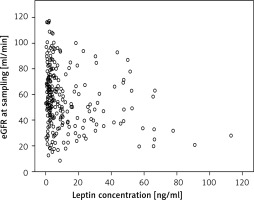
Renal function, measured as estimated glomerular filtration rate (eGFR), displayed an average of 57.06 ±23.46 ml/min in the transplant recipients 1 year after grafting. Leptin concentrations negatively correlated with renal function at the time of sampling, as patients with higher leptin concentrations had much lower eGFR (p = 0.001; Figure 2).
Impact of genetic variants
Table I shows the distribution of the different LEPR genotypes analyzed, as well as the minor allele frequencies observed in our population. The observed frequencies did not significantly differ from those expected by the Hardy-Weinberg equilibrium.
Table I
Genotypic and allelic frequencies in 236 renal transplant recipients
| Polymorphism/genotype | N | % | MAF | HWE | |
|---|---|---|---|---|---|
| LEPR rs1137100 | AA | 135 | 57.2 | 0.237 | 0.475 |
| AG | 90 | 38.1 | |||
| GG | 11 | 4.7 | |||
| LEPR rs1137101 | AA | 83 | 35.2 | 0.403 | 0.787 |
| AG | 116 | 49.2 | |||
| GG | 37 | 15.7 | |||
| LEPR rs1805094 | GG | 155 | 65.7 | 0.189 | 1.000 |
| GC | 73 | 30.9 | |||
| CC | 8 | 3.4 | |||
None of the LEPR SNPs assayed significantly affected leptin plasma levels in our series, as revealed by linear logistic regression adjusting for age at sampling, sex, body mass index (BMI), cholesterol levels and time since grafting (Table II).
Table II
Association of leptin concentrations with the LEPR SNPs studied
Delayed graft function was present in 25% of patients in our series. The rs1137101 G allele showed an inverse association with the risk of DGF (OR = 0.50 (0.27–0.91), p = 0.024). After adjusting for other demographic and clinical covariates, the degree of the association increased significantly up to an OR of 0.42 (0.22–0.81), p = 0.009 (Table III).
Table III
Logistic regression model for the influence of LEPR rs1137101 on the incidence of delayed graft function
With regard to the genetic association with acute rejection (experienced by 14.4% of our patients), the homozygous rs1805094 CC genotype showed a non-significantly higher risk of this complication (8.8% of CC carriers in the rejection group compared with 2.5% in the non-rejection group; p = 0.09). This association became statistically significant after controlling for other relevant variables (OR = 11.38 (2.15–60.16), p = 0.004) (Table IV).
Table IV
Logistic regression model for the influence of LEPR rs1805094 on the incidence of acute rejection
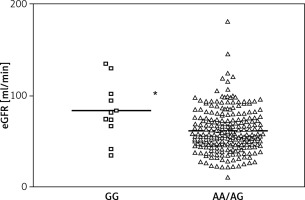
Finally, a statistically significant association was observed between the rs1137100 GG genotype and better renal function 1 year after grafting. GG carriers had an average eGFR value of 83.41 ±31.36 vs. 62.09 ±23.84 ml/min in AA/AG carriers. The p-value for the difference was 0.010 (mean difference = 20.20 (4.91–35.49)) after controlling for recipient age, time in dialysis, hypertension in the recipient, HOMA index, C-reactive protein levels and leptin levels (Figure 3).
Haplotype study
We next tested whether combinations of the three LEPR SNPs (rs1137100/rs1137101/rs18005094) could also affect clinical outcomes in renal transplantation and/or modify leptin plasma concentrations. Haplotype *1, formed by the three wild type alleles, was the most frequent, being present in 40.5% of the population. No significant associations were observed for any of the four haplotypes when controlling for the same covariates utilized in the single-SNP study (see above).
Discussion
The adipose tissue constitutes an important organ of the immune system acting through the adipocytokines. However, the role of leptin in kidney transplantation is still mostly unknown, including the relevance of the concentration variability after the transplant, its involvement in complications after grafting and the functional consequences of polymorphisms occurring in the receptor gene locus.
The first part of our study aimed to measure leptin levels in renal transplant recipients and assess their effect on clinical outcomes. We did not find significant changes in these levels related to the time elapsed since transplant. Other authors have reported that leptin concentrations decrease soon after grafting [23, 25–27] and increase back to pretransplant values after some years [23]. It should be noted, however, that pretransplant leptin levels were not available in our series and hence we could not measure changes compared to basal values in each individual, but rather differences between patients who underwent transplantation at different times.
Our results showed that leptin levels, measured at the time of the patient’s visit to the Transplant Follow-up Unit, were directly associated with the occurrence of acute rejection. As we mentioned before, data on the impact of leptin on renal transplantation outcomes are very scarce. Only two research groups have previously studied this association with rejection using leptin measures at different times, although with conflicting results. Thus, Dedinska et al. [28] reported that high serum leptin concentrations before the transplant were associated with increased risk of acute rejection. In contrast, Fonseca et al. [29] could not find such an association when measurements were performed in the first week after grafting. The fact that leptin levels were determined in our study with a cross-sectional design, i.e., at different times since grafting in each individual, makes our results hardly comparable with those of these two studies. In any case, an explanation for the observed higher risk of rejection could be that patients with higher leptin concentrations would presumably have an increased inflammatory response in the graft, thus increasing the risk for this complication. This same hypothesis could be applied for the occurrence of DGF. Indeed, the same study by Fonseca et al. [29] revealed that higher leptin levels were related to the incidence of DGF. In our study, patients who had experienced DGF had higher values of leptin, but the difference was not significant. Again though, the sampling took place at different times after grafting and consequently we could not confirm these previous findings based on levels measured only days after the surgery. Finally, we found that transplant recipients with higher leptin concentrations had far worse renal function (measured at the time of sampling) than other patients. Possibly the observed elevated leptin levels in these patients with poorer renal function was due to reduced excretion of the protein, which is cleared from the circulation by glomerular filtration [30]. However, leptin has also been suggested to be involved in renal dysfunction, as it plays an important role in the onset and progression of glomerular endothelial proliferation, vascular damage, increased production of collagen and mesangium cell hypertrophy [31, 32]. Furthermore, the Olivetti Heart prospective study recently published its results arguing for a key causal effect of leptin on renal risk over time [33]. We believe these two hypotheses may be complementary and that the observed leptin/eGFR association is likely to be a consequence of both of them.
The second part of the study focused on the impact of LEPR genetic variants. We observed that leptin concentrations did not correlate with the presence of any of the LEPR variants studied (or their combinations). Recently, it has been reported that carriers of the rs1137101 SNP showed higher leptin concentrations, although the association was exclusively observed in obese women [13]. In fact, and in line with our findings, other studies have not been able to find an effect of any of the three SNPs assayed on the circulating levels of the protein [34, 35], or, for that matter, of other well-studied LEPR polymorphisms [36]. In principle, a deficiency in the leptin receptor would not necessarily have to modify leptin levels. Daghestani et al. claim that this deficiency could cause leptin resistance, eventually leading to increased levels, but the authors could not find a suitable mechanism to support this hypothesis [13].
We found that carriers of the LEPR rs1137101 G allele displayed an inverse association with the risk of DGF. The acute kidney injury that leads to DGF in the first week of kidney transplantation has a strong inflammatory component [37]. It is tempting to speculate that recipients carrying the G variant allele would presumably have diminished leptin receptor signaling [38, 39] and hence the in situ inflammatory processes related to this adipocytokine would be impaired, overall resulting in a decreased risk for the complication. To our knowledge, this is the first study to analyze these genetic associations in patients with DGF, although the SNP has been widely studied in other pathologies. For instance, our group has recently reported how this variant was associated with post-transplant diabetes mellitus, including in renal transplant recipients, and hypothesized that the leptin receptor deficiency would also be reflected in an impaired glucose-lowering function [16]. Overall, there is no consensus in the literature on whether the rs1137101 G variant is a “risk allele”. Most likely, its effect will depend on the specific pathology and on the role leptin has in it. For instance, a recent meta-analysis reported a protective role of the G allele in oropharyngeal cancer after examining over 35,000 subjects [40].
With regard to acute rejection, carriers of the rs1805094 CC genotype showed a significantly higher risk of acute rejection than carriers of the other genotypes did. This SNP has been far less studied than rs1137101, and its role in leptin function is unknown, so we can only speculate on what the consequences of harboring a homozygous CC genotype would be. There are studies that relate this polymorphism to the immune system [41], which could be a connection with acute rejection. In any case, we believe that the reported association with acute rejection should be interpreted with caution, as the homozygous variant genotype was carried by only eight individuals, which translated into very wide confidence intervals for the observed odds ratio.
Finally, we found that the rs1137100 GG homozygous genotype strongly correlated with better renal function in renal transplant recipients 1 year after grafting. We observed in this study that lower leptin levels were associated with better eGFR (see above). However, as we mentioned before, no relationship could be found between the LEPR genotypes and leptin concentrations, therefore, there must be a different mechanism underlying this observation. Following the same rationale described for DGF, and assuming that a homozygous variant genotype would impair leptin receptor signaling, patients with this genotype would be less exposed to leptin-related processes in the long term, such as endothelial proliferation in the glomerulus, vascular damage, increased collagen, cell hypertrophy, etc. [31–33], as described above. These patients would then be less prone to suffer renal damage over time, resulting in improved renal function compared to that of renal transplant recipients with other genotypes.
The work presented here has several limitations. The sample size available was not large enough to provide numerous carriers of the homozygous variant genotypes, which rendered some wide, though largely significant, confidence intervals for the associations reported. In addition, we collected blood samples in a cross-sectional manner, which means that leptin levels were determined at a different time since grafting in each patient. Not having pretransplant leptin measurements precluded the confirmation of previous reports on the evolution of leptin levels after renal transplant.
In conclusion, leptin is an adipocytokine that allows the organism to adapt to the environment through inflammation and the activation of various metabolic pathways. In the present study, leptin levels showed great variability in renal transplant recipients, and patients with higher values were more prone to complications after grafting. In addition, we observed that genetic polymorphisms in the leptin receptor gene could affect clinical outcomes in these patients, suggesting that the screening of leptin-related genes may be useful to help predict post-transplant adverse events. It would be worth conducting further studies that include larger cohorts of renal transplant recipients and, in particular, unequivocally characterize in vitro the specific biochemical consequences of LEPR polymorphisms.


