Introduction
Glioma is the most commonly diagnosed primary brain malignancy in adults, with poor survival following standard treatment [1, 2]. Although surgery, concurrent radio-chemotherapy and target therapy have greatly advanced glioma patient survival, the tumor resistance and recurrence make glioma become an incurable disease [3]. Thus, it is highly necessary to understand underlying glioma pathogenesis for exploring novel effective therapeutic targets and finding precision diagnostic and prognostic biomarkers.
Noncoding RNAs (ncRNAs) have been broadly explored due to their attributes of an unusual expression model and specific regulation mechanism in different diseases [4, 5]. NcRNAs are closely connected to diverse prospects of neoplasm cell performances [6]. LncRNAs more than 200 nt long are able to tune target gene transcription and translation via binding microRNAs [7, 8]. Hence, sponging microRNAs are dysregulated and then shape cancer advancement.
So far, many lncRNAs have been investigated for their biological and clinical behavior in the pathophysiology of glioma through sponging miRNA [9, 10]. Li et al. reported that lncRNA linc00645 acted as an oncogene to promote glioma migration and invasion through modulating the miR-205-3p-ZEB1 axis [11]. Dong et al. revealed that lncRNA EGFR-AS1 decreased miR-133b and upregulated RACK1 to promote glioma cell metastasis and growth [12]. Recently, the lncRNA TUBA4B has been widely studied in several malignant tumors including gastric cancer, NSCLC, ovarian cancer, and breast cancer [13–16]. However, the function of lncRNA TUBA4B in glioma still remains largely unclear.
In this paper, we report for the first time that lncRNA TUBA4B was markedly decreased in glioma tissues and cells. We found that the patients with low expression of TUBA4B had shorter progression-free survival (PFS) and overall survival (OS) than those with high expression of TUBA4B. Functional analysis indicated that TUBA4B functioned as a miR-183 sponge and could exert its tumor-suppressive impacts via the regulation of SMAD4. Collectively, our study is the first to demonstrate that TUBA4B could act as a tumor suppressor by the TUBA4B/miR-183/SMAD4 axis to regulate glioma development and progression.
Material and methods
Tissue collection
One hundred and sixteen paired clinical cancer tissues and adjoining non-tumor tissues (paired samples were from the same patients) were collected from glioma patients between January 2013 and January 2015 at Sishui Country People’s Hospital, Jining. The histological type of all patients included glioblastoma (n = 96) and astrocytoma (n = 26). All samples were instantly cryopreserved in liquid nitrogen for subsequent research. No systematic therapy, chemotherapy or radiotherapy was performed for any of the patients before surgical resection. Plasma samples from glioma patients (n = 102) and healthy controls (n = 102) were collected to evaluate the diagnostic value of TUBA4B. Informed consent was obtained from the patients or their family and this investigation was authorized by the Ethics Committee of Sishui Country People’s Hospital, Jining.
Cell cultivation and transfection
Six glioma cancer cell lines (U87, U251, LN229, U118, A172, T98), normal human astrocytes (NHAs) and HEK293 cells were obtained from the Cell Bank of Shanghai Institute for Biological Sciences (SIBS), Chinese Academy of Sciences (CAS) (Shanghai, China) and cultivated in RPMI 1640 (Gibco) medium or DMEM (Gibco) supplemented with 10% FBS (Gibco) and 1% penicillin/streptomycin (Life Technologies). HEK293 cells were cultured with MEM (Invitrogen) supplemented with glutamine, 10% heat inactivated horse serum, 1 mM Na pyruvate, and 0.1 mM non-essential amino acids. All cells were cultured in a humidified incubator at 37°C with 5% CO2.
miR-183 mimics (miR-183, GI:28395069; accession number: AY194153.1), miR-183 inhibitor (anti-miR-183) and the negative control (NC) were purchased from Genepharma (Shanghai, China). The full-length sequences of TUBA4B (GI:1241766242; accession number: NM_001355221.1) were ligated into pcDNA3.1 (oe-TUBA4B) as an overexpression plasmid (Genepharma, China). The cloning sites of TUBA4B on vector pcDNA3.1 are BamH I and Xho I. Cell transfection was performed with Lipofectamine 2000 Reagent (Invitrogen) based on the manufacturer’s guide.
RNA extraction and qRT-PCR
TRIzol reagent (Invitrogen) was used to extract the total RNAs from tissues and cells. cDNA was synthesized with the PrimeScript RT Reagent Kit (Takara). RNA quantification was conducted with a Nanodrop Spectrophotometer (Thermo Fisher Scientific). The relative expression of target gene and miRNA was detected by quantitative RT-PCR through SYBR Green PCR Master Mix (Takara) on the 7500 Fast Real-Time PCR System (Thermo Fisher Scientific) according to the manufacturer’s instructions. Reaction conditions of qPRC were at 95°C for 10 min, followed by 40 cycles at 95°C for 10 s, 60°C for 30 s. The relative quantities of lncRNA/mRNA and miRNA were normalized to GAPDH and U6, respectively, and subsequently calculated by the 2–ΔΔCt method. The following primers were used in this study: TUBA4B, forward: 5’-CCCACAGGCTTTAAGGTTGA-3’, reverse 3’-AGGCCATAGTGATGGCTGTC-5’; miR-183: 5’-TATGGCACTGGTAGAATTCACT-3’; GAPDH, forward: 5’-TATGATGATATCAAGAGGGTAGT-3’, reverse, 5’-TG-TATCCAAACTCATTGTCATAC-3’; U6, forward: 5’-CTC-GCTTCGGCAGCACA-3’, reverse, 5’-AACGCTTCACGAATTTGCGT-3’.
Cell MTS assay
Cell proliferation was detected by MTS assay. Briefly, after 24 h transfection, the cells were plated in a 96-well plate at a density of 2000–3000 cells/well. After culturing for the indicated time, 20 μl of MTS was added into each well, and incubated for another 2 h at 37°C. An EnVision multimode plate reader (PerkinElmer) was used to evaluate absorbance at 490 nm.
Soft-agar colony forming assay
The anchorage-independent growth ability of cells was detected by CytoSelect 96-Well Cell Transformation Assay (Standard Soft Agar kit, Cell Biolabs) according to the manufacturer’s protocol. Briefly, 3 × 10³ cells transfected with indicated vectors were plated to a 96-well plate coated with agar matrix and then incubated for another 14 days and the fresh medium was replaced every 3 days, and subsequently, the colonies were lysed and dyed with the Cyquant GR Dye, and analyzed using an EnVision multimode plate reader (Perkin-Elmer).
Detection of cell apoptosis and cell cycle analysis
The ApoAlert DNA Fragmentation Assay Kit was applied to detect apoptotic activity (Clontech) according to the manufacturer’s guide. Briefly, the cells were collected, incubated with Nucleotide Mix, stained with propidium iodide (PI) in 0.5 ml of PI/RNase/PBS (2.5 μg/ml), and detected with flow cytometry (FACSCalibur). For the cell cycle test, cells were digested, washed with PBS, fixed with cold ethanol, incubated with PI (100 ng/ml), and explored by flow cytometry (FACSCalibur).
Migration and invasion assay
A 24-well transwell chamber (8-μm pore size, Costar) with or without Matrigel was applied to assess the migration or invasion based on the manufacturer’s guide. The detailed process was consistent with a previous study [17]. The migrated or invaded cells were fixed with 100% methanol, stained with 0.1% crystal violet, photographed with a microscope (Olympus) and counted with three fields selected at random.
Dual-luciferase reporter assay
MicroRNA.org, miRcode, TargetScan and Starbase V3.0 was used to predict the binding site of target. To verify this prediction, luciferase reporter assay was used. The presumptive miR-183 target binding segment in TUBA4B and the corresponding variant of the binding sequence were cloned and inserted into the pmirGLO Vector (Promega) to produce the TUBA4B-wild-type (WT-TUBA4B) vector and TUBA4B-mutated-type (Mut-TUBA4B). Likewise, the SMAD4-wild-type (WT-SMAD4) and SMAD4-mutated-type (Mut-SMAD4) reporter vectors were produced. Subsequently, mutated or wild type vector and miR-183 or anti-miR-183 were co-transfected into HEK293 cells in 96-well plates with Lipofectamine 2000 (Invitrogen) and then incubated for 24 h. Dual-Luciferase Reporter Assay (Promega) was applied to detect the relative luciferase activity luminescence based on the manufacturer’s guide.
RNA pull down assay
The RNA pull-down assay was used to analyze the binding situation between TUBA4B and miR-183, and SMAD4 and miR-183. Briefly, the commercially synthesized biotinylated TUBA4B or SMAD4 probe (Bio-TUBA4B-probe, Bio-SMAD4-probe) or the negative control probes (Bio-NC-probe) were purchased from GenePharma. The cell lysates were incubated with Dynabeads M-280 Streptavidin (Invitrogen) and different biotin-labeled probes according to the guide. Finally, the binding miRNA was eluted and analyzed through qRT-PCR with SYBR Green PCR Master Mix (Takara) on the 7500 Fast Real-Time PCR System (Thermo Fisher Scientific).
RNA immunoprecipitation (RIP)
Glioma cells were lysed, and then nurtured with RIP buffer supplemented with magnetic beads binding with human anti-Argonaute2 (Ago2) antibody (CST), and negative control normal mouse IgG (CST). Subsequently, the obtained immunoprecipitated RNA was extracted. A NanoDrop (Thermo Scientific) was used to measure the RNA concentration and a bio-analyzer (Thermo Scientific) was applied to evaluate the RNA quality. Finally, qRT-PCR analysis was applied to detect RNA to validate the presence of the binding targets through SYBR Green PCR Master Mix (Takara) on the 7500 Fast Real-Time PCR System (Thermo Fisher Scientific).
Western blot analysis
The detailed procedures were as previously described [18]. Briefly, the total protein was separated from cells with RIPA lysis buffer. Lysed protein was quantified with a Pierce BCA Protein Assay Kit (Thermo Scientific), then sequestered by 10% SDS-PAGE, transferred to PVDF membranes, blocked with 5% BSA and probed with the following primary antibodies: GAPDH antibody (1 : 2000 dilution, Rabbit mAb #5174); SMAD4 antibody (1 : 1000 dilution, Rabbit mAb #38454). Then, the membrane was incubated with a horseradish peroxidase-conjugated secondary antibody at room temperature for 2 h. A chemiluminescence detection system (Thermo Scientific) was used to measure the protein bands.
Statistical analysis
All statistical analyses were performed with SPSS Version 22.0 (SPSS, Chicago, USA) and GraphPad Prism 7 (La Jolla, CA, USA). The obtained data were expressed as the mean ± standard deviation (SD) and all assays were repeated three times. The difference between two-group comparisons was tested by two-sided Student’s t-test. The one-way analysis of variance (ANOVA) test was applied to multiple group comparisons. The Kaplan-Meier method and log-rank test were used to evaluate the PFS and OS. Pearson’s correlation analysis was used for analysis of correlations. The receiver operating characteristic (ROC) curve was performed to evaluate the potential diagnostic value. Differences with p < 0.05 or < 0.01 were regarded as statistically significant.
Results
LncRNA TUBA4B expression was downregulated in glioma and associated with poor prognosis of glioma patients
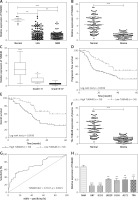
By using microarray analysis (TCGA), we observed that TUBA4B was significantly downregulated in low-grade glioma (LGG) or glioblastoma multiforme (GBM) tissue compared to that in normal tissue (Figure 1 A). Next, the levels of TUBA4B were analyzed in 116 paired glioma tissues and corresponding adjacent non-cancer tissues by qRT-PCR assay. Consistently, as shown in Figure 1 B, TUBA4B was significantly lower in glioma samples than that in adjacent normal brain tissues. Further, the lower level of TUBA4B was closely related to the advanced stages of glioma (Figure 1 C). In addition, the survival curve was plotted and indicated that the PFS and OS of patients with a low level of TUBA4B were shorter than those of patients with a high level of TUBA4B (Figures 1 D, E). We further found that serum levels of TUBA4B were notably lower in glioma compared to healthy controls (Figure 1 F) and then we established the receiver operating characteristic curve suggesting that plasma lncRNA TUBA4B could be a potential diagnostic biomarker (Figure 1 G). Finally, we identified that TUBA4B was dramatically reduced in glioma cells compared with normal human astrocytes (NHA) (Figure 1 H).
Figure 1
TUBA4B was down-regulated in glioma and associated with poor survival. A – LncRNA TUBA4B expression in LGG, GBM and normal tissues from TCGA dataset. Normal (n = 5), normal brain tissues; LGG (n = 511), low-grade glioma; GBM (n = 156), glioblastoma multiforme. B – The expression of lncRNA TUBA4B in glioma tissues and normal brain tissues was detected by qRT-PCR. ***P < 0.001. C – TUBA4B expression levels in different glioma stages were analyzed by qRT-PCR. D – Patients with low TUBA4B expression showed decreased PFS compared to patients with high TUBA4B expression (log-rank test, p = 0.0034). E – Patients with low TUBA4B expression showed reduced OS compared to patients with high TUBA4B expression (log-rank test, p = 0.0030). F – Serum levels of lncRNA TUBA4B in patients with glioma and healthy controls. Compared with healthy controls, serum levels of lncRNA TUBA4B were significantly decreased in glioma patients. ***P < 0.001. G – A receiver operating characteristic curve (ROC) analysis indicated that altered expression of plasma lncRNA TUBA4B separated patients with glioma from healthy controls. H – The expression of TUBA4B in glioma cells (U87, U251, LN229, U118, A172, T98) and normal human astrocytes (NHA) cells was detected by qRT-PCR
All experiments were performed independently in triplicate. Error bars represent ± SD. Statistical significance level, **P < 0.01; ***p < 0.001.
Overexpression of lncRNA TUBA4B impaired cell growth, migration and invasion in glioma cells in vitro
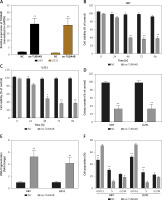
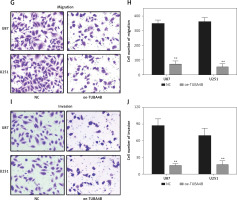
As shown in Figure 1 H, we selected U87 and U251 cell lines with the lowest expression of TUBA4B among all glioma cell lines to perform the following gain-of-function assays. The overexpression efficiencies of TUBA4B were tested by qRT-PCR (Figure 2 A). MTS assays clarified that overexpression of TUBA4B markedly blocked glioma proliferation (Figures 2 B, C). Furthermore, overexpression of TUBA4B significantly weakened the colony formation of glioma cells by 3D colony formation assay (Figure 2 D). Additionally, DNA Ladder assay showed that overexpression of TUBA4B could obviously promote cell apoptosis by increasing the DNA fragments in glioma cells (Figure 2 E). Also, cell cycle analysis implied that overexpression of TUBA4B strongly arrested cell cycle at G0/G1 stage in glioma cells (Figure 2 F). Finally, transwell experiments indicated that overexpression of TUBA4B potently inhibited glioma cell migration and invasion (Figures 2 G–J).
Figure 2
Overexpression of TUBA4B inhibited glioma cell growth, migration, and invasion in vitro. A – lncRNA TUBA4B expression levels were verified by qRT-PCR in glioma cells transfected oe-TUBA4B or NC (negative control). B, C – Overexpression of TUBA4B significantly inhibited the proliferation of glioma cells by MTS assay. D – Overexpression of TUBA4B significantly prohibited the colony formation of glioma cells by 3D colony formation assay. E – Overexpression of TUBA4B dramatically promoted cell apoptosis by DNA Ladder assay kit. F – Overexpression of TUBA4B significantly arrested cell cycle at G0/G1 stage by flow cytometry in glioma cells. G–J – Overexpression of TUBA4B markedly decreased migration and invasion of glioma cells by transwell assay
All experiments were performed independently in triplicate. Error bars represent ± SD. Statistical significance level,*p < 0.05, **p < 0.01.
MiR-183 and lncRNA TUBA4B were negatively correlated
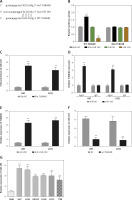
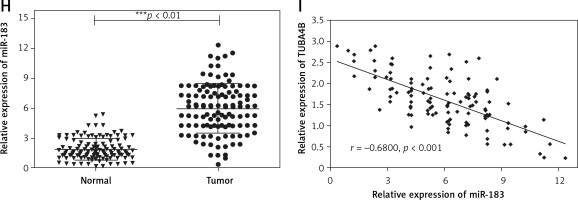
MicroRNA.org and the miRcode database revealed that miR-183 had complementary binding sites with TUBA4B as displayed in Figure 3 A. Next, the dual-luciferase reporter assay showed that the relative luciferase activity of the WT-TUBA4B was outstandingly lower when miR-183 was overexpressed and higher when miR-183 was down-expressed, yet not identified in that of Mut-TUBA4B (Figure 3 B). Then, the biotin-labeled pull-down system showed that enrichment of miR-183 was exceptionally enlarged by pull-down of biotinylated TUBA4B (Figure 3 C). On the other hand, we performed anti-Ago2 RIP assay to further confirm the straight binding between miR-183 and TUBA4B at endogenous levels in U87 and U251 cells transiently overexpressing miR-183. Compared with the control group, the endogenous TUBA4B was specifically enriched in the cells of the miR-183 transfected group (Figure 3 D), further demonstrating that TUBA4B directly targeted miR-183. Moreover, the down-regulation of miR-183 strikingly promoted the levels of TUBA4B in glioma cells (Figure 3 E), while overexpressed TUBA4B markedly diminished the miR-183 expression (Figure 3 F). Meanwhile, we assessed the levels of miR-183 in glioma cells and tissues, and the results showed that miR-183 was significantly upregulated (Figures 3 G, H), suggesting that there was an inverse correlation between TUBA4B and miR-183. Finally, Pearson’s correlation analysis further revealed that TUBA4B possessed an inverse association with miR-183 in glioma samples (Figure 3 I).
Figure 3
TUBA4B directly bound to miR-183. A – miR-183 binding sites in TUBA4B were predicted through bioinformatics analysis. B – Relative luciferase activity was detected to examine the binding of TUBA4B and miR-183 by dual-luciferase reporter assay. C – Biotinylated pull-down assay was used to detect the interaction between TUBA4B and miR-183. D – The RNA immunoprecipitation assay was used to verify the interaction between TUBA4B and miR-183. E – MiR-183 inhibitor could decrease relative expression of TUBA4B by qRT-PCR in glioma cells. F – Overexpressed TUBA4B could reduce the relative expression of miR-183 by qRT-PCR in glioma cells. G – Relative expression of miR-183 in glioma cell lines by qRT-PCR. H – Relative expression of miR-183 in the paired glioma tissues and adjacent normal tissues from 116 patients by qRT-PCR. I – Pearson correlation analysis showed the significant negative relationship between miR-183 and TUBA4B expression in glioma tissues
All experiments were performed independently in triplicate. Error bars represent ± SD. Statistical significance level, *p < 0.05, **p < 0.01.
SMAD4 was modulated by miR-183 in glioma cells
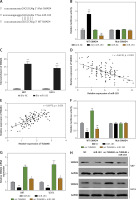
Two bioinformatics analysis tools, i.e. Starbase V3.0 and TargetScan, predicted that miR-183 possessed the matched binding site with SMAD4 (Figure 4 A). As presented in Figure 4 B, the relative luciferase activity in Wt-SMAD4 and miR-183 mimics (miR-183) cotransfected HEK293 cells was dramatically decreased whereas the luciferase activity was significantly augmented in Wt-SMAD4 and miR-183 inhibitor (anti-miR-183) cotransfected HEK293 cells, but we did not observe that miR-183 or anti-miR-183 had an effect on the Mut-SMAD4. Furthermore, biotinylated pull-down assay indicated that SMAD4 was dramatically pulled down by biotin-labeled miR-183 (Figure 4 C), suggesting that the identification of miR-183 to SMAD4 is in a sequence-specific mode. We similarly found that the upregulation of miR-183 could inhibit the levels of SMAD4 (Figures 4 G, H). The Pearson’s correlation analysis further revealed that there was an inverse relationship between SMAD4 and miR-183 in glioma tissues (Figure 4 D). Interestingly, we observed that TUBA4B was positively associated with SMAD4 by Pearson’s correlation analysis (Figure 4 E), suggesting that TUBA4B might competitively attenuate the binding of miR-183 to SMAD4. Luciferase reporter assays demonstrated that the overexpression of TUBA4B could counteract the suppressive effect of miR-183 on SMAD4 3’-UTR activity (Figure 4 F). Subsequently, we found that overexpression of TUBA4B significantly increased mRNA and protein levels of SMAD4 and miR-183 inhibited the promoting effect of TUBA4B on the expression of SMAD4 (Figures 4 G, H).
Figure 4
SMAD4 was regulated by miR-183 and TUBA4B. A – The 3’-UTR of SMAD4 contained the miR-183 binding site. B – The luciferase activity was determined by dual-luciferase report assay in HEK-293 cells transfected with the indicated vector. C – Biotinylated pull-down assay was used to confirm the interaction between miR-183 and SMAD4. D – The strong negative association between miR-183 and SMAD4 expression in glioma tissues by Pearson’s correlation analysis. E – The strong positive relationship between TUBA4B and SMAD4 by Pearson’s correlation analysis. F – Luciferase activity was measured in HEK-293 cells co-transfected with indicated vector. **P < 0.01, compared to NC. ##P < 0.01, compared to oe-TUBA4B. G – Relative expression of SMAD4 mRNA was determined in glioma cells transfected with oe-TUBA4B or oe-TUBA4B + miR-183 by qRT-PCR. **P < 0.01 compared to miR-NC; #p< 0.05, compared to oe-TUBA4B. H – The protein level of SMAD4 was measured in glioma cells transfected with oe-TUBA4B or oe-TUBA4B + miR-183 by western blotting
All experiments were performed independently in triplicate. Error bars represent ± SD. Statistical significance level, *p < 0.05, **p < 0.01.
Restoration of SMAD4 impaired suppressive roles of TUBA4B overexpression
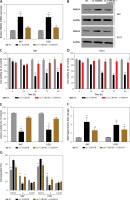
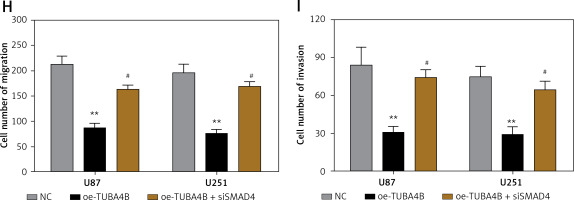
To demonstrate the vital roles of SMAD4 in TUBA4B-mediated growth and aggressiveness of glioma cells, we silenced SMAD4 in TUBA4B-over-expressed glioma cells. QRT-PCR and western blotting analysis demonstrated that SMAD4 levels were particularly restored in TUBA4B-overexpressed glioma cells (Figures 5 A, B). Then we performed a series of biological functional assays to further clarify the role. The results showed that down-expression of SMAD4 counteracted the prohibitory effects of TUBA4B on the proliferation, colony formation, cell cycle, migration and invasion of glioma cells and the stimulatory effects on cell apoptosis in vitro (Figures 5 C–I).
Figure 5
Knockdown of SMAD4 neutralized the suppressive effect of TUBA4B on glioma cells. A, B – Glioma cells transfected with oe-TUBA4B or oe-TUBA4B combination with siSMAD4, and the level of SMAD4 was detected by qRT-PCR and Western blot. C, D – MTS assays indicated that knockdown of SMAD4 could significantly reverse the inhibitory effects of TUBA4B overexpression on proliferation of glioma cells. E – Knockdown of SMAD4 partly restored the ability of colony formation in TUBA4B overexpressing glioma cells. F – Knockdown of SMAD4 partially inhibited the promotion of apoptosis in TUBA4B-overexpressing glioma cells. G – Knockdown of SMAD4 partially restrained the arrest of the cell cycle in TUBA4B-overexpressing glioma cells. H, I – Knockdown of SMAD4 partially reversed the inhibitory effects of TUBA4B on migration and invasion of glioma cells
All experiments were performed independently in triplicate. Error bars represent ± SD. Statistical significance level, *p < 0.05, **p < 0.01, compared with NC group; #p < 0.05, ##p < 0.01, compared with oe-TUBA4B.
Discussion
Recently, a variety of lncRNAs have been proved to possess governing capacity in tumor progression, signifying the critical role in the pathophysiology of multiple tumors. For instance, long non-coding RNA FOXF1 adjacent non-coding developmental regulatory RNA inhibits growth and chemotherapy resistance in non-small cell lung cancer [19]. LncRNA myocardial infarction-associated transcript promotes cell proliferation and inhibits cell apoptosis by targeting miR-330-5p in epithelial ovarian cancer cells [20]. Also, long non-coding RNA PCAT-1 promotes tumor progression by inhibiting miR-129-5p in human ovarian cancer [21]. Therefore, further examination of novel lncRNAs in the development and progression of glioma should be necessary and could furnish us with a better approach for glioma treatment.
TUBA4B was first identified through microarray in clinical non-small cell lung cancer samples by Wang et al., showing that the abnormal expression of TUBA4B may play a crucial role in the tumorigenesis of lung cancer [22]. Then, Chen et al. reported that downregulated lncRNA TUBA4B inhibited cell viability in A549 and NCI-H1299 cell lines [16]. Next, Zhu et al. observed that TUBA4B was downregulated in ovarian cancer and enforced expression of lncRNA-TUBA4B could reduce the ovarian cancer proliferation through the suppression of ERK and PI3K/AKT signaling pathways [15]. In addition, Guo et al. showed that lncRNA TUBA4B sponged miR-214 and miR-216a/b to arrest gastric cancer growth and metastasis by inhibition of the PI3K/AKT signaling pathway [13]. Further, Liu et al. also demonstrated that TUBA4B was decreased in breast cancer and suppressed growth and migration of breast cancer via targeting miR-19 [14]. Consistently, our study first discovered the down-regulation of TUBA4B using bioinformatics website analysis, which was further validated in our clinical specimens. More importantly, overexpression of TUBA4B inhibited glioma cell viability, inhibited the cell cycle, promoted cell apoptosis and suppressed migration and invasion in glioma cells. Collectively, all the above suggested the tumor-suppressive role of TUBA4B in glioma.
The functional mechanisms for lncRNAs serving as competing endogenous RNAs (ceRNAs) for miRNAs have been explored in numerous reports [23]. In this study, we forecasted that miR-183 could act as a target of TUBA4B using an online bioinformatics algorithm, where the interplay between miR-183 and TUBA4B was confirmed by luciferase reporter assay, biotin-labeled pull-down assay and RNA immunoprecipitation assay. The dysregulation of miR-183 has been found in several cancers including colon cancer, pancreatic cancer, lung cancer, and glioma. In glioma, miR-183 commonly acted as an oncogene. For example, miR-183 promoted glioma cell growth and progression via downregulating the expression of NEFL [24]. MiR-183 negatively regulated the expression of IDH2 and upregulated the expression of VEGF and GLUT1 by inducing HIF-1α expression to modulate the glioma cell proliferation and invasion [25]. MiR-183 promoted glioblastoma radio-resistance via down-regulating LRIG1 [26]. In this study, consistently, we identified that miR-183 was upregulated in glioma cells and tissues. In addition, we discovered that miR-183 was inversely regulated by TUBA4B. All in all, our data suggested that TUBA4B regulated glioma progression via sponging miR-183.
Furthermore, we identified SMAD4 as the downstream target of miR-183 by bioinformatics analysis, which was confirmed by luciferase reporter assay and biotin-labeled pull-down assay. More importantly, SMAD4 was inversely regulated by miR-183 in glioma. The role of SMAD4 has been deciphered in several types of cancers including glioma [27]. Our study showed that miR-183 targeted SMAD4 and suppressed its expression, whereas TUBA4B sponged miR-183 to promote SMAD4 expression in glioma cells. Moreover, our rescue experiments showed that inhibition of SMAD4 abrogated the suppressive effects of TUBA4B overexpression on the biological function of glioma cells. Consistently, miR-183 was up-regulated and SMAD4 was down-regulated in glioma tissues. Collectively, these results may indicate the involvement of miR-1833p/SMAD4 in the TUBA4B mediated effects.
In conclusion, the present study identified the down-regulation of TUBA4B in glioma tissues and cell lines, and the in vitro results implied that TUBA4B inhibited glioma progression via targeting the miR-183/SMAD4 axis. Our data suggested that the TUBA4B/miR-183/SMAD4 axis may be a promising therapeutic target for glioma treatment.


