Introduction
Idiopathic membranous nephropathy (IMN) is the most common cause of adult nephrotic syndrome. Approximately 25% to 40% of adult primary nephrotic syndrome cases have IMN. Idiopathic membranous nephropathy is also the most common pathologic type of glomerular disease, and IMN has a longer disease course. The prognosis of IMN varies [1]. The pathologic features of IMN are a high number of immune complexes deposited in the glomerular basement membrane on the epithelium side.
The exosome has a double layer plasma membrane structure. Its diameter is approximately 30–100 nm, and it carries a rich protein, mRNA and microRNA. Exosomes are released to the extracellular microenvironment by the cells [2, 3]. They can be released from fibroblasts, dendritic cells, tumor cells and other cells; they are widespread in the urine [4], peripheral blood, saliva, cerebrospinal fluid, amniotic fluid, ascites and other body fluids [3, 5]. Therefore, we can detect exosomes and their contents from tissue, cells and body fluids to diagnose and clinically treat the disease, especially kidney disease. Miranda et al. [6] observed exosomes of renal tubular epithelial cells, podocytes, collecting duct cells and leap cells by transmission electron microscopy, which showed that almost all kidney inherent cells could secrete exosomes. In addition, the authors found that the components of exosomes were different in normal physiological conditions and disease conditions even for the same tissue or body fluid [7]. Previous studies have shown that the contents of exosomes have a characteristic change in acute kidney injury [8], IgA nephropathy [9], diabetic nephropathy [10], renal tubular acidosis [6], polycystic kidney [11] and other kidney diseases. The findings suggested that exosomes can be used as specific markers for early disease diagnosis.
Recent studies have shown that circRNAs can be used as biomarkers for the diagnosis and efficacy of a variety of clinical diseases, such as atherosclerosis [12], neurological diseases [13–15], diabetes [16], tumors [17–19] and more. In addition, because of the high stability of the circRNAs and the difficulty of degrading them by exonuclease, we can easily obtain circRNA from body fluid [12]. Based on the above characteristics, circRNAs show great potential to regulate human disease genes [20], making them a current research focus. In 2005, Huang found many exosomes in human serum and discovered that there is a difference in the exo-circRNA between colorectal cancer and normal human serum [21]. The authors speculated that circRNAs could be used as a new biomarker for cancer diagnosis. This discovery renewed people’s awareness of circRNAs and exosomes because the authors had linked two emerging areas and further demonstrated the importance of circRNA and exosomes in organisms [21].
In this study, we evaluated circRNAs of exosomes. We compared the expression of circRNAs in the exosomes of serum and urine in patients with idiopathic membranous nephropathy and normal healthy controls by gene sequencing. Then, we screened out the differential expression of circRNAs and performed further analysis. The rich data from the analysis provide insight into the pathogenesis of IMN and a solution for future diagnosis and treatment.
Material and methods
Patient assessments and classifications
The study protocols and consent forms were approved by the Second Clinical Medical College (Shenzhen People’s Hospital) of Jinan University and adhere to the Helsinki Declaration guidelines on ethical principles for medical research involving human subjects. Written informed consent was obtained from all participants. Ten IMN patients who had never been treated with glucocorticoids or other immunosuppressive drugs were recruited for this study. In addition, we chose 10 healthy subjects as controls (Table I).
Inclusion and exclusion criteria
The inclusion criteria were as follows: IMN patients were hospitalized at Shenzhen People’s Hospital nephrology department from November 2015 to October 2016. Renal biopsy confirmed that their pathological type was idiopathic membranous nephropathy and their kidney function was normal before and after admission.
The exclusion criteria were as follows: 1) patients with abnormal renal function based on increased urea nitrogen or creatinine; 2) secondary nephrotic syndrome patients, such as those with hypertensive nephropathy, diabetic nephropathy, lupus nephritis, and hepatitis-related nephritis; and 3) renal pathology results confirming membranous nephropathy, but the patient has co-occurrence of another disease that can cause renal damage, such as hypertension, diabetes, systemic lupus erythematosus, hepatitis B and others.
Collection of serum and urine specimens:
All patients met the inclusion criteria and they were prohibited from eating or drinking the night before specimens were collected.
Venous blood was collected the next morning from elbow vein blood and then kept at 37°C to promote coagulation.
Samples were centrifuged for approximately 10 min at 3000 rpm.
Approximately 2–3 ml of the upper layer of liquid was absorbed into the EP tube, which was marked with identification information (date, number, etc.) and then stored at –80°C.
At the same time, the patient’s first morning urine (approximately 100 ml) was collected into a centrifuge tube, which was marked with identifying information (date, number, etc.) and then stored at –80°C.
Exosome isolation
Exosomes were isolated by the polymer formulation method [22] from blood serum using an ExoQuick reagent precipitation kit (System Biosciences, SBI, Mountain View, CA) according to the manufacturer’s protocol. This exosome isolation method has been well validated with other techniques, including electron microscopy [22, 23]. All exosomes were stored at –80°C immediately after isolation until further analysis. The total protein concentration of the isolated exosomes was determined using the standard Bradford protein assay (Bio-Rad, Richmond, VA, USA).
Isolation of RNA from exosomes
Exosome supernatants were added to 40 pM synthetic cel-miR-39 (UCACCGGGUGUAAAUCAGCUUG) to control and normalize the efficiency of RNA extraction; then, they were transferred to RNase-free tubes for RNA isolation using an miRNeasy Mini Kit (Qiagen, Valencia, CA, USA) according to the manufacturer’s protocol. The RNA sample was washed twice in 500 µl of RPE buffer and eluted in RNase-free water. The isolated RNA was measured using a NanoDrop 1000 ultraviolet spectrophotometer (Thermo Fisher Scientific) and analyzed by reverse transcription polymerase chain reaction (RT-PCR) followed by quantitative PCR (qPCR).
Serum and urine exosome circRNA sequencing
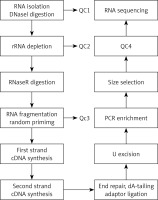
The total RNA was extracted and then was digested with DNase I to remove rRNA; then, RNase R was used to remove the linear RNA, enriching the circRNAs. The circRNAs were fragmented, and the first strand cDNA was synthesized by reverse transcription using random primers. Then, the second strand cDNA was synthesized using dNTP containing dUTP. The secondary chain product was subjected to terminal repair, and was pulsed “A” and a linker. The reaction mixture was digested with USER enzyme to remove the second strand cDNA containing dUTP, and a primer was added to amplify via PCR and obtain a chain-specific cDNA library. The fragments were screened by magnetic beads. Quality control was performed and fragments were further sequenced on a machine. The experimental procedure is summarized in Figure 1.
Figure 1
The main experimental process of circular RNA gene sequencing. QC1: detection of the total RNA concentration, purity, completeness; QC2: confirmed that more than 99% of the rRNA had been removed; QC3: confirmed that RNA was fragmented into approximately 200-bp fragments; QC4: detected the fragment concentration and size and library concentration. The distribution of the significantly differentially expressed miRNA of cells in the cellular component with high throughput sequencing
Bioinformatics analysis
The expression values calculated for the differential proteins and peptides were used for the distance and average to determine the linkage for gene ontology (GO) analysis. In pathway analysis, interactions between genes in the range of genomes were analyzed by downloading the pathway data in KEGG. Finally, the results of the above data were merged into a comprehensive gene inter-relationship network. The established gene network could directly reflect the inter-relationships between genes at a whole-cell level as well as the stability of the gene regulatory network.
Statistical analysis
The back-spliced junction reads and linear mapped reads were combined and scaled to reads per million mapped reads (RPM) to quantify circRNA expression levels. Differences in circRNA expression levels were analyzed using Student’s t-test. P < 0.05 was considered statistically significant.
Results
Total RNA quality and concentration determination results
RNA was extracted and purified using an RNA isolation kit. The total RNA of the IMN and NC groups was detected with a Qubit3.0 fluorescence meter. The results are shown in Tables II and III. In the tables, the total amount of exosome RNA measured in each group was more than 200 ng, and the obtained circRNAs had high purity and good integrity, and could be used for later experiments.
Types of circRNAs
Compared with the healthy control group, the types of circRNAs in the serum of the patients with idiopathic membranous nephropathy decreased and mainly appeared as intron region sources. However, the circRNAs in the urinary exosomes increased, and mainly appeared to have an exon region source (Table IV).
Table IV
Species of exosome circRNA
Difference analysis of circRNAs
According to the expression level of circRNAs, when the difference multiple (ratio) was more than 2 or less than 0.5 and FDR ≤ 0.001, the circRNAs were considered differentiated. In this study, the log2 ratio was used instead of multiple differences. The filter criteria of significantly differentially expressed genes were FDR ≤ 0.001 and |log2 ratio| ≥ 1.
Differential expression of circRNAs in serum and urine exosomes of IMN patients
According to the experimental results, there were 59 species of circRNA with significantly different expression compared to serum and urine exosomes in IMN patients; 32 species were up-regulated (Table V) and 27 species were down-regulated (Table VI). Most of these circRNAs had an intron source. The corresponding genes were mainly SNORA25, SNORA31, SNORA51, SNORA75 and other nucleolus small RNAs. The log2 ratio of chrY: 13688616|13833086 was 27.592 in the up-regulation circRNA, which was the most significant. The log2 ratio of chrY:13842647|13855594 was –26.379 in the down-regulation circRNA, which was the most significant. However, the two most significantly different circRNAs in the circBase gene pool had no corresponding gene, suggesting that they may be newly discovered genes.
Table V
Up-regulated circRNAs between the IMN serum and IMN urine
Table VI
Down-regulated circRNAs between the IMN serum and IMN urine
Differential expression of circRNAs in serum exosomes of IMN and NC patients
According to the experimental results, there were 89 species of circRNAs with significantly different expression compared to IMN patients’ serum exosomes and NC patients’ serum exosomes; 49 species were up-regulated (Table VII) and 40 species were down-regulated (Table VIII). Most of these circRNAs had an intron source. The corresponding genes were mainly SNORA25, SNORA51, SNORA31, SNORA75, SNORD112 and other nucleolus small RNAs. The log2 ratio of chrY:13688616|13833086 was 27.592 in the up-regulation circRNAs, which was the most significant. However, the circRNAs in the circBase gene pool had no corresponding gene, which suggested that it may be a newly discovered gene. The log2 ratio of chr2:233244474|233272478 was –27.111 in the down-regulation circRNAs, which was the most significant, and the corresponding gene is the snoU13 gene. This gene is mainly expressed nucleolus small RNA and plays a role in RNA treatment and modification.
Table VII
Up-regulated circRNAs between the IMN and NC groups in serum
Table VIII
Down-regulated circRNA between the IMN and NC groups in serum
Differential expression of circRNAs in urine exosomes of IMN and NC patients
According to the experimental results, there were 60 species of circRNAs with significantly different expression compared to IMN patients’ urine exosomes and NC patients’ urine exosomes; 54 species were up-regulated (Table IX) and 6 species were down-regulated (Table X). Approximately 55% were intron sources, 30% were exon sources and 15% were intergenic regions. The corresponding genes were mainly SNORA51, SNORA31, SNORA70, SNORA75, SNORD112 and other nucleolus small RNAs. The log2 ratio of chrY:13842647|13855594 was 26.379 in the up-regulated circRNA, which was the most significant. The log2 ratio of chrY:13688616|13833086 was –25.049 in the down-regulated circRNAs, which was the most significant. However, the two most significantly different circRNAs in the circBase gene pool had no corresponding gene, suggesting that they may be newly discovered genes.
Table IX
Up-regulated circRNAs between the IMN and NC groups in urine
Table X
Down-regulated circRNAs between the IMN and NC groups in urine
Bioinformatics analysis
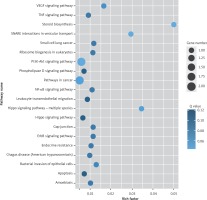
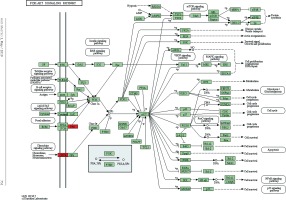
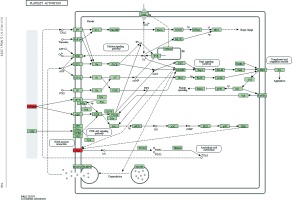
Target genes were analyzed for their potential functions using GO and KEGG pathways. GO analysis demonstrated that the target genes were associated with cellular processes, multicellular organisms, pigmentation, the development process and the response to stimuli at both serum and urine exosomes (Figures 2 and 3). Furthermore, significantly associated pathways comprising the target genes were obtained for the assessed circRNAs. Interestingly, we selected 29 metabolic pathways in the serum sample; of all 29 pathways, 21 had PLA abnormalities, and the corresponding gene was PLA2G4B. The top 20 signaling pathways are shown in Figure 4, while the platelet activation signaling pathway was the most widely distributed (Figure 5). In addition, we selected 35 metabolic pathways in the urine samples. The top 20 are shown in Figure 6, while the P13K-Akt signaling pathway was the most widely distributed (Figure 7).
Figure 2
GO annotation of differentially expressed circRNAs in the serum exosomes of IMN patients compared to the control group. GO annotation consisted of the biological process, cellular components, and molecular function
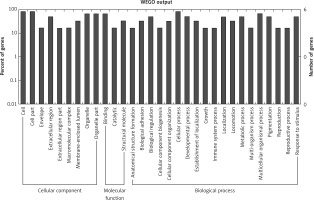
Figure 3
GO annotation of differentially expressed circRNAs in urine exosomes of IMN patients compared to the control group. GO annotation consisted of the biological process, cellular component, and molecular function
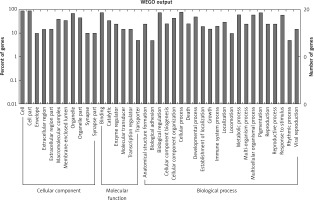
Figure 4
KEGG pathway analysis of predicted targets for differentially expressed circRNAs in serum exosomes of IMN patients compared to the control group. The bluer the circle, the more significant the pathway enrichment. The bigger the circle, the higher the number of pathway genes
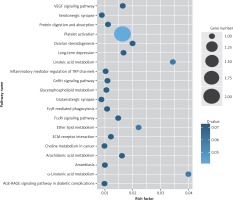
Figure 5
Pathway analysis of differential genes: platelet activation. Red marks indicate the genes with differential profiles
Discussion
Beck et al. [24] detected anti-PLA2R antibodies for the first time in IMN patient plasma samples. Substantial clinical data showed its specificity of up to 100% and sensitivity of approximately 70% to 80%, which indicated that they can be used as IMN-specific diagnostic markers.
The latest study [24, 25] showed that the mannose-binding lectin pathway was the major complement activation in the pathogenesis of IMN. In this study, the mucin 3A (MUC3A) gene, corresponding to the circRNAs of chromosome 7 encoding chr7: 100550808|100551062 in the serum exosomes of IMN patients, was significantly up-regulated. It was also found that MUC3A was encoded by an exon-derived gene. Existing studies have shown that [26] MUC3A is a mucin cluster located on the 7p22 chromosome. Additionally, MUC3A belongs to a transmembrane glycoprotein. Authors [27] found that 71% of the amino acid repeated sequences encoded by MUC3 were serine/threonine and 6% proline. Studies have demonstrated that the activation of serine proteases is achieved by a change in specific amino acid residues in the center of serine-dominated activity [28]. Because most of the amino acids encoded by the MUC3A gene in this study were serine/threonine, we speculate that the MUC3A gene may encode the relevant amino acids and then play an important role in the pathogenesis of IMN through the mannose-binding lectin pathway. Previous evidence suggests that PLA2R-IgG4 can play a role by activating the complement lectin pathway with MBL [29]. The serine of the MUC3A gene also plays a role in the lectin binding pathway. Therefore, we further speculated that the MUC3A gene may be associated with IgG4 and anti-PLA2R antibody expression. There were some relationships in the diagnosis and prognosis of IMN. In addition, it was reported [30] that MUC3A is a class of membrane-associated mucins, which can mediate some of the particles and related pathogens adhering to the mucosal surface. Additionally, MUC3A is involved in binding of the receptor and ligand and signal transduction pathways. MUC3A can mediate the adhesion of the relevant particles to the membrane surface and participate in the receptor ligand binding process, suggesting that MUC3A may also play a role in the formation of immune complexes.
In addition, in this experiment, the genes for which we observed a significant difference in the circRNAs are mainly intron-derived circRNAs. The corresponding genes are SNORA25, SNORA31, SNORA70, SNORA75, SNORD112 and other small nucleolar RNAs (snoRNAs). An increasing number of studies have shown that snoRNAs can be further processed to form shorter RNA fragments, and these short fragments of snoRNAs have microRNA-like functions. This finding suggested that snoRNAs may act as microRNA precursors [31]. One study [32, 33] showed that circRNAs of different gene sources exist in different parts of the cell and the function is also different. The corresponding genes of circRNAs that we obtained in this experiment were mainly the intron source for coding snoRNAs. Therefore, we speculate that in the pathogenesis of IMN at the gene level, the circRNAs of the intron source may code snoRNAs that modify the mRNA during and before transcription as well as regulating the gene expression at the mRNA level.
Studies have shown that alleles-PLA2R1 and HLA-DQA1 are closely related to IMN [34]. In this study, we selected 29 metabolic pathways in the serum sample; 21 had PLA abnormalities. IMN does not appear to occur through a specific signaling pathway; instead, several pathways appear to work at the same time. Additionally, the corresponding gene of PLA was PLA2G4B, which corresponds to PLA2R positivity in IMN patients. IMN may be associated with the PLA2G4B gene. Therefore, evaluation of PLA2G4B may provide new clues for the diagnosis and treatment of IMN.
In conclusion, we found that there were abnormal expression levels of circRNAs in serum and urine exosomes in IMN patients. These circRNAs with abnormal expression could be involved in IMN pathogenesis. However, the specific mechanism and function of the circRNAs with differential expression in the disease require more direct evidence. However, with the continuous development of biological technology and continuous research on circRNAs, circRNAs will eventually provide a new theoretical basis in the disease diagnosis, treatment and prognosis. Additionally, the study of PLA2G4B may provide new clues for the diagnosis and treatment of IMN.


