Introduction
Liver cancer is one of the most common tumors worldwide, and the numbers of new cases and related deaths from liver cancer were ranked in sixth and third place respectively [1] among all malignant tumors. Data show that from 1990 to 2017, the incidence and mortality of liver cancer [2, 3] in China increased with the increase of age. With the aggravation of China’s aging society, the disease burden of liver cancer may continue to grow. Patients with liver cancer usually face colossal physical [4], psychological [5], and social burdens [6] and have greater demand and expectation for burden relief in all aspects. Several studies have shown that patients often harbor inappropriate expectations [7–9] for specific treatment modalities. In addition to affecting patient psychological status, patient treatment is expected to affect patient treatment compliance, satisfaction, and even the effect of therapy [9–12]. Moreover, multiple studies have shown that the [13] positive expectation of cure and accurate cognition of prognosis [1–16] may help improve the quality of life of cancer patients. Therefore, it is essential to understand the current status of patient treatment expectations.
Most of the scales for cancer patients are not scientifically validated questionnaires or those intended as a dimension of the scale [8, 17–19]. In addition, although some foreign scholars have developed a universal treatment expectation scale, the self-efficacy expectation based on the interaction with outcome expectations will be vastly different [20, 21] according to the specific task and environment; we believe that a more targeted expectation scale can more accurately measure patient treatment expectations. To accurately measure the treatment expectations of liver cancer patients, help medical staff understand their expected status quo, and give targeted guidance to relieve the burden of patients in all aspects and improve their quality of life, we developed a Treatment Expectation Scale for hepatocellular carcinoma (HCC) patients and tested its reliability and validity to provide tools for the expected normalized measurement in HCC patients.
Material and methods
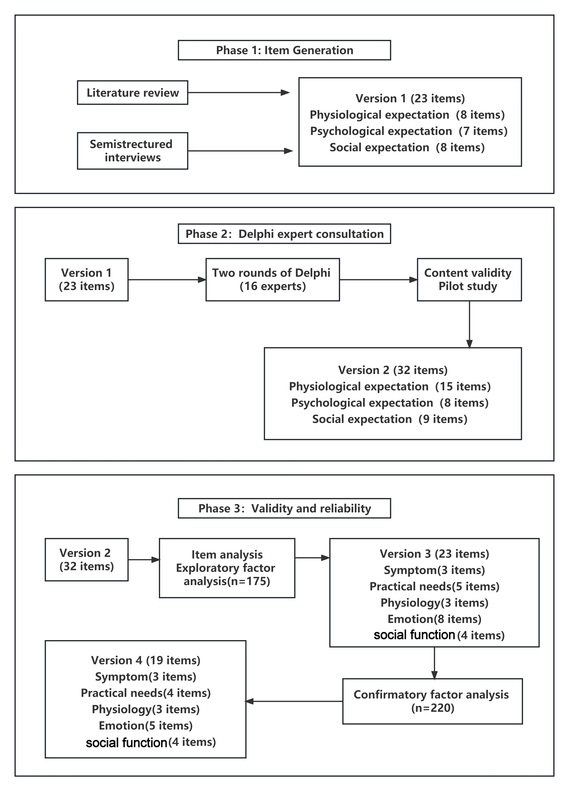
The study was conducted in three stages, and the scale preparation process is shown in the Figure 1.
Phase 1: Build the scale entry pool and develop the preliminary version of TES-LC (version 1)
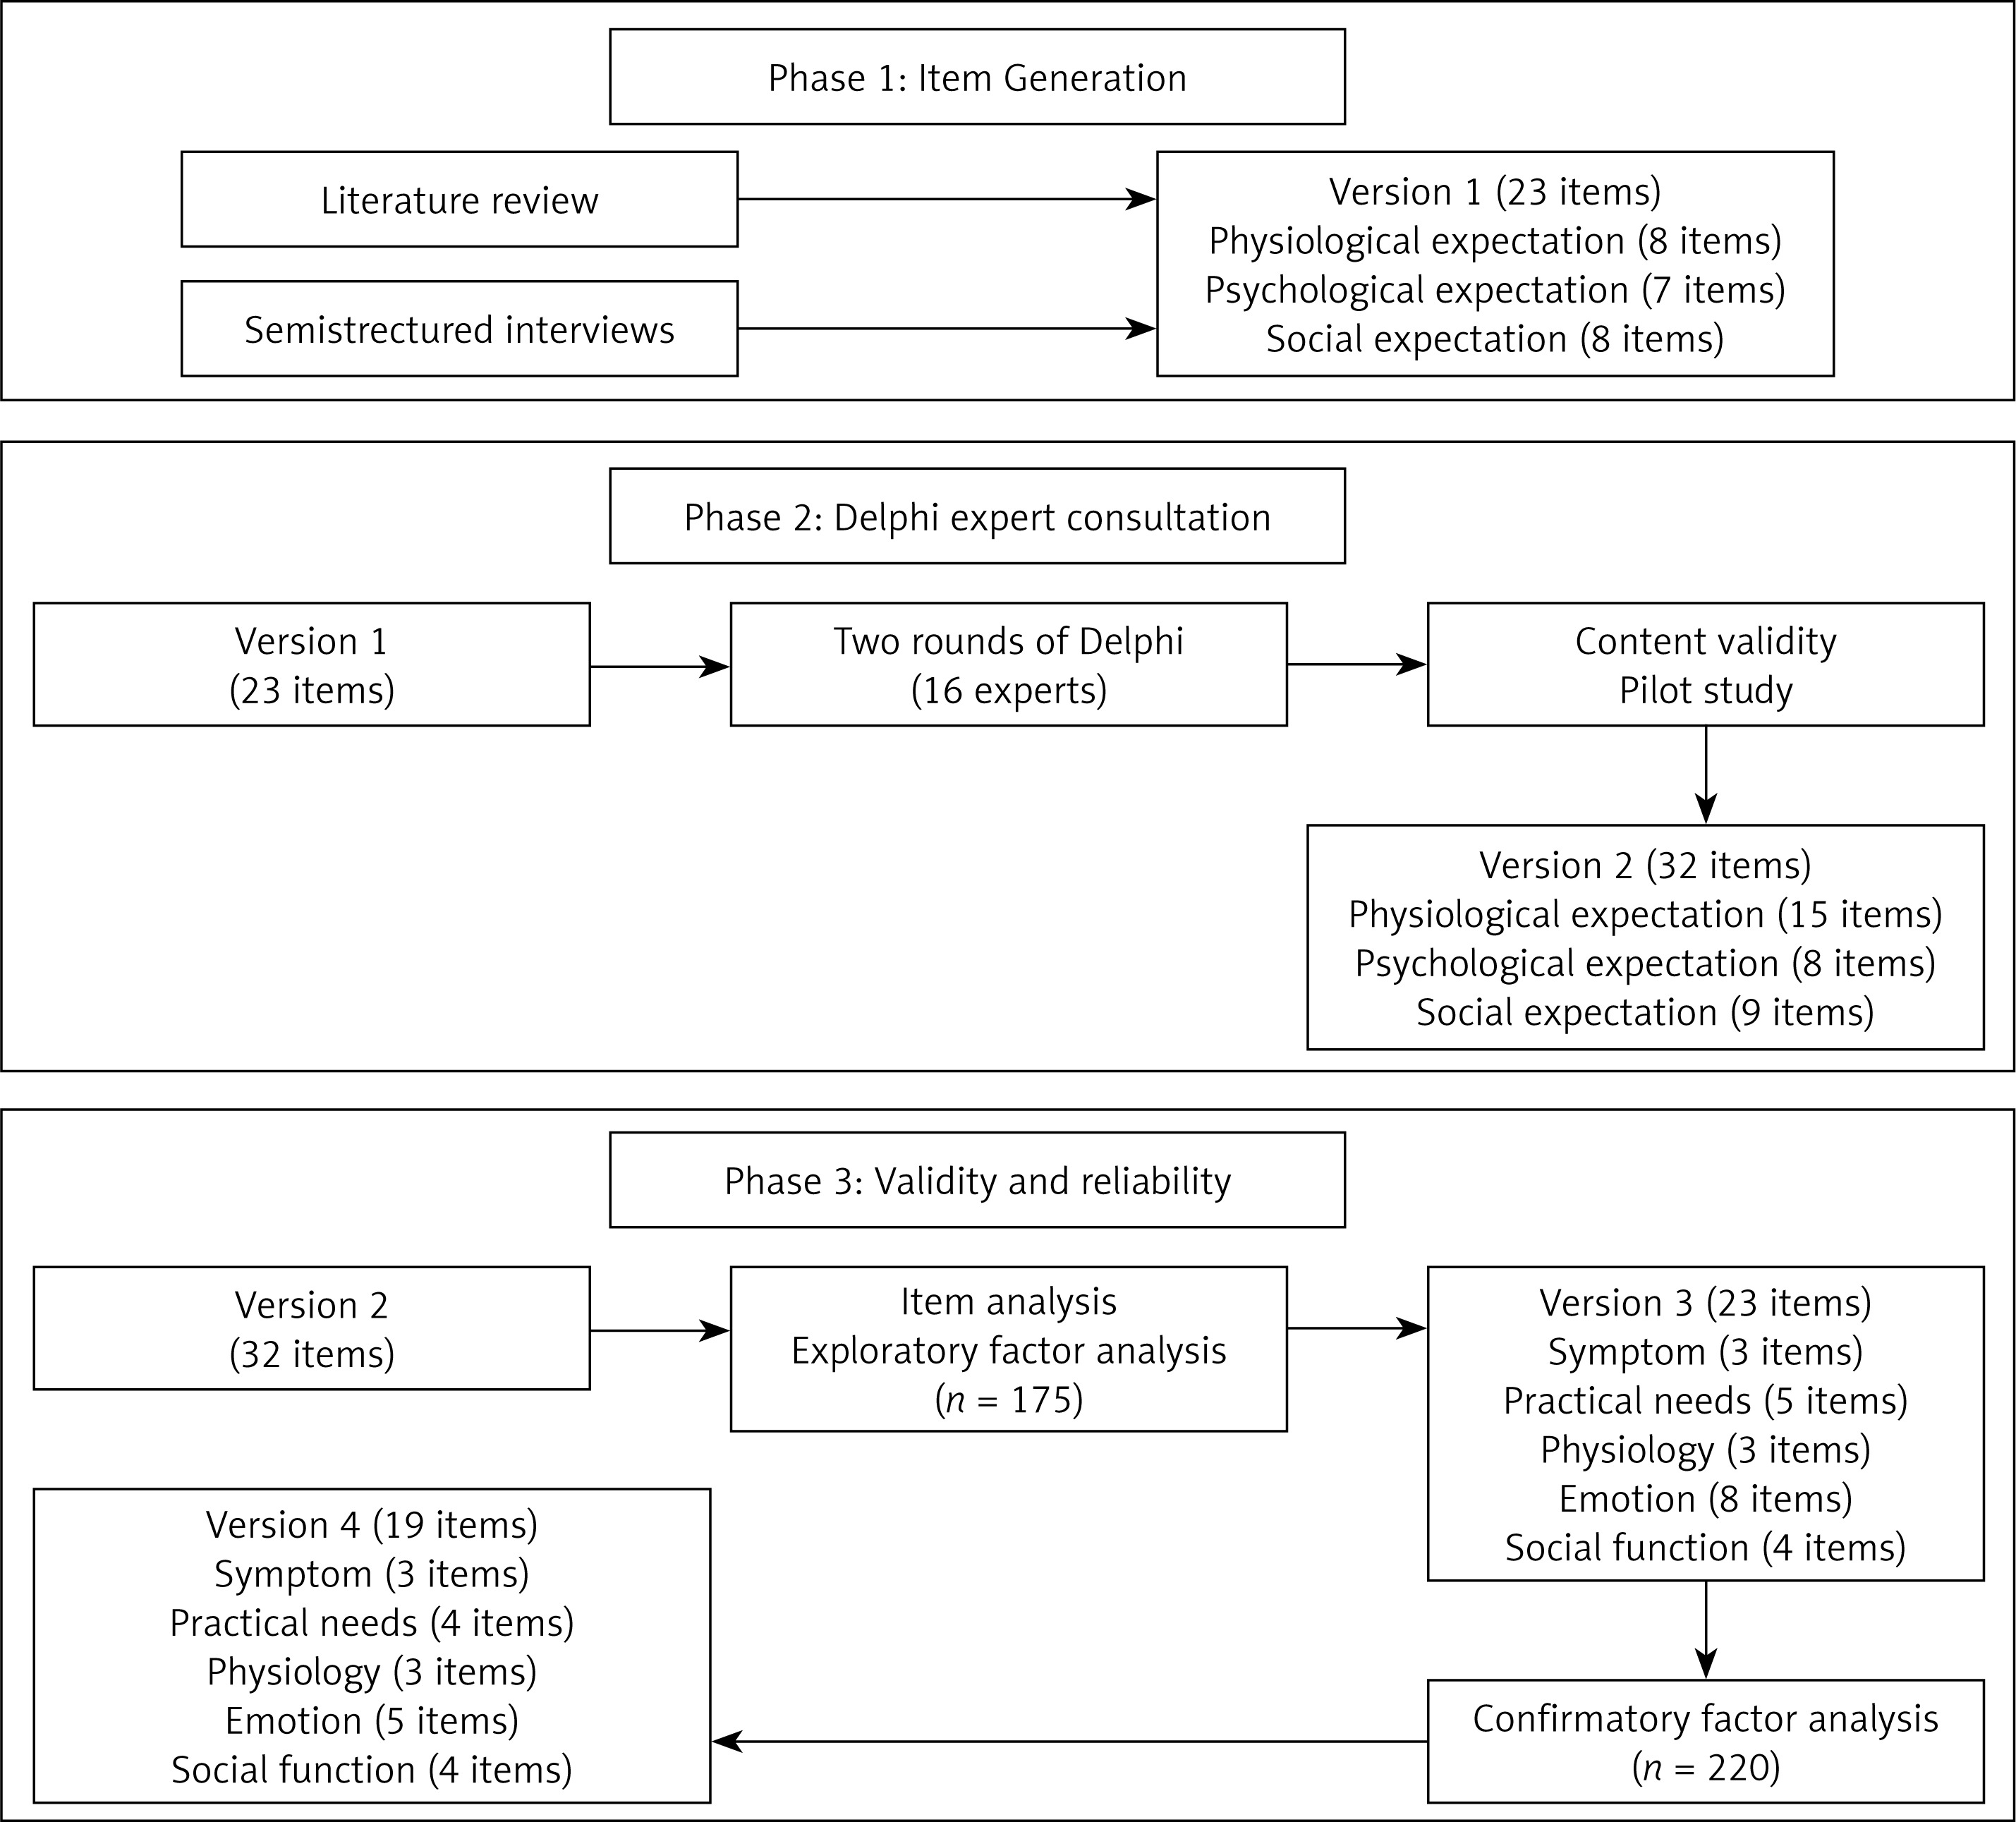
In 2006, Janzen [20] put forward the concept of the health expectations theory model, a model of the development of health expectations six phases: precipitating phenomenon, prior understanding, cognitive processing, expectation formulation, outcome, post-outcome cognitive processing. This study based on this model idea combined with cancer patients support care theory, combined with a large number of literature research results, establishes the theoretical framework of a treatment scale of liver cancer patients (Figure 2).
The semi-structured interview form was used to explore and summarize the characteristics of the treatment expectations from the perspective of liver cancer patients. By convenience sampling, 15 liver cancer patients were interviewed, 12 male and three female, with a mean age of 57.60 ±12.79. The interview outline includes the following four aspects: 1. Do you have accurate expectations about the current development stage of the disease and its physical state? 2. Do you have accurate expectations of treatment outcomes? 3. What aspects of the current problems do you most want to alleviate through treatment? 4. What problems are you worried about after the treatment? The duration of each interview was controlled at 25–30 min. Based on the interview results of 15 liver cancer patients, three themes were refined: physiological expectations, psychological expectations, and social expectations. A pool of prospective scale entries for HCC patients was initially established through a literature review and semi-structured interviews containing 23 entries. The scale was scored by levels: 5 (strongly agree), 4 (agree), 3 (uncertain), 2 (disagree), and 1 (strongly disagree).
Phase 2: Two rounds of expert consultation, forming the TES-LC (version 2)
The Delphi expert consultation method was used, and the interval between the two rounds of expert consultation was 2 weeks. In this study, the expert questionnaire was self-filled. The experts in the same city sent the paper version of the questionnaire, and the experts in other cities sent the electronic questionnaire by email. The study included 16 experts from 5 provinces, including six oncology experts, four clinical nursing experts, five geriatric nurses, and one psychologist; the median age was 43 years, and the average working life was 21.94 ±5.3 years. Soliciting anonymously, experts can add, delete, modify, and merge items. General information of the experts is shown in Table I.
Table I
General data of experts (n = 16)
The reliability and representativeness of expert consultation results were tested by the degree of specialist authority and coordination coefficient of expert opinion. Finally, the items were screened according to the item screening criteria and the expert modification opinions. In the study, the mean importance score of 4, the total score of 20%, and the variation coefficient of 0.25 were used as the criteria [22] for item screening, and the three items whose judgment criteria met two were retained. After the first round of expert consultation, some things were required to fulfil the screening criteria, and some items were modified according to the above standards and expert opinions. The results of the second round of specialist consultation showed that everything met the screening criteria. After the two rounds of consultation, the scale contained three dimensions: physical, psychological, and social aspects, with a total of 32 items.
Pre-survey phase. On March 13,2022,10 liver cancer patients were randomly selected in the interventional ward of the First Affiliated Hospital of China Medical University for pre-investigation using TES-LC (version 2). All participants filled in the assessment scale, and the filling time was 6–10 min, indicating that the scale was easy to understand and fill in. The preliminary version of the Treatment Expectation Scale for HCC Patients, containing 32 entries, was clinically measured based on this version.
Phase 3: Performance test of the scale
Study design
In this study, the convenience sampling method selected liver cancer patients who met the inclusion criteria in the interventional ward of the First Affiliated Hospital of China Medical University from April to October 2022. Sample size calculation: According to the sample size based on the estimation method of multivariate analysis, the sample size [23] is 5 to 10 times the number of analysis items, 10% invalid questionnaires are considered, and the exploratory factor analysis stage is 100 to 200 [24], and at least 200 [24] are required in the confirmatory factor analysis stage. Therefore, 175 patients were included in the exploratory factor analysis phase. A total of 220 patients were included in the confirmatory factor analysis stage.
Inclusion criteria: ① age 18 years; ② patient diagnosed with primary liver cancer by imaging or pathology; ③ with no other malignancies; ④ thought clarity and regular expression; ⑤ identified his condition; ⑥ informed consent for investigation.
Exclusion criteria: ① Patients with severe primary diseases of the heart, brain, kidney, and hematopoietic system; ② had cognitive impairment and psychiatric disorders; ③ is participating in other clinical trials and related treatment may have an impact on the study; ④ was unable to conduct verbal communication.
Data collection: ① General information questionnaire, including demographic data and disease-related information. ② Life Orientation Test (LOT): It was compiled by Scheier and Carver [25] in 1985 and consists of 12 items. ③ General Self-Efficacy Scale (GSES): It was first compiled by the German psychology professor Ralf Schwarzer and others [26] and used the Chinese version of the General Self-efficacy Scale translated and revised by Wang et al. [27] in 2001 with a total of 10 items.
Data exclusion criteria: ① Patients who died during the study period, ② who voluntarily withdrew at any investigation stage, and ③ more than 30% of missing values (> 30% of items in a scale were not answered).
Ethical approval
This study has been reviewed and approved by the Ethics Committee of China Medical University; the ethics number is [2021] 110, and permission was obtained from the surveyed hospital and related departments.
Statistical analysis
After double Excel input, we checked the data, established a database, and analyzed data using the statistical software SPSS21.0. Amos 26.0 software was used for the confirmatory factor analysis. Firstly, Kaiser–Meyer–Olkin (KMO) value calculation and the Bartlett spherical test were conducted to explore the feasibility of exploratory factor analysis. Subsequently, exploratory factor analysis was done using the spindle factor method and the maximum variance orthogonal rotation [28]. The deletion criteria for this study are as follows: ① The entries are loaded < 0.5 on the common factor; ② The load difference is negligible on two or more common factors (less than 0.05); ③ Each common factor contains < 3 entries [23]. The confirmatory factor analysis was performed using the maximum likelihood method, multiple fitting indicators were applied for model evaluation, and the calibration validity was explored using the correlation coefficient of the General Self-Efficacy Scale, the Revised Life Orientation Test, and the Treatment Expectation Scale for HCC patients. It was considered a weak correlation if the correlation coefficient was < 0.3, moderate from 0.3 to 0.5, and vital for > 0.5 [29]. The mean variance extraction value (average variance extracted, AVE) and combined reliability (composite reliability) were used to test aggregate validity, with AVE value > 0.5 and composite reliability (CR) value greater than 0.7, indicating good aggregate validity [30]. An internal consistency test was performed using Cronbach’s α coefficient, and Cronbach’s α coefficient > 0.7 indicates good scale internal consistency [31].
Results
Structural validity
Project analysis: Q4, Q6, Q9, Q10, Q11, and Q12 were removed by dispersion degree analysis, threshold ratio, and correlation coefficient.
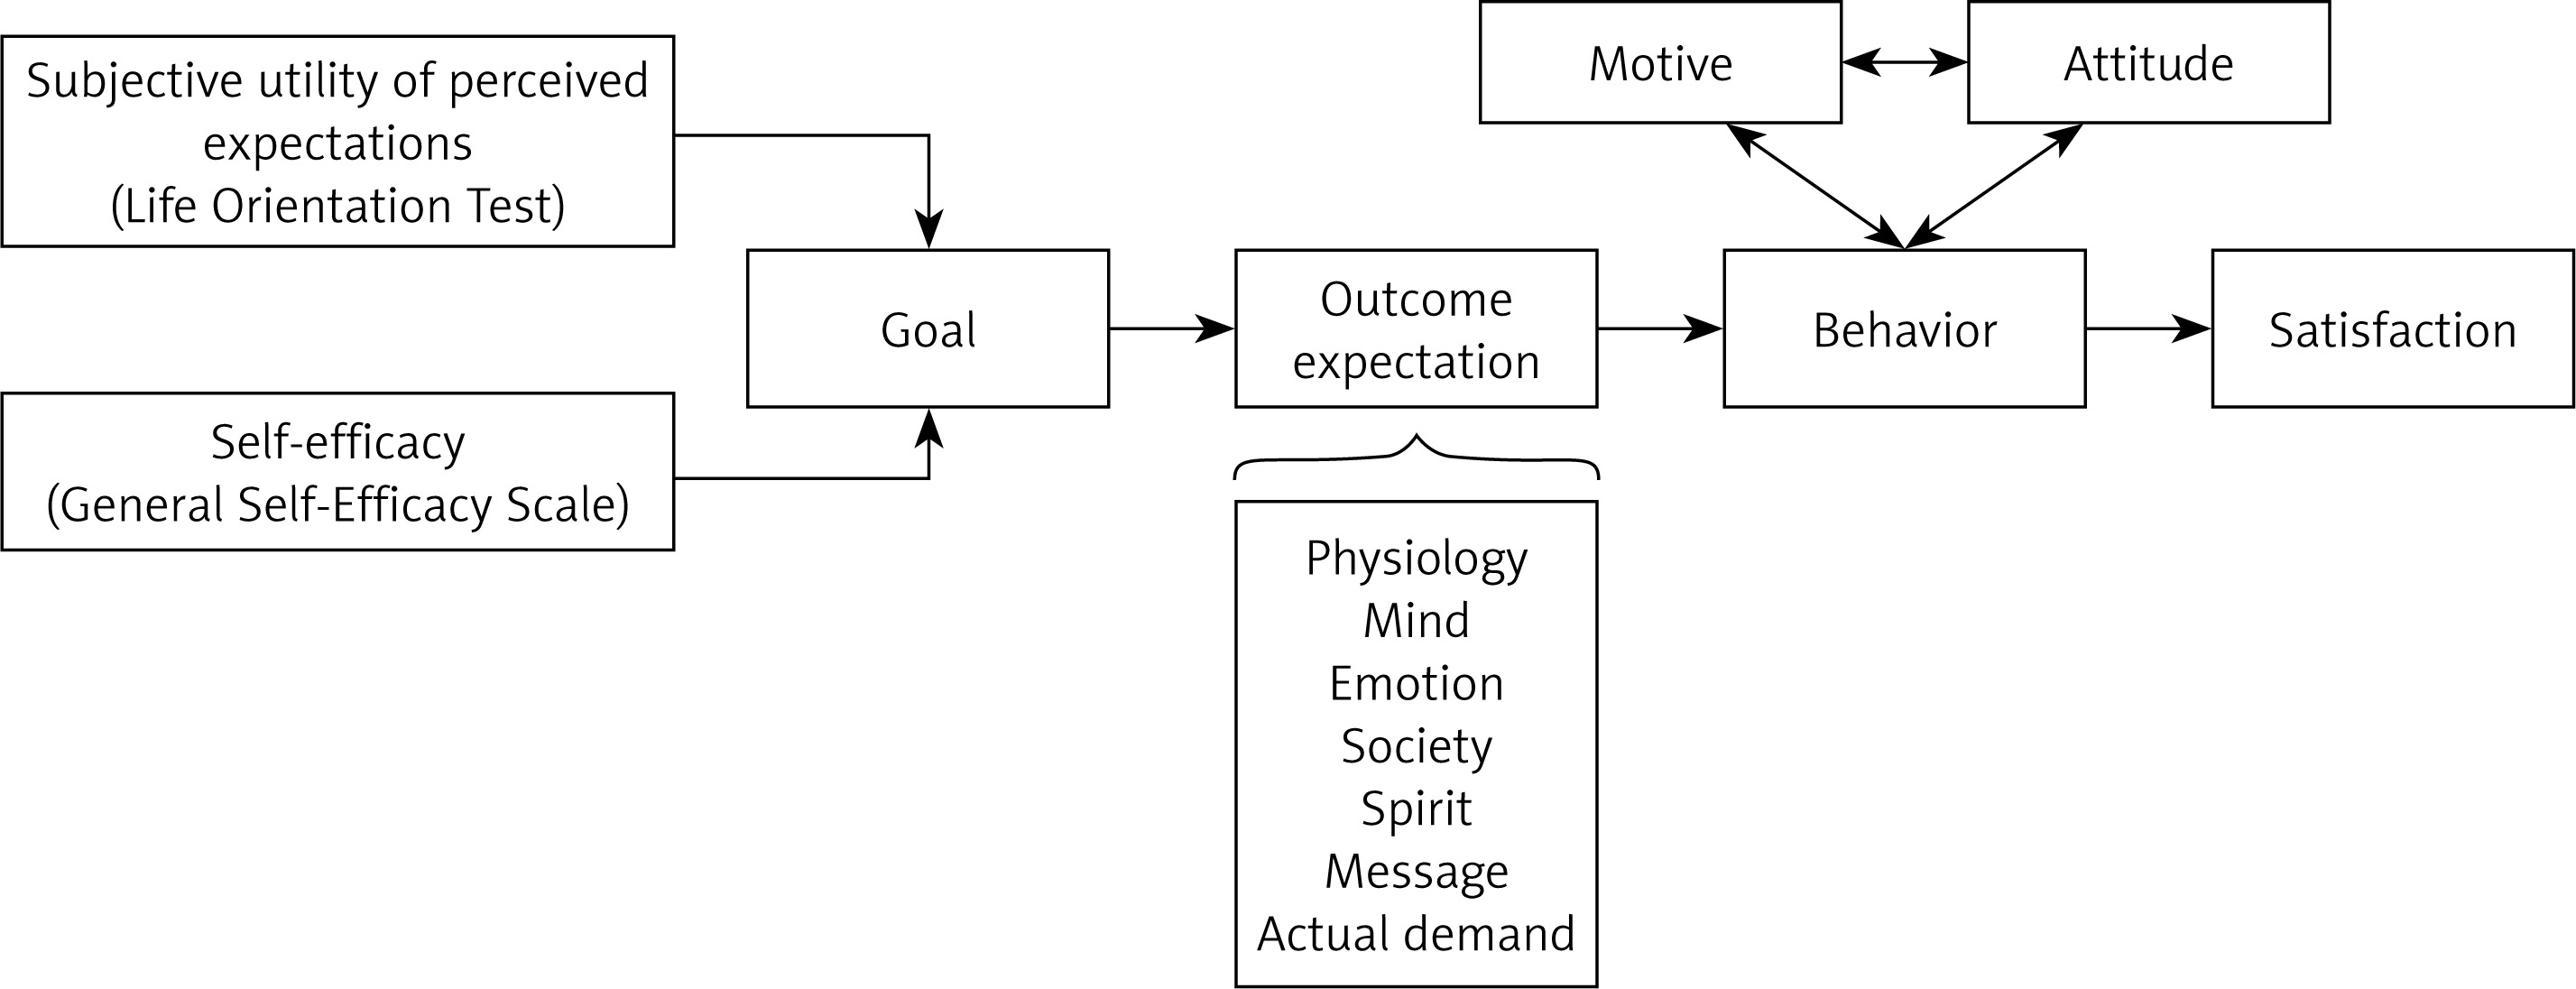
Exploratory factor analysis: After removing six items by item analysis, KMO value calculation and the Bartlett spherical test were performed, giving the KMO value of 0.862 and the Bartlett spherical test result of 3252.29 (d f = 325, p < 0.001). Exploratory factor analysis was performed using the spindle factor method and maximum variance orthogonal rotation, with factor load > 0.5 as the screening criterion, and Q5, Q7, and Q19 were removed. Factor analysis extracted five common factors with feature root > 1, collectively explaining 60.11% of the total variation. The results are shown in Table II. The scree plot is shown in Figure 3. Based on the results of exploratory factor analysis and the interpretability of entry content, combined with the [32] of supportive care for cancer patients, the five dimensions of the Treatment Expectation Scale of Liver Cancer patients were named as disease symptoms, practical needs, psychological state, emotional satisfaction, and social function.
Table II
Exploratory factor analysis extracted factors with eigenvalues > 1 and explanatory variables
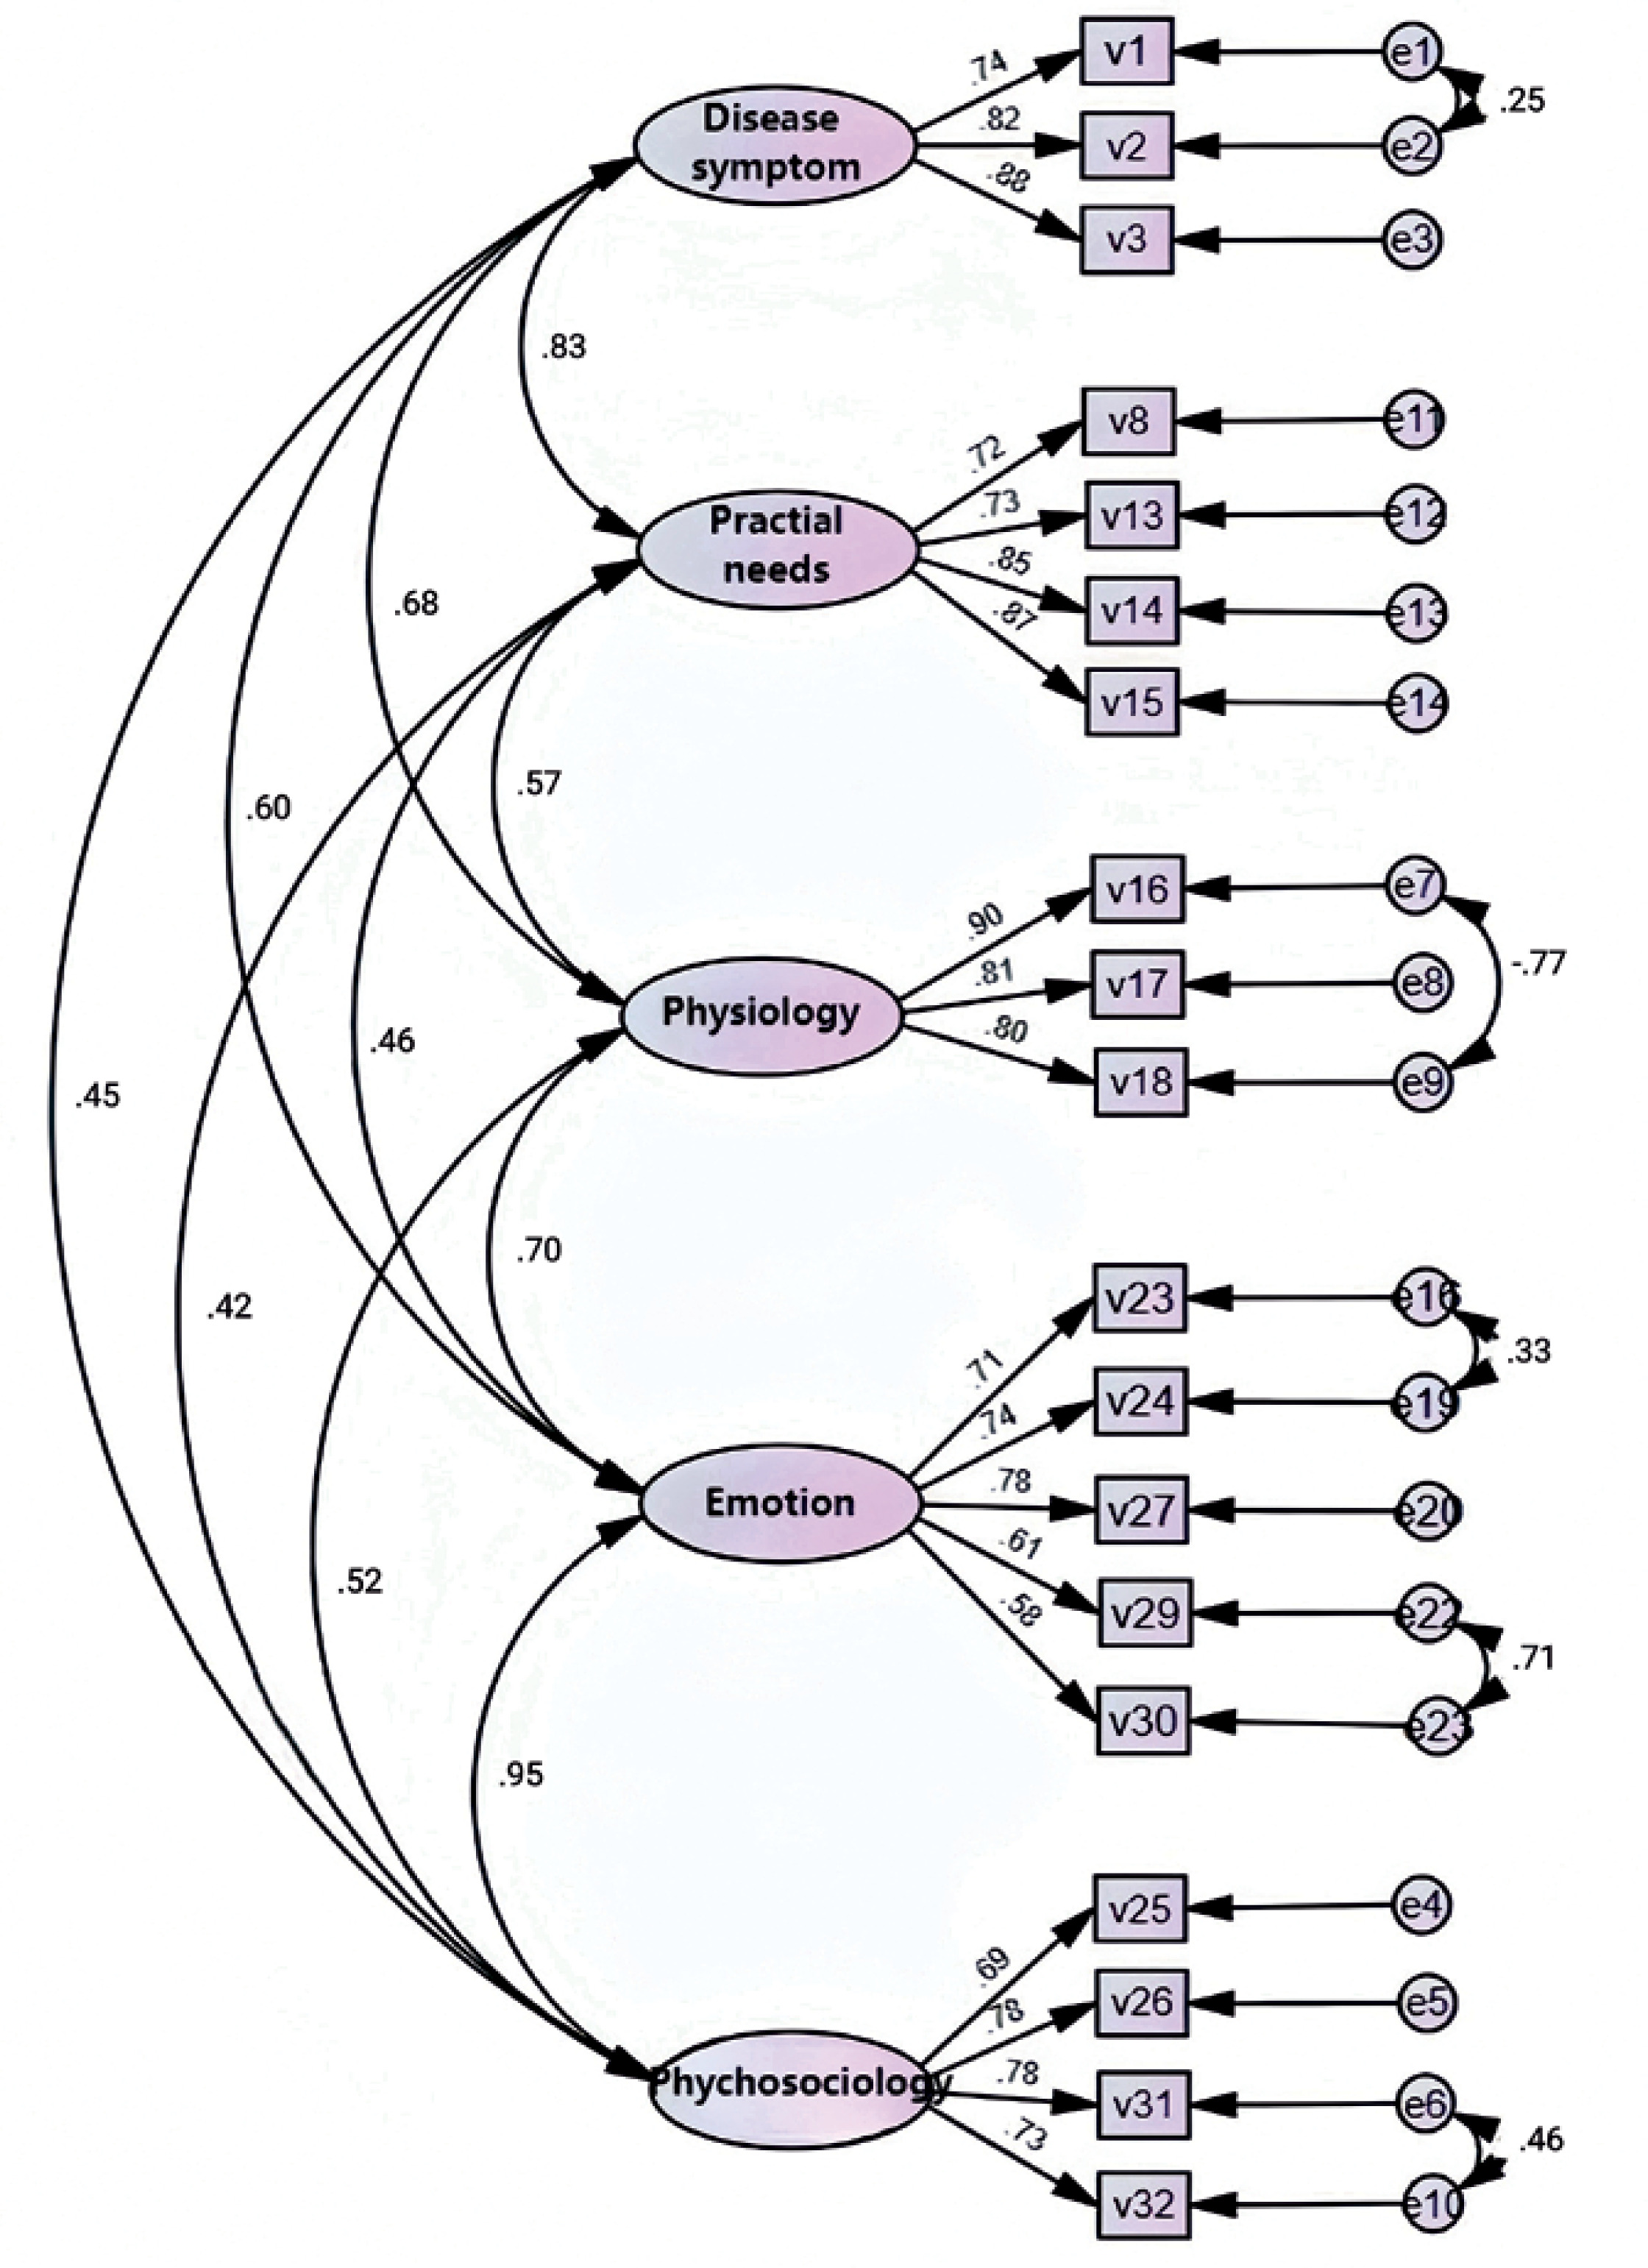
Confirmatory factor analysis: The results showed that some indicators of the preset frame model did not meet the standard requirements and must be corrected appropriately. Q28’s normalized regression coefficient was 0.485; for all other entries > 0.5, Q28’s removal from the model was considered. Adjusting the model according to the MI (modification index), Q20 and Q21 in the psychological dimension showed an MI index > 20, suggesting that the two items may strongly correlate with the psychological dimension. Q22 has MI measures in both dimensions > 14, meaning that entry 22 may have a significant correlation between the two dimensions. So, Q20, Q21, and Q22 were removed from this model. In addition, five error covariance correlations were added with MI > 10. The modified model fitting index (χ2/d f = 2.094, GFI (goodness-of-fit index) = 0.885, AGFI (adjusted goodness-of-fit index) = 0.840, NFI (normed fit index) = 0.901, IFI (incremental fit index) = 0.945, TLI (Tucker-Lewis index) = 0.931, CFI (comparative fit index) = 0.945, PGFI (parsimony goodness-of-fit index) = 0.638, PNFI (parsimonious normed fit index) = 0.722, PCFI (parsimony comparative fit index) = 0.757 and RMSEA (root mean square error of approximation) = 0.071) model fitting index can be considered ideal (Figure 4). Therefore, the five-factor model of the Treatment Expectation Scale for HCC patients has good construct validity. The standardized regression coefficients ranged from 0.585 to 0.894, AVE > 0.5 (except for the emotional satisfaction dimension), CR > 0.8, and the aggregate validity passed the test.
Content validity
Six experts were selected and invited to assess the content validity of version 2. Content validity was evaluated using the item content validity index (I-CVI) and scale content validity index (S-CVI). They used a 4-point scale from 1 (unrelated) to 4 (highly relevant). The I-CVI values ranged from 0.83 to 1.00, and the S-CVI values ranged from 0.94.
Related validity
The mean score of the entries of the Treatment Expectation Scale for HCC patients was significantly associated with the General Self-Efficacy Scale and the Life Orientation Test, with rs of 0.355 and 0.629, respectively (p < 0.001).
Reliability test
The Cronbach’s α coefficient of each dimension of the expected scale of HCC patients ranged between 0.805 and 0.868, and the total table Cronbach’s α coefficient was 0.911, all greater than 0.8 (Table III).
Table III
Internal consistency reliability of expected scale for HCC patients (n = 220)
Discussion
The TES-LC is rational and scientific
The conceptual model of the healthy expectation development process [20] proposes that self-efficacy and perceived expected subjective utility jointly promote the formation of individual goals, and the establishment of goals affects the personal outcome expectation while also being affected by the outcome expectation. Understanding patient outcome expectations and appropriate intervention may influence individual behavior and promote better medical outcomes in medical work. Studies show that treatment expectations also affect patients’ compliance, satisfaction, and treatment effects [9–12]. The inappropriate expectations generated by the patient also affected his psychological status, leading to higher anxiety scores [8]. Therefore, it is essential to understand the current level of patient treatment expectations. Based on the conceptual model of the development process of health expectation, this study scientifically and systematically developed the Treatment Expectation Scale of Liver Cancer patients and formed the pool of scale items after literature research and semi-structured interviews. The scale items were screened and revised after two rounds of expert consultation. The effective recovery rate of the first and second rounds of specialist consultation questionnaires is 94.12% and 100%, respectively. Experts participate in developing this scale, which ensures the quality of item screening. The expert authority coefficient is 0.87, which shows that the experts involved in this study’s expert consultation are reliable. Comparing the indicators of the first round and the second round of expert consultation, it can be found that the average value of the importance score and total score rate of expert consultation increased, and the value range narrowed, which shows that the concentration of specialist opinion is good [22]. The results of expert consultation in this study are scientific and reliable, and the setting of scale items is reasonable. Finally, the reliability and validity test was conducted, showing that it has good reliability and validity and can provide a standardized evaluation tool for the expected measurement of the treatment of liver cancer patients.
The TES-LC has good reliability and validity
Internal consistency is usually evaluated using Cronbach’s α coefficient and half reliability. Evaluation of stability is traditionally performed using test-retest reliability. Fold-half reliability is generally used for attitude questionnaires but is unsuitable for fact questionnaires, so this study did not test half reliability. Moreover, based on the conceptual model of the expectation development process proposed by Janzen et al. [20], it can be seen that patient expectation is an indicator susceptible to time influence with instability [33], so this scale is not suitable for test-retest reliability analysis. For the self-compiled scale, at least the internal consistency [34] was verified, so Cronbach’s α coefficient was used to conduct the reliability test of the scale in this study. The results show that the total table Cronbach’s α coefficient is 0.911, and the Cronbach’s α coefficient of each scale dimension is between 0.805 and 0.868. However, it is generally believed that Cronbach’s α coefficient is more significant than 0.7, which means that the scale’s reliability is good, which shows that the overall ranking and all dimensions have good internal consistency. The reliability of this study is promising.
Validity refers to the degree to which the scale can reflect the accuracy of the measured things, and it is mainly used to evaluate the accuracy and authenticity of the scale [35]. This study primarily analyzed the validity of the construct, aggregation, and criterion validity. To verify the scientific construction of the scale, exploratory factor analysis and validation factor analysis were first used to test the scale. Through exploratory factor analysis, five common factors with eigenvalues > 1 were extracted, with a cumulative contribution rate of > 60.11%, and all factor load values were > 0.5. It is generally believed that the contribution rate of cumulative variance should be > 60%, and the factor load of each item should be > 0.5 [36], which shows that the five common factors extracted are more reasonable. Due to the sample dependence of the exploratory factor analysis, the obtained five-factor model still needs to be validated [37] for other independent samples, and this study was conducted through two rounds of scale distribution to get two independent sample data. After confirmatory factor analysis, the five-factor model fitting index can be considered ideal, indicating that the expected treatment scale of liver cancer patients has good structural validity, and it is reasonable to divide the items into five dimensions. In this study, dimension AVE was > 0.5 (except the emotional satisfaction dimension), and CR was > 0.8. The aggregation validity of the visible scale passed the test [30], and the dimension aggregation effect was good. The construction of the expected treatment scale for liver cancer patients is excellent and scientific.
The correlation validity is an index [38] determined by selecting the universally valid scale as the standard and calculating the correlation coefficient between the new and standard scales. However, there is no specific scale for the expected treatment of cancer patients at home and abroad, and there is a lack of a “gold standard” to verify the validity of the association. Therefore, according to the expected concept connotation and its development theory, the General Self-Efficacy Questionnaire and the Revised Life Orientation Test were selected as the effect scale. In this study, the correlation coefficient values found between the mean score of the expected scale and the total score of the revised scale of liver cancer patients were 0.355 and 0.629 (p < 0.001), respectively, indicating the reasonable validity of the scale.
TES-LC has good comprehensiveness
In this study, the Treatment Expectation Scale of Liver Cancer patients was divided into five dimensions – disease symptoms, practical needs, psychological state, emotional satisfaction, and social function – to explore the expectation of liver cancer patients’ needs in different fields after treatment. The complete Treatment Expectation Scale is presented in Figure 5.
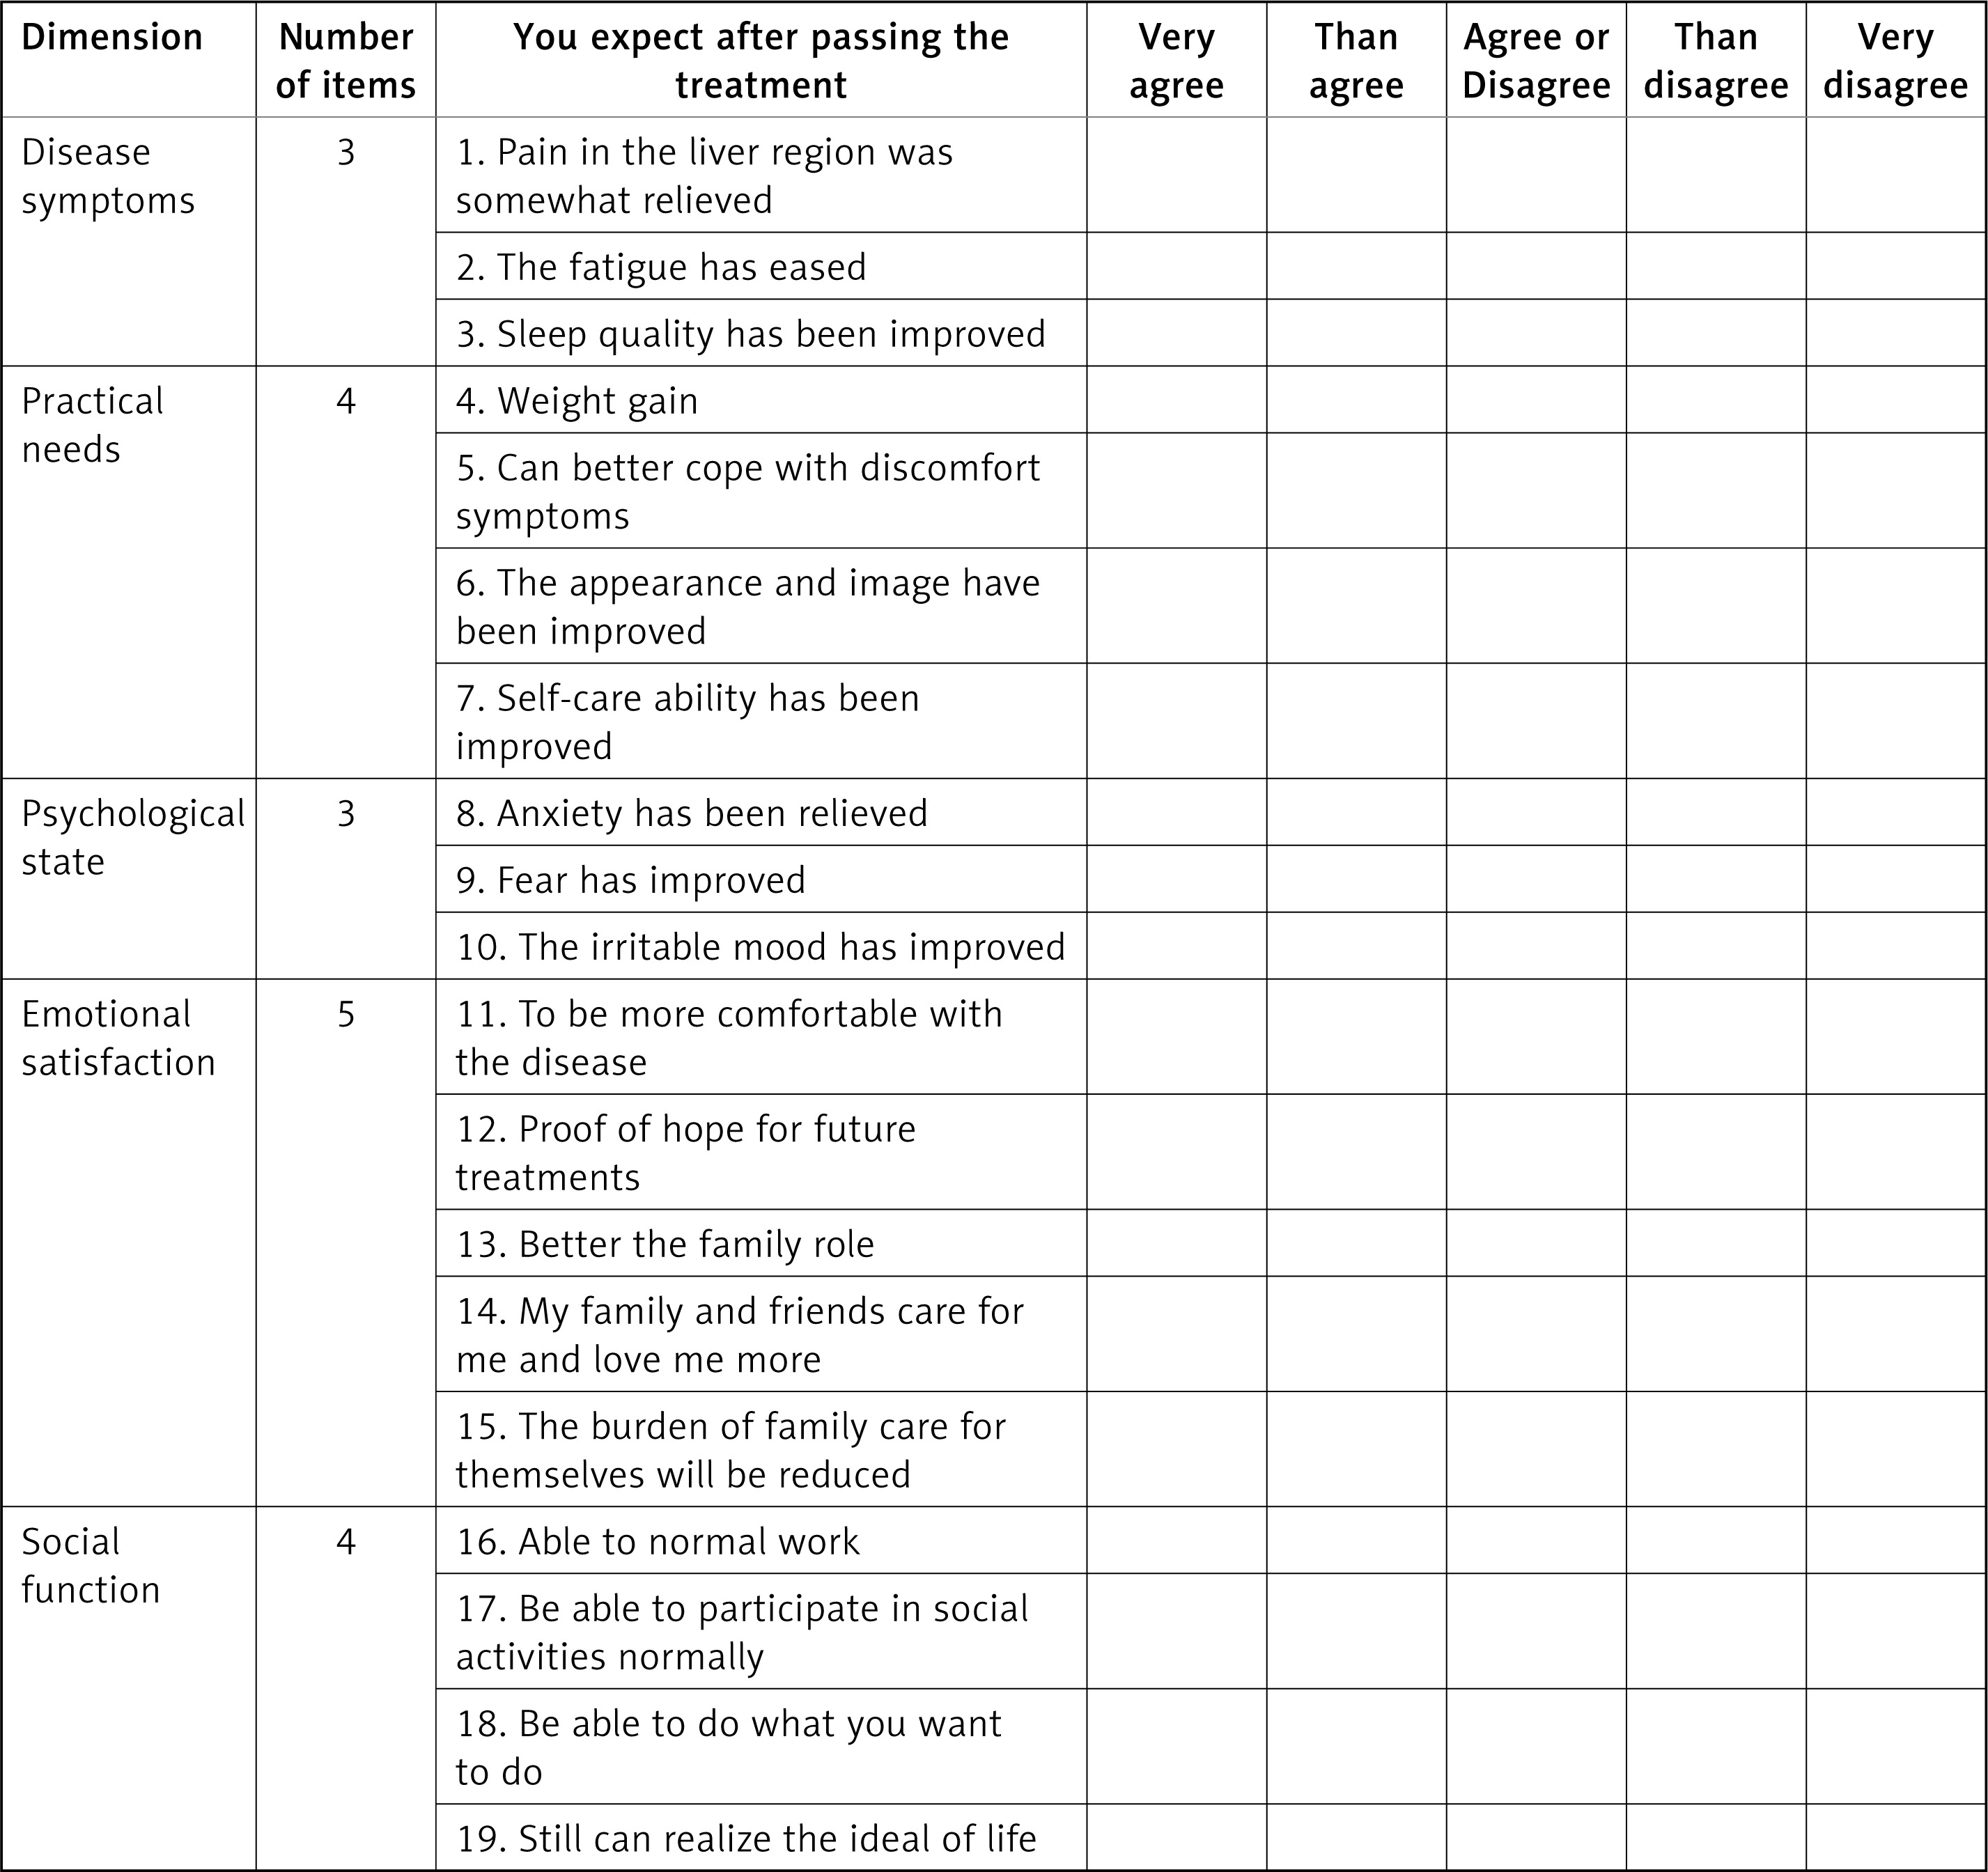
The disease symptom dimension reflects the patient expectation of the degree of coping and management of disease-related symptoms after treatment. The anticipation of improvement in disease symptoms has been widely studied in the cancer population [39] and [40] in people without cancer. In this study, this dimension included item 1, “relieved pain in the liver area”, item 2, “reduced fatigue”, and item 3, “improved sleep quality”. A study showed that [4] the incidence of pain, fatigue, and sleep restlessness exceeded 60% before surgical treatment, which may indicate that the three items of this dimension are targeted and universal to the symptoms of patients with liver cancer.
The practical needs dimension reflects the patient expectation of whether the demand can be met after treatment. The essential needs of cancer patients change [32] due to the different ages, body statuses, and economic conditions of patients. Accurately measuring patients’ basic needs can help medical staff understand the actual situation of patients and give targeted measures. For example, item 7 is “Self-care ability has been improved”, and the expectation of improving the self-care ability of liver cancer patients was measured.
The dimension of psychological state reflects the patient expectation that the treatment can relieve the negative psychological symptoms, such as anxiety and fear, caused by the disease and treatment. For example, item 8, “Anxiety has been relieved”, measures the patient expectation of anxiety relief. However, patients with liver cancer usually face a sizeable psychological burden [41], which shows that this dimension entry is also targeted and universal.
The emotional satisfaction dimension refers to the patient expectations of comfort, belonging, confidence, recovery, and emotional support. How family members, friends, and doctors transmit information can affect patients’ trust and their own treatment expectations [42]. For example, items 12, “Hope for future treatment”, and 14, “My family and friends care for me and love me more”, summarize the dimensional concept.
The social function dimension reflects the patient expectation of the spiritual pursuit and the transformation of coping social role after treatment. Studies have shown that cancer patients with stable careers and financial support have high psychological distress and their own emotional needs. This group of patients may need to pay more attention to their self-expectations after changing their social roles [43]. For example, item 16, “able to do normal work”, and item 19, “able to achieve the ideal life”, reflect the connotation of the field.
There are several limitations to the current study, which need to be addressed in future studies. ① The sampling scope of the study subjects is single and limited to the liver cancer patients in the interventional ward of the First Affiliated Hospital of China Medical University, so the sampling scope can be expanded in the future to use the scale to test the stability of the scale. ② There was no status investigation due to the influence of time and the novel coronavirus epidemic, and the scale will be used in the future to test the applicability of the scale. ③ Due to liver cancer pathogenic factors and Chinese gender characteristics, there are fewer female liver cancer patients. ④ We should invite more psychological experts to evaluate our questionnaire, which is the goal of continuously improving our follow-up questionnaire. The above is what we will continue to enrich and verify later.
In conclusion, the Treatment Expectation Scale for Liver Cancer patients compiled in this study contains 19 items in five dimensions: disease symptoms, practical needs, psychological state, emotional satisfaction, and social function. It has good reliability and validity and can be used as a tool to evaluate treatment expectations for liver cancer patients.