Introduction
Sepsis, a syndrome of physiologic, pathologic, and biochemical abnormalities induced by infection, is a major public health concern [1]. When sepsis occurs after a surgical procedure or during the postoperative hospital stay, it is typically called postoperative or surgical sepsis [2]. Abdominal surgery is one of the types of surgery most susceptible to postoperative sepsis [2–4], due to the long procedure time, bacterial translocation, and immune deficiency. It is reported that the incidence of severe postoperative sepsis has markedly increased, independently of patient demographics, comorbidities, and surgery type [4]. Recently, Brakenridge et al. reported that despite the low in-hospital mortality of postoperative sepsis, it may affect the long-term outcome including developing chronic critical illness and higher 12-month mortality, especially for elderly patients [5]. Moreover, the postoperative sepsis-associated higher risk of readmission, reexamination and longer hospital stay would also bring a high economic burden, especially in developing countries [6]. Therefore, strategies for preoperatively screening high-risk patients and specific perioperative care are badly needed.
In the last few decades, numerous teams have tried to develop tools for screening high risk [7–10], early diagnosis [11, 12], or predicting mortality risk [13, 14] of postoperative sepsis. Though most of them achieved good results, the clinical application to preoperative screening of high-risk patients is still restricted. Most of the studies were for predicting the mortality risk of postoperative sepsis, not for the occurrence, let alone for preoperative screening of high-risk patients. qSOFA and SOFA scores were the most frequently used variables for this area; however, they are more suitable for predicting the mortality risk of sepsis patients rather than the onset. Moreover, they were designed for intensive care unit (ICU) patients, not specifically for surgical patients (e.g., they lack surgical-associated factors). Though studies on early identification of postoperative sepsis tried to apply more clinical variables for prediction, they paid more attention to the intra- and post-operative variables [9–12], or specific markers [8, 15]. With the application of machine learning (ML) algorithms to the medical field, ML showed great potential to accurately predict sepsis onset ahead of time [16]. However, the heterogeneity of datasets, different availability of clinical variables, and unequal robustness of algorithms restrict the generalizability of models. For the models to predict postoperative sepsis onset based on ML algorithms, most of the datasets were from a single center, without another dataset for external validation [8–10]. Meanwhile, despite the satisfactory model performance, the variables used in some existing models are not routine [8, 12] or not specific for patients undergoing abdominal surgery [7, 9,10]. The generalization and robustness of the aforementioned ML-based models are affected by the single source of data, lack of external validation, and non-routine and non-specific variables, which restrict the application to clinical situations.
Due to the sample size and quality of the real-world medical data, an individual learner tends to either easily underfit or overfit. Ensemble learning, as a machine learning strategy that combines predictions from multiple base models, exhibits robust performance in prediction and classification tasks within the medical domain [10, 17]. In response to the characteristics of medical data, ensemble learning demonstrates superior predictive accuracy, enhanced model robustness, reduced risk of overfitting, and improved generalization capabilities compared to single models [10, 18,19]. Therefore, we aimed to develop an ensemble learning model for predicting the risk of postoperative sepsis on a multicenter (Multi) dataset and conduct external validation on the Medical Information Mart for Intensive Care IV (MIMIC-IV) dataset with routine preoperative variables based on the better ones among eight conventional single models by comparing the model performance; and to investigate the important variables associated with postoperative sepsis.
Material and methods
This study involved model construction, internal validation and external validation. For model construction and internal validation, this multicenter study was conducted in three academic hospitals in different areas of China (Southwest Hospital of Third Military Medical University, Xuan Wu Hospital of Capital Medical University, and West China Hospital of Sichuan University). Ethical approvals were obtained for this retrospective study from the three hospitals (Certification Number: KY201936, 2019-132, 2021-349, respectively). For external validation, Medical Information Mart for Intensive Care IV (MIMIC-IV) [20] was incorporated, which is approved by the institutional review boards of Beth Israel Deaconess Medical Center in Boston, Massachusetts, and the Massachusetts Institute of Technology. Data were obtained from PhysioNet (https://www.physionet.org/) by an author (Chunyong Yang, certification number: 46086293) with data usage agreement. No individual patient informed consent was required.
Patients
In the Multi dataset, clinical information of 49 768 surgical patients from the aforementioned hospitals between May 2014 and January 2020 were collected. The inclusion criteria were as follows: older than 18 years; American Society of Anesthesiologists (ASA) score 2–4; undergoing abdominal surgery (spleen, gastrointestinal, hepatobiliary and pancreas, adrenal gland, urinary female reproductive); no sepsis, infection, or other serious complications before surgery. The exclusion criteria were as follows: undergoing surgery with local anesthesia; superficial or non-intra-abdominal surgical site; patients with multiple or incomplete surgical records; missing values > 30%. Herein, postoperative sepsis is determined as the presence of sepsis, severe sepsis, or septic shock after surgery by ICD-10 [21]. Patients with postoperative sepsis were determined as positive cases, while patients who met the criteria without postoperative sepsis or other serious postoperative complications were determined as negative cases. Due to the requirement of the algorithms, the negative cases were randomly matched according to the age range and surgical type of the positive cases with the ratio of 1 : 2.
For the validation dataset, MIMIC-IV includes information on 383 220 patients at Beth Israel Deaconess Medical Center from 2008 to 2019. The inclusion criteria were as follows: older than 18 years; ASA score 2–4; undergoing abdominal surgery and transformed into PACU; no infection or not consistent with the Third International Consensus Definitions for Sepsis and Septic Shock (Sepsis-3) [1] before surgery; without important variables missing. The exclusion criteria were the same as for the Multi dataset. Postoperative sepsis was defined as fulfilling the Sepsis-3 criteria only after surgery within 30 days, and those who did not meet Sepsis-3 throughout hospitalization and had no diagnosis of sepsis were negative cases. Additionally, manual checking was performed according to the diagnosis after data extraction.
Data collection and processing
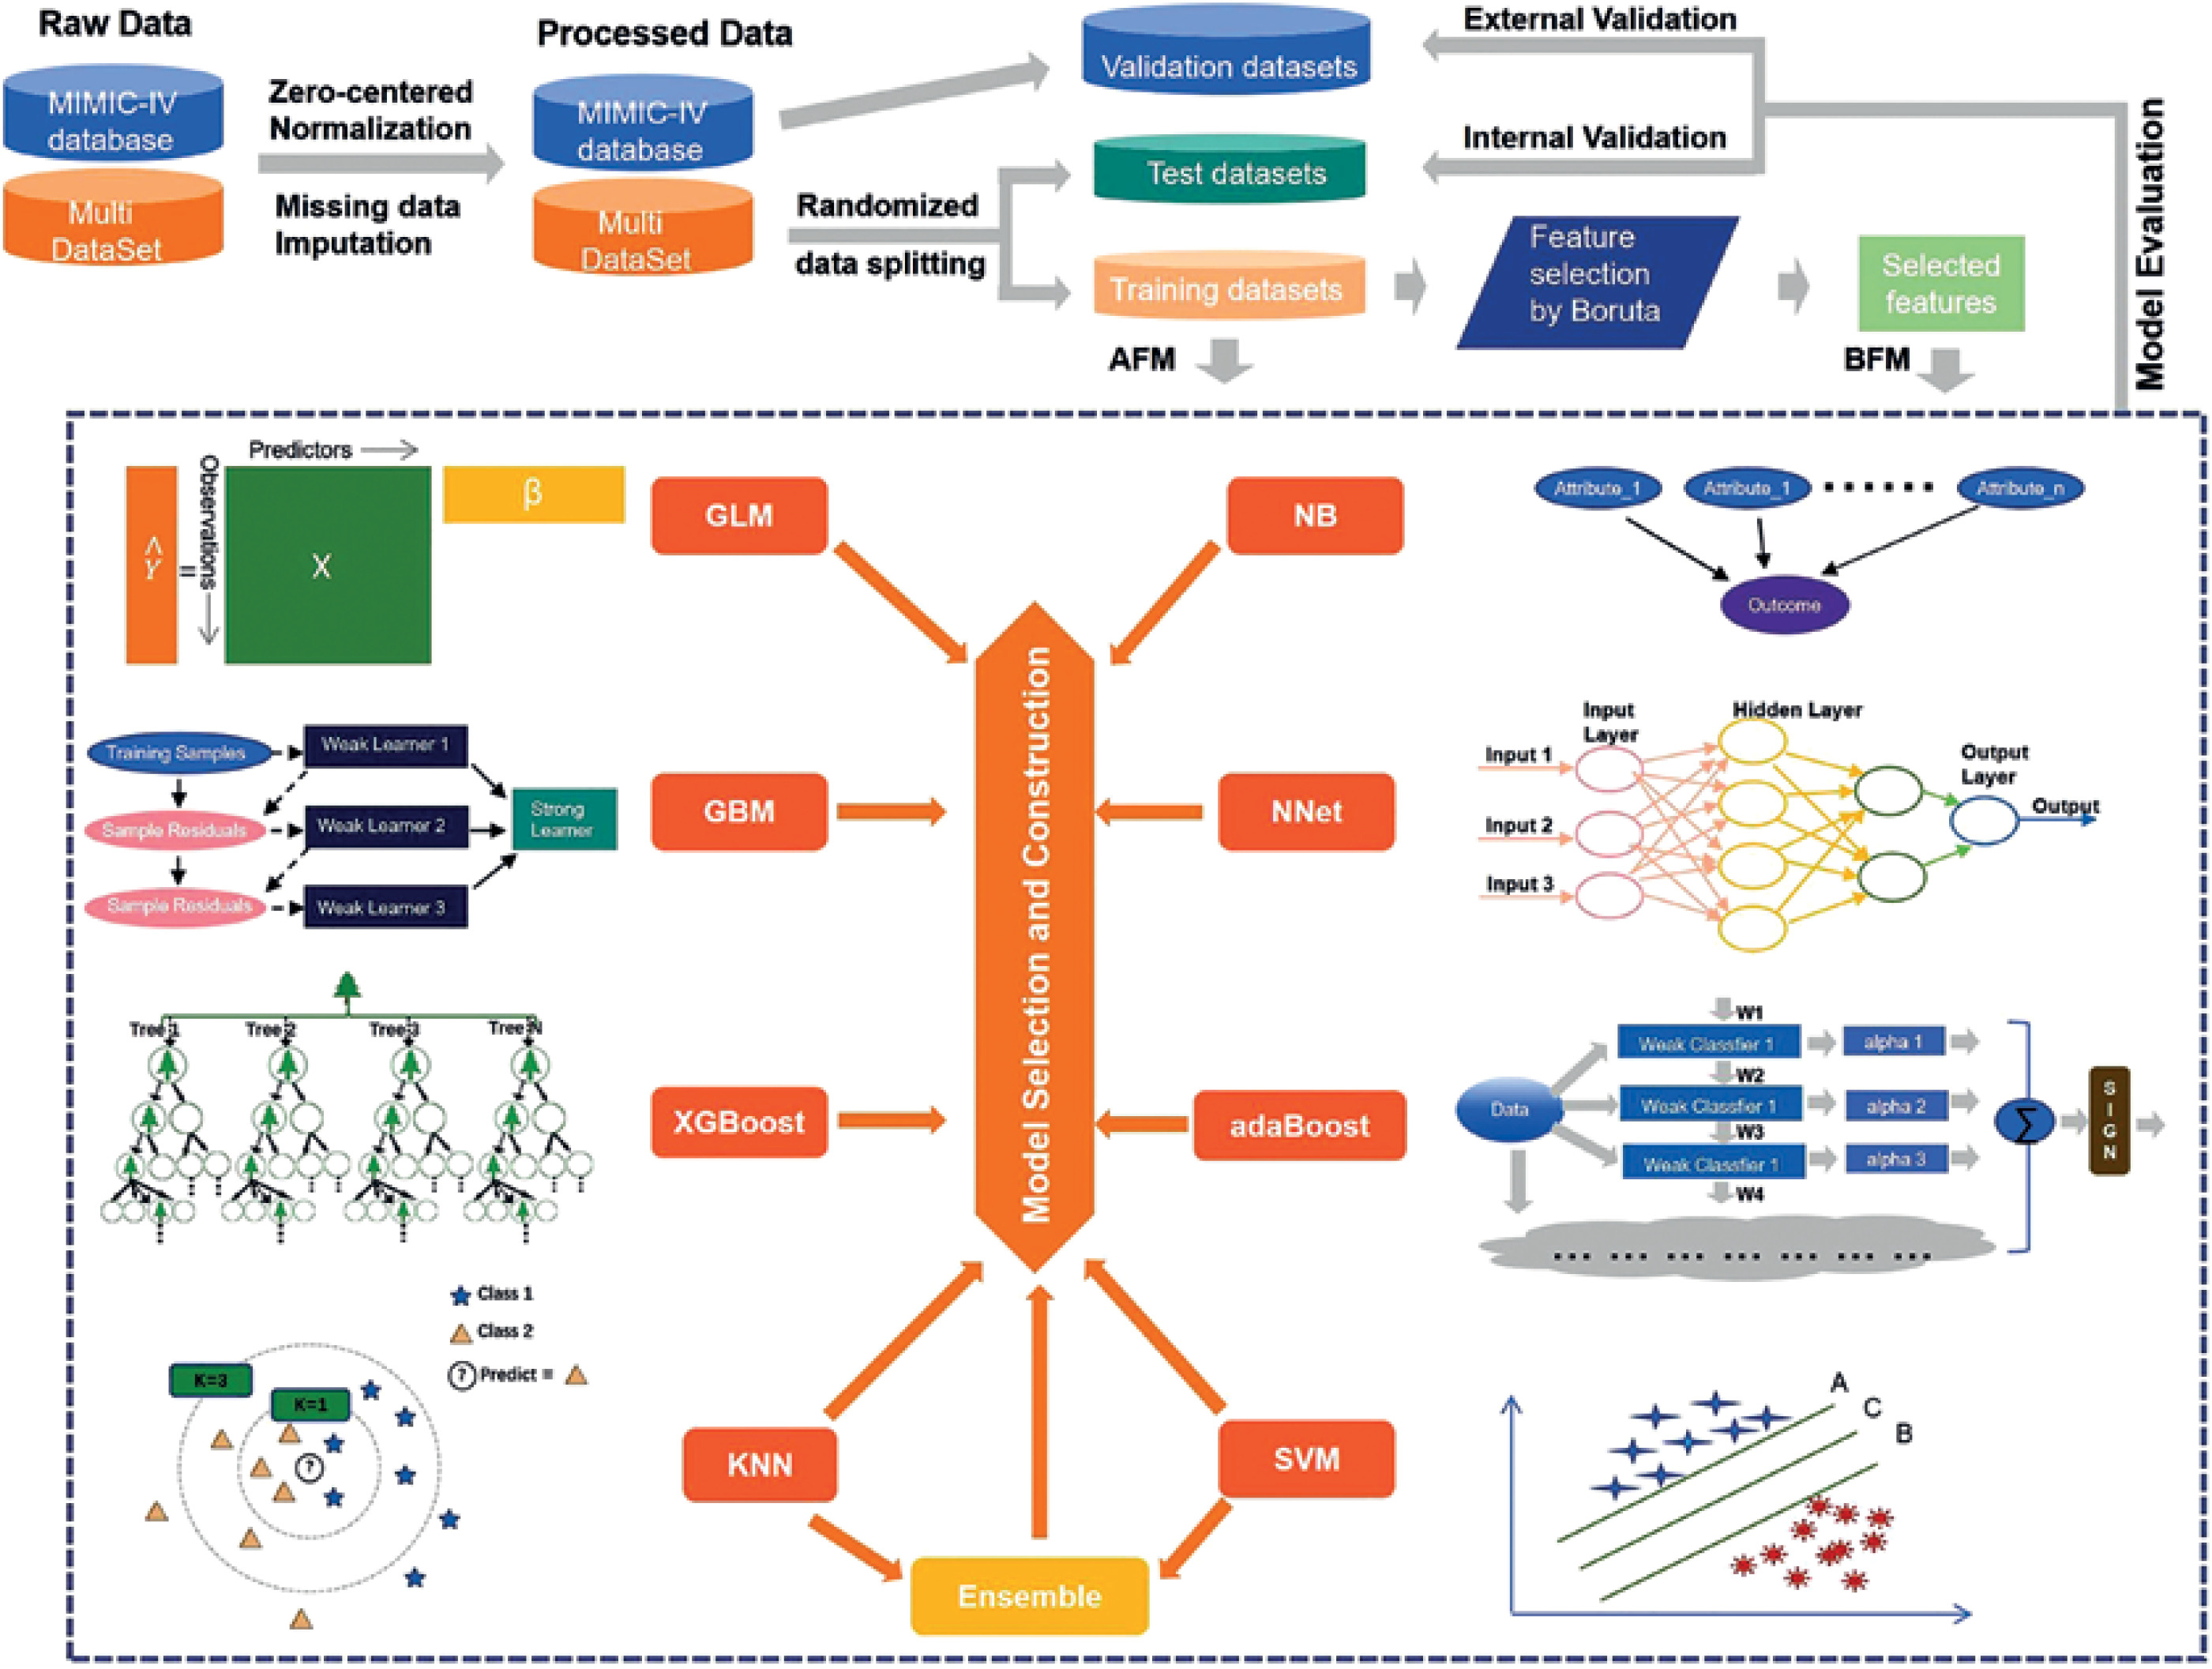
The whole process of the current study included data pre-processing, feature selection, model fitting and evaluation (Figure 1). Continuous variables were processed and standardized by normalization. After data pre-processing, the Multi dataset was randomly split into training (70%) and test (30%) datasets according to whether diagnosed with postoperative sepsis or not. Then feature selection and model fitting were conducted on the training dataset, while model evaluation was conducted on the test dataset for internal validation, and the MIMIC dataset for external validation.
Figure 1
Development flow from raw data to model fitting and evaluation
GBM – Gradient Boosting Machine, GLM – Generalized Linear Models, KNN – k-Nearest Neighbor, XGBoost – Extreme Gradient Boosting, NNET – Neural Network, SVM – Support Vector Machine, AdaBoost – Adaptive Boosting, NB – Naive Bayes, AFM – models based on all variables, BFM – models based on the variables selected by Boruta.
The preoperative clinical variables were selected based on the accessibility and the association with the progress of postoperative sepsis according to the experience of the physicians in the three academic hospitals. The laboratory results closest to the surgical day were used. The abdominal procedures were classified by the procedure approach and surgical site. Finally, the following features were extracted: (1) demographic features, including age, body mass index (BMI), sex; (2) comorbidities: chemotherapy, hypertension, diabetes, cardiopathy, chronic obstructive pulmonary diseases (COPD), nephropathy, cancer; (3) laboratory parameters: albumin, alanine aminotransferase (ALT), aspartate aminotransferase (AST), bilirubin, K+, creatinine, glucose, white blood cells (WBC), platelets, hemoglobin, neutrophils, lymphocytes, neutrophil-lymphocyte ratio (NLR); (4) surgical information: emergency surgery, ASA score, type of surgery, procedure site.
Missing data that occur in more than one variable present a special challenge. The patients with missing values more than 30% were excluded, while others were imputed with KNN through DMwR2 R Packages [22]. The distribution of variables before and after imputation was assessed to ensure consistency.
Model construction and importance ranking
Two types of models were constructed based on feature-selected variables and all variables respectively. Feature selection on the training dataset was completed with the Boruta algorithm [23]; when the median variable importance in the set runs was significantly higher or lower than the median of the maximum values for the shadow attribute (blue), the variable was confirmed as important (green) or rejected as unimportant (red); otherwise it was tentatively important (yellow). For comparison, we implemented eight conventional ML algorithms: Gradient Boosting Machine (GBM), Generalized Linear Models (GLM), KNN, Extreme Gradient Boosting (XGBoost), Neural Network (NNET), SVM, Adaptive Boosting (AdaBoost), and Naive Bayes (NB). The ensemble learning model was constructed from two individual models with better performance. The models based on the variables selected by Boruta were labelled the BFM group, while those based on all variables were labelled the AFM group. Meanwhile, to investigate the important variables associated with postoperative sepsis, importance ranking was conducted on the training dataset by the final model.
Model evaluation
The model evaluation process was conducted using R (version 4.2.2). After the construction, the models’ performance was evaluated by the area under curves (AUCs) of the receiver operating characteristic curves (ROC), and sensitivity, specificity, positive predictive value (PPV), negative predictive value (NPV), accuracy (ACC, the arithmetic means of sensitivity and specificity) and F1 score (the harmonic means of the precision and recall). Through the comparisons of the above metrics, the better two models were chosen to develop an ensemble learning model. Finally, the ensemble learning model was evaluated and compared with the single model through the net reclassification index (NRI), integrated discrimination improvement (IDI) and decision curve analysis (DCA), which were used to compare the models’ clinical benefits and utility [24–27]. Meanwhile, the calibration curve was also used to evaluate the models’ degree of calibration. Confidence intervals (CI) for model performance metrics were generated by bootstrap resampling of each dataset.
Statistical analysis
Continuous variables were expressed as mean with standard deviation (SD) or median with interquartile ranges (IQR) according to the data distribution. The categorical variables were expressed as frequency and percentages. The difference in clinical variables between positive and negative patients was compared by t test, ANOVA, Mann-Whitney test, or non-parametric test for continuous data, and the χ2 or Fisher exact test for categorical data. Two-tailed tests were employed throughout. P < 0.05 was considered to indicate statistical significance. All the analyses were performed using SPSS (version 26.0, IBM) and R (version 4.2.2).
Results
Descriptive characteristics
As shown in Figure 2, a total of 955 patients were included in our study (648 patients from the Multi dataset, 307 patients from the MIMIC dataset), of which 285 patients were diagnosed with postoperative sepsis. The comparisons of the general characteristics and preoperative laboratory results between the sepsis and non-sepsis group in Multi and MIMIC datasets are shown in Tables I and II, respectively. In these two datasets, patients in the sepsis group had older age, more comorbidities (cardiopathy, COPD and nephropathy), higher ASA score, higher creatinine, glucose, WBC, NLR, and lower albumin, hemoglobin, lymphocyte count, and frequency of emergency procedures, compared with those in the non-sepsis group (all p < 0.05).
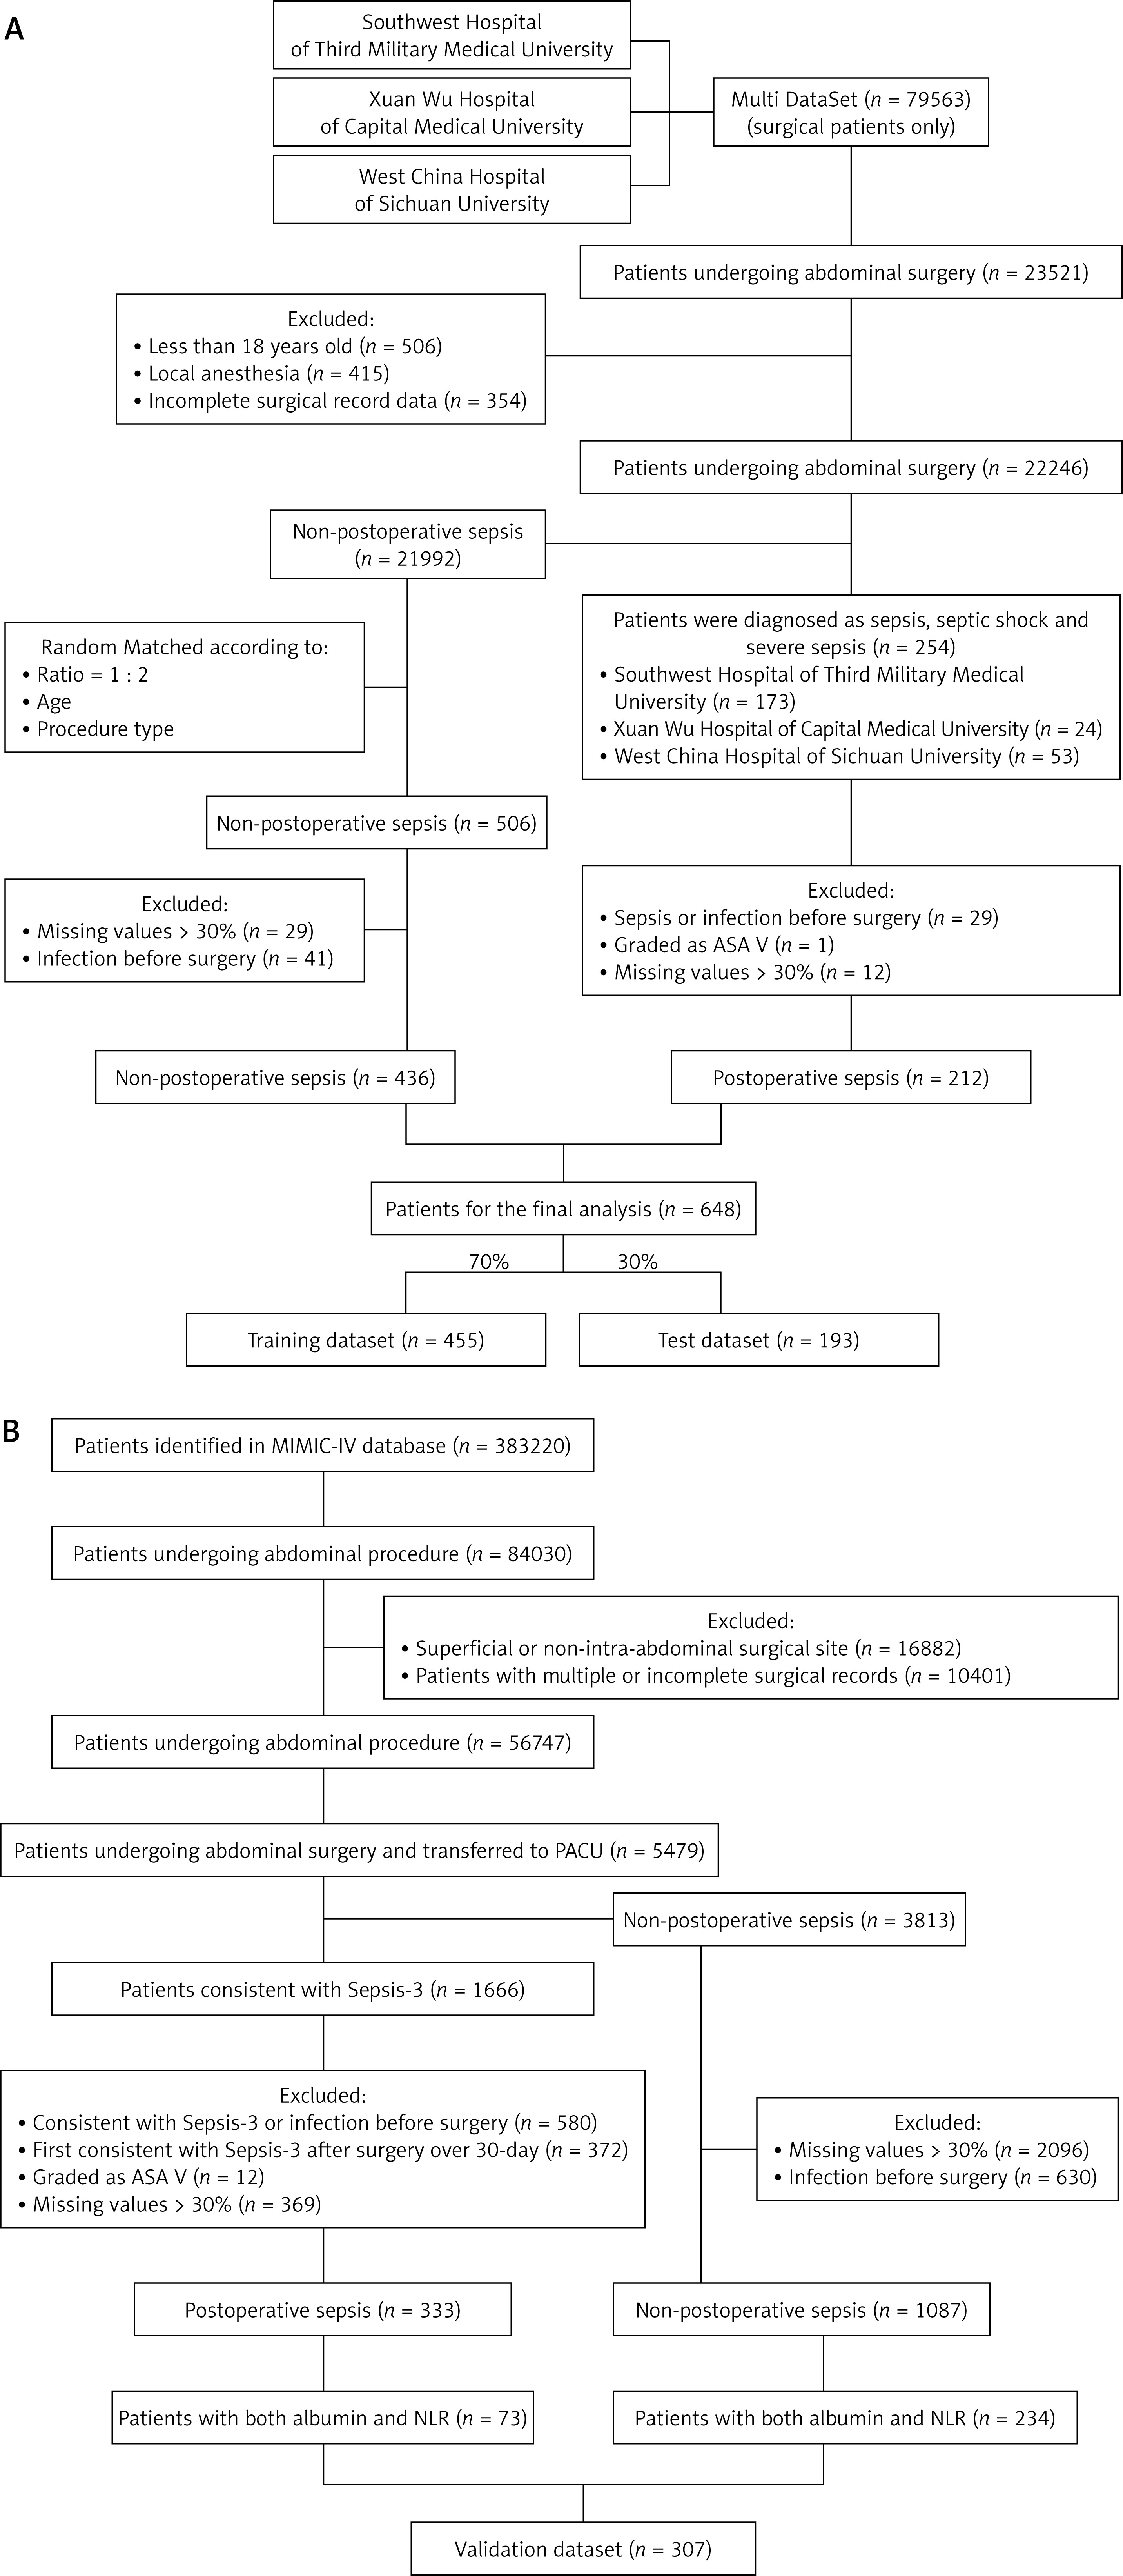
Table I
Baseline information of patients with or without postoperative sepsis in Multi dataset
Table II
Baseline information of patients with or without postoperative sepsis in MIMIC-IV dataset
[i] Data are expressed as number (proportion), mean (SD) or median (IQR [range]). BMI – body mass index, COPD – chronic obstructive pulmonary diseases, ALT – alanine aminotransferase, AST – aspartate aminotransferase, WBC – white blood cells, NLR – neutrophil-lymphocyte ratio, SD – standard deviation.
There are 9 variables with missing values after excluding the patients with missing data exceeding 30%. Among them, 8 were preoperative laboratory results (Supplementary Table SI). No significant difference between imputed and original data was found, with the distribution roughly the same (Supplementary Table SII). Patient demographics and characteristics between the Multi dataset (training dataset and test dataset) and MIMIC dataset (validation dataset) are presented in Supplementary Table SIII. The distribution was roughly the same between training and test datasets.
Model performance
As shown in Table III, the eight conventional machine learning models achieved relatively good performance in both the BFM and AFM groups on the internal validation (test) dataset, slightly inferior on the external validation dataset. All the models presented a decreasing trend from the test dataset to the validation data set. In this situation, in the validation dataset, only KNN and SVM have the ACC more than 65% in both the BFM and AFM groups. For BFM, KNN achieved the AUC of 0.758 (95% CI: 0.700–0.817) and ACC of 69.4% on the validation dataset. SVM yielded 0.761 (95% CI: 0.698–0.824) and ACC of 67.1% on the validation dataset. In the AFM group, KNN achieved the AUC of 0.744 (95% CI: 0.685–0.803) and the ACC of 70.7% on the validation dataset. SVM yielded 0.768 (95% CI: 0.706–0.830) and the ACC of 66.4% on the validation dataset. Meanwhile, KNN and SVM yielded the specificity of more than 65% in BFM. In AFM, KNN also has specificity over 65% and SVM has the specificity of 64.1% (Figure 3).
Table III
Performance of models based on different algorithms in BFM and AFM group
| Models based on selected variables by Boruta | |||||||
|---|---|---|---|---|---|---|---|
| Datasets | AUC (95% CI) | Sens (%) | Spec (%) | PPV (%) | NPV (%) | F1 score | ACC (%) |
| Model 1: GBM | |||||||
| Test | 0.886 (0.835–0.936) | 68.3 | 91.5 | 79.6 | 85.6 | 0.735 | 83.9 (77.9–88.8) |
| Validation | 0.762 (0.705–0.818) | 90.4 | 49.2 | 35.7 | 94.3 | 0.512 | 59.0 (53.2–64.5) |
| Model 2: GLM | |||||||
| Test | 0.876 (0.821–0.932) | 66.7 | 89.2 | 75.0 | 84.7 | 0.706 | 81.9 (75.7–87.0) |
| Validation | 0.737 (0.668–0.805) | 80.8 | 55.1 | 36.0 | 90.2 | 0.498 | 61.2 (55.5–66.7) |
| Model 3: KNN | |||||||
| Test | 0.860 (0.803–0.918) | 55.6 | 96.2 | 87.5 | 81.7 | 0.680 | 82.9 (76.8–87.9) |
| Validation | 0.758 (0.700–0.817) | 74.0 | 68.0 | 41.9 | 89.3 | 0.535 | 69.4 (63.9–74.5) |
| Model 4: XGBoost | |||||||
| Test | 0.873 (0.815–0.931) | 61.9 | 92.3 | 79.6 | 83.3 | 0.696 | 82.4 (76.3–87.5) |
| Validation | 0.747 (0.688–0.806) | 87.7 | 46.2 | 33.7 | 92.3 | 0.487 | 56.0 (50.3–61.7) |
| Model 5: NNET | |||||||
| Test | 0.876 (0.821–0.931) | 74.6 | 83.1 | 68.1 | 87.1 | 0.712 | 80.3 (74.0–85.7) |
| Validation | 0.747 (0.681–0.813) | 84.9 | 45.7 | 32.8 | 90.7 | 0.473 | 55.1 (49.3–60.7) |
| Model 6: SVM | |||||||
| Test* | 0.877 (0.820–0.934) | 60.3 | 92.3 | 79.2 | 82.8 | 0.685 | 81.9 (75.7–87.0) |
| Validation | 0.761 (0.698–0.824) | 74.0 | 65.0 | 39.7 | 88.9 | 0.517 | 67.1 (61.5–72.3) |
| Model 7: AdaBoost | |||||||
| Test | 0.877 (0.820–0.934) | 61.9 | 90.0 | 75.0 | 83.0 | 0.678 | 80.8 (74.6–86.1) |
| Validation | 0.761 (0.705–0.818) | 86.3 | 51.7 | 35.8 | 92.4 | 0.506 | 59.9 (54.2–65.5) |
| Model 8: NB | |||||||
| Test | 0.863 (0.805–0.920) | 74.6 | 83.1 | 68.1 | 87.1 | 0.712 | 80.3 (74.0–85.7) |
| Validation | 0.685 (0.610–0.760) | 82.2 | 22.7 | 24.9 | 80.3 | 0.382 | 36.8 (31.4–42.5) |
| Model 9: Ensemble Learning (KNN + SVM) | |||||||
| Test* | 0.892 (0.841–0.944) | 65.1 | 94.6 | 85.4 | 84.8 | 0.739 | 84.9 (79.1–89.7) |
| Validation† | 0.782 (0.726–0.838) | 76.7 | 65.4 | 40.9 | 90.0 | 0.533 | 68.1 (62.5–73.3) |
| Models based on all variables | |||||||
| Model 1: GBM | |||||||
| Test | 0.891 (0.842–0.939) | 65.1 | 91.5 | 78.9 | 84.4 | 0.713 | 82.9 (76.8–87.9) |
| Validation | 0.745 (0.686–0.805) | 86.3 | 50.4 | 35.2 | 92.2 | 0.500 | 59.0 (53.2–64.5) |
| Model 2: GLM | |||||||
| Test | 0.876 (0.821–0.932) | 66.7 | 89.2 | 75.0 | 84.7 | 0.706 | 81.9 (75.7–87.0) |
| Validation | 0.737 (0.669–0.805) | 79.5 | 54.7 | 35.4 | 89.5 | 0.489 | 60.6 (54.9–66.1) |
| Model 3: KNN | |||||||
| Test | 0.805 (0.738–0.872) | 42.9 | 95.4 | 81.8 | 77.5 | 0.563 | 78.2 (71.7–83.8) |
| Validation | 0.744 (0.685–0.803) | 67.1 | 71.8 | 42.6 | 87.5 | 0.521 | 70.7 (65.3–75.7) |
| Model 4: XGBoost | |||||||
| Test | 0.870 (0.816–0.923) | 63.5 | 90.0 | 75.5 | 83.6 | 0.690 | 81.4 (75.1–86.6) |
| Validation | 0.774 (0.717–0.831) | 83.6 | 53.0 | 35.7 | 91.2 | 0.500 | 60.3 (54.5–65.8) |
| Model 5: NNET | |||||||
| Test | 0.876 (0.822–0.929) | 74.6 | 83.9 | 69.1 | 87.2 | 0.718 | 80.8 (74.6–86.1) |
| Validation | 0.778 (0.718–0.838) | 94.5 | 42.7 | 34.0 | 96.2 | 0.500 | 55.1 (49.3–60.7) |
| Model 6: SVM | |||||||
| Test | 0.873 (0.817–0.928) | 61.9 | 93.9 | 83.0 | 83.6 | 0.709 | 83.4 (77.4–88.4) |
| Validation | 0.768 (0.706–0.830) | 74.0 | 64.1 | 39.1 | 88.8 | 0.512 | 66.4 (60.9–71.7) |
| Model 7: AdaBoost | |||||||
| Test | 0.873 (0.817–0.928) | 58.7 | 90.0 | 74.0 | 81.8 | 65.487 | 79.8 (73.4–85.2) |
| Validation | 0.779 (0.725–0.834) | 80.8 | 56.8 | 36.9 | 90.5 | 50.644 | 62.5 (56.9–68.0) |
| Model 8: NB | |||||||
| Test | 0.858 (0.801–0.915) | 73.0 | 80.8 | 64.8 | 86.1 | 68.657 | 78.2 (71.7–83.8) |
| Validation | 0.709 (0.639–0.780) | 86.3 | 23.5 | 26.0 | 84.6 | 40.000 | 38.4 (32.7–44.1) |
| Model 9: Ensemble Learning (KNN + SVM) | |||||||
| Test | 0.877 (0.822–0.931) | 58.7 | 94.6 | 84.1 | 82.6 | 69.159 | 82.9 (76.8–87.9) |
| Validation† | 0.772 (0.713–0.831) | 76.7 | 65.8 | 41.2 | 90.1 | 53.589 | 68.4 (62.9–73.6) |
GBM – Gradient Boosting Machine, GLM – Generalized Linear Models, KNN – k-Nearest Neighbor, XGBoost – Extreme Gradient Boosting, NNET – Neural Network, SVM – Support Vector Machine, AdaBoost – Adaptive Boosting, NB – Naive Bayes;
Figure 3
ROCs of SVM, KNN, and ensemble learning models in test and validation datasets
KNN – k-Nearest Neighbor, SVM – Support Vector Machine, AFM – models based on all variables, BFM – models based on the variables selected by Boruta.
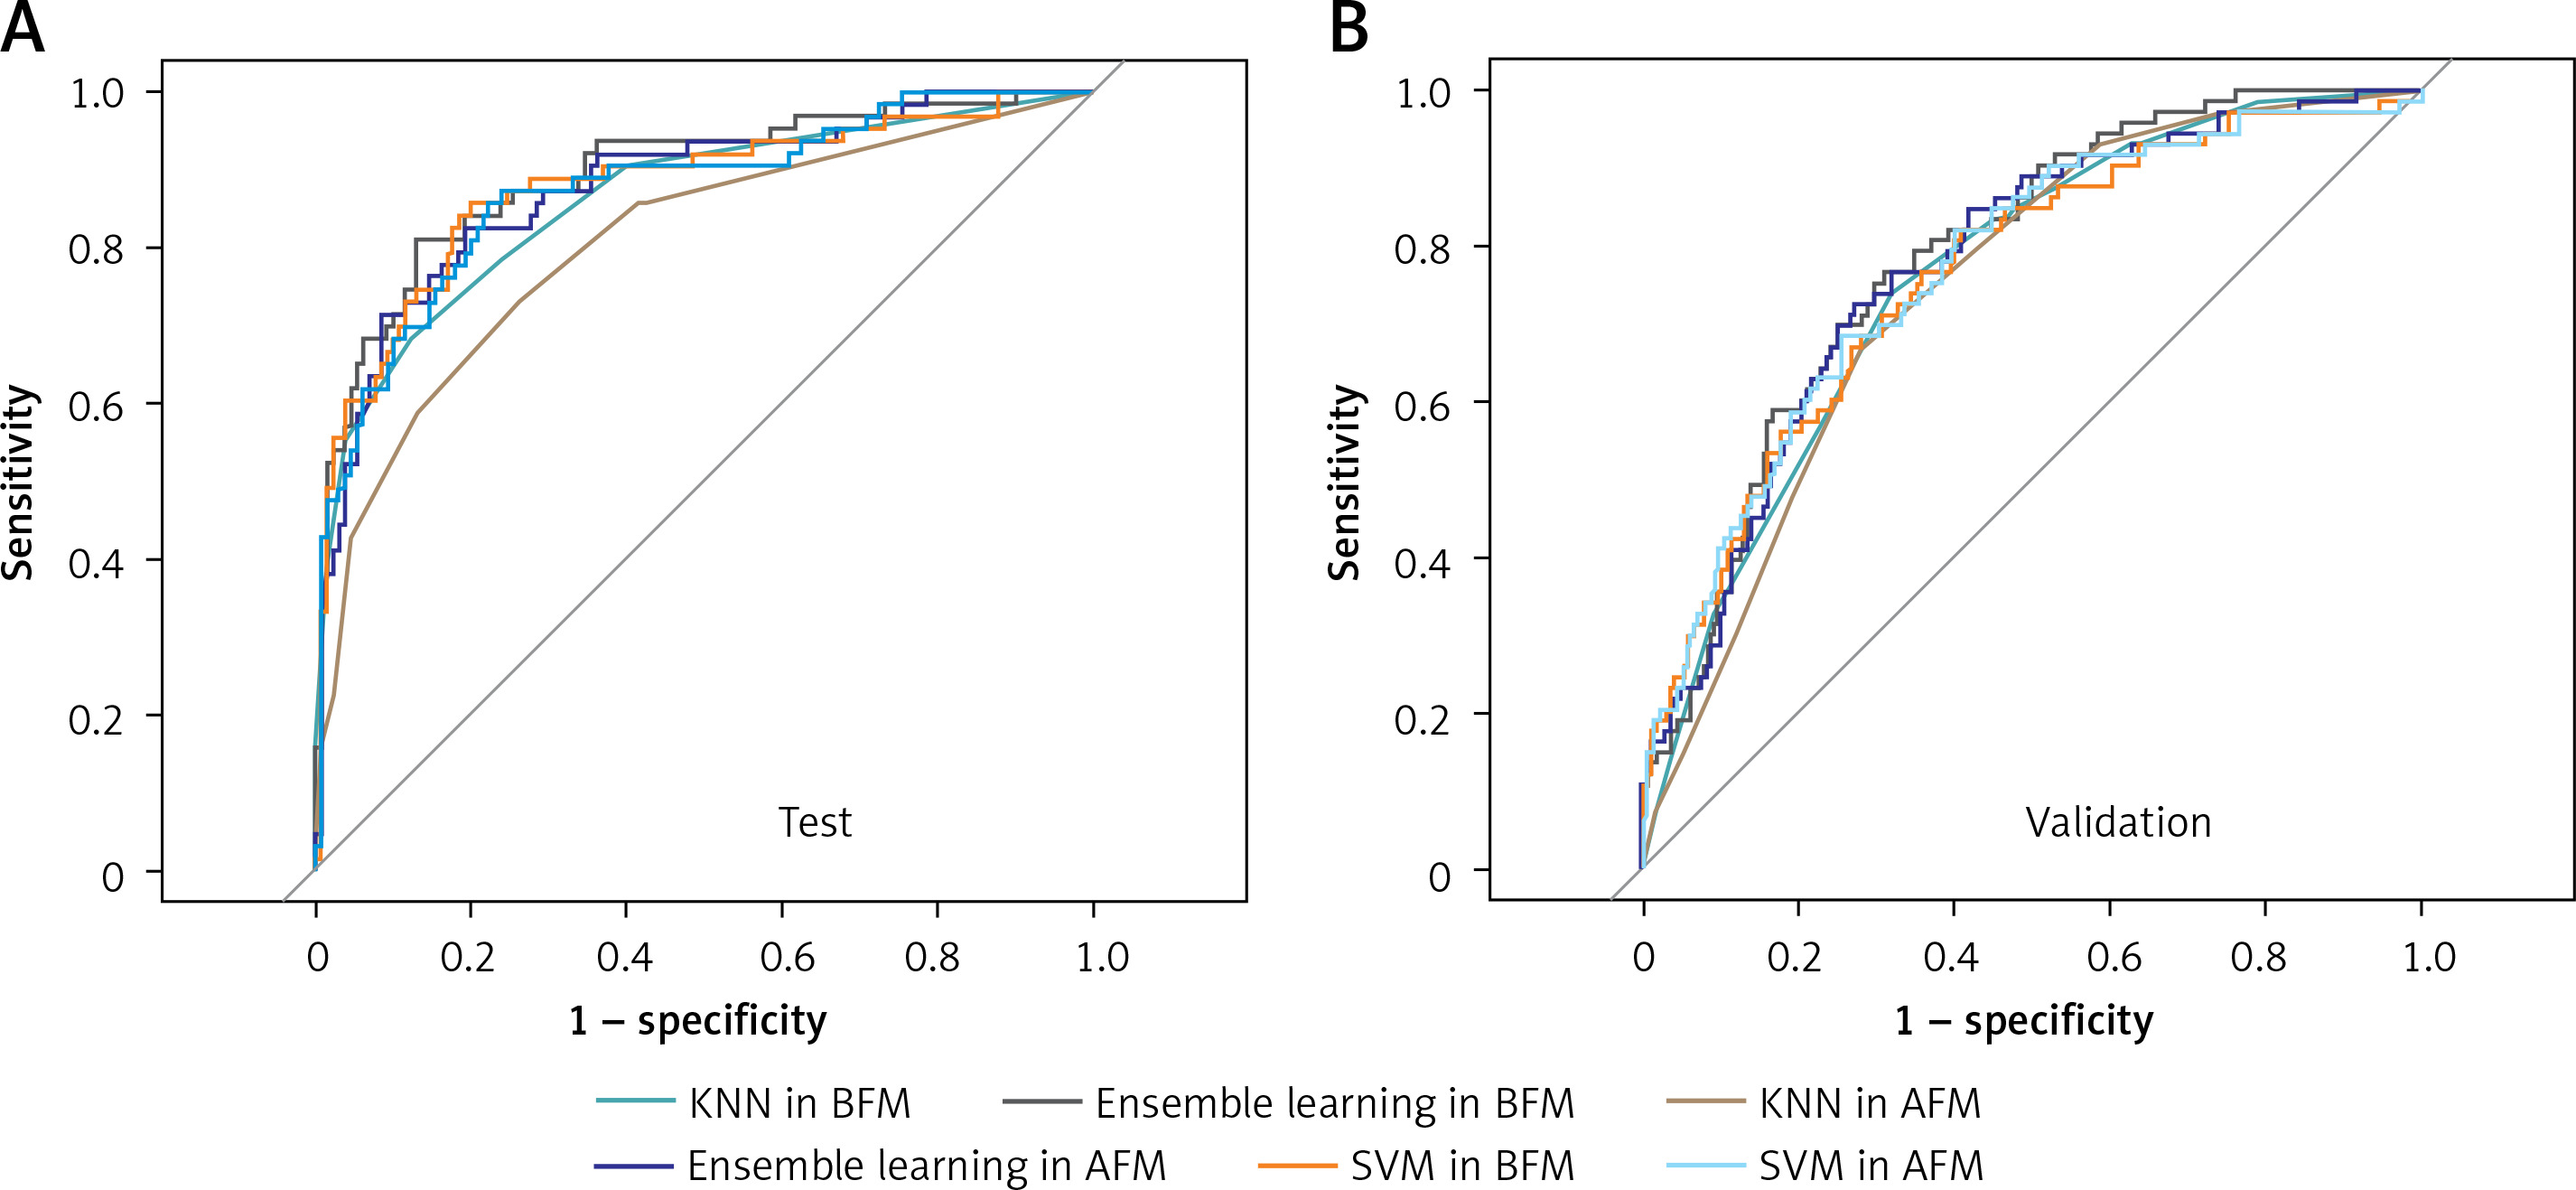
The ensemble learning model was constructed by creating a linear blend of KNN and SVM. In BFM, the ensemble learning model yielded the AUCs of 0.892 (95% CI: 0.841–0.944) and 0.782 (95% CI: 0.727–0.838) on the test and validation dataset, respectively. In AFM, the AUCs were 0.877 (95% CI: 0.822–0.931) and 0.772 (95% CI: 0.713–0.831).
The NRI, IDI and DCA were used to compare the clinical benefits and utility among KNN, SVM and ensemble learning models. The ensemble learning model in BFM performed better than that in AFM; the NRI and IDI values were 0.064 and 0.023 on the test dataset, 0.846 and 0.585 on the validation dataset, respectively. In addition, in the BFM group, compared with the single model (KNN and SVM), the NRI values of the ensemble learning model were 0.080 and 0.215 on the test dataset, 0.002 and 0.036 on the validation dataset, while the IDI values were 0.016 and 0.090 on the test dataset, 0.020 and 0.033 on the validation dataset. As shown in Figure 4, the ensemble learning model in the BFM group performed better on calibration than the other models. In addition, when the threshold is 50%, the ensemble learning model performs better in the net benefit on both test and validation datasets. It indicated that the ensemble learning model had greater accuracy and clinical utility than the single models or those based on all features.
Figure 4
DCAs and calibration curves of SVM, KNN, and ensemble learning models in test and validation datasets
KNN – k-Nearest Neighbor, SVM – Support Vector Machine, AFM – models based on all variables, BFM – models based on the variables selected by Boruta.
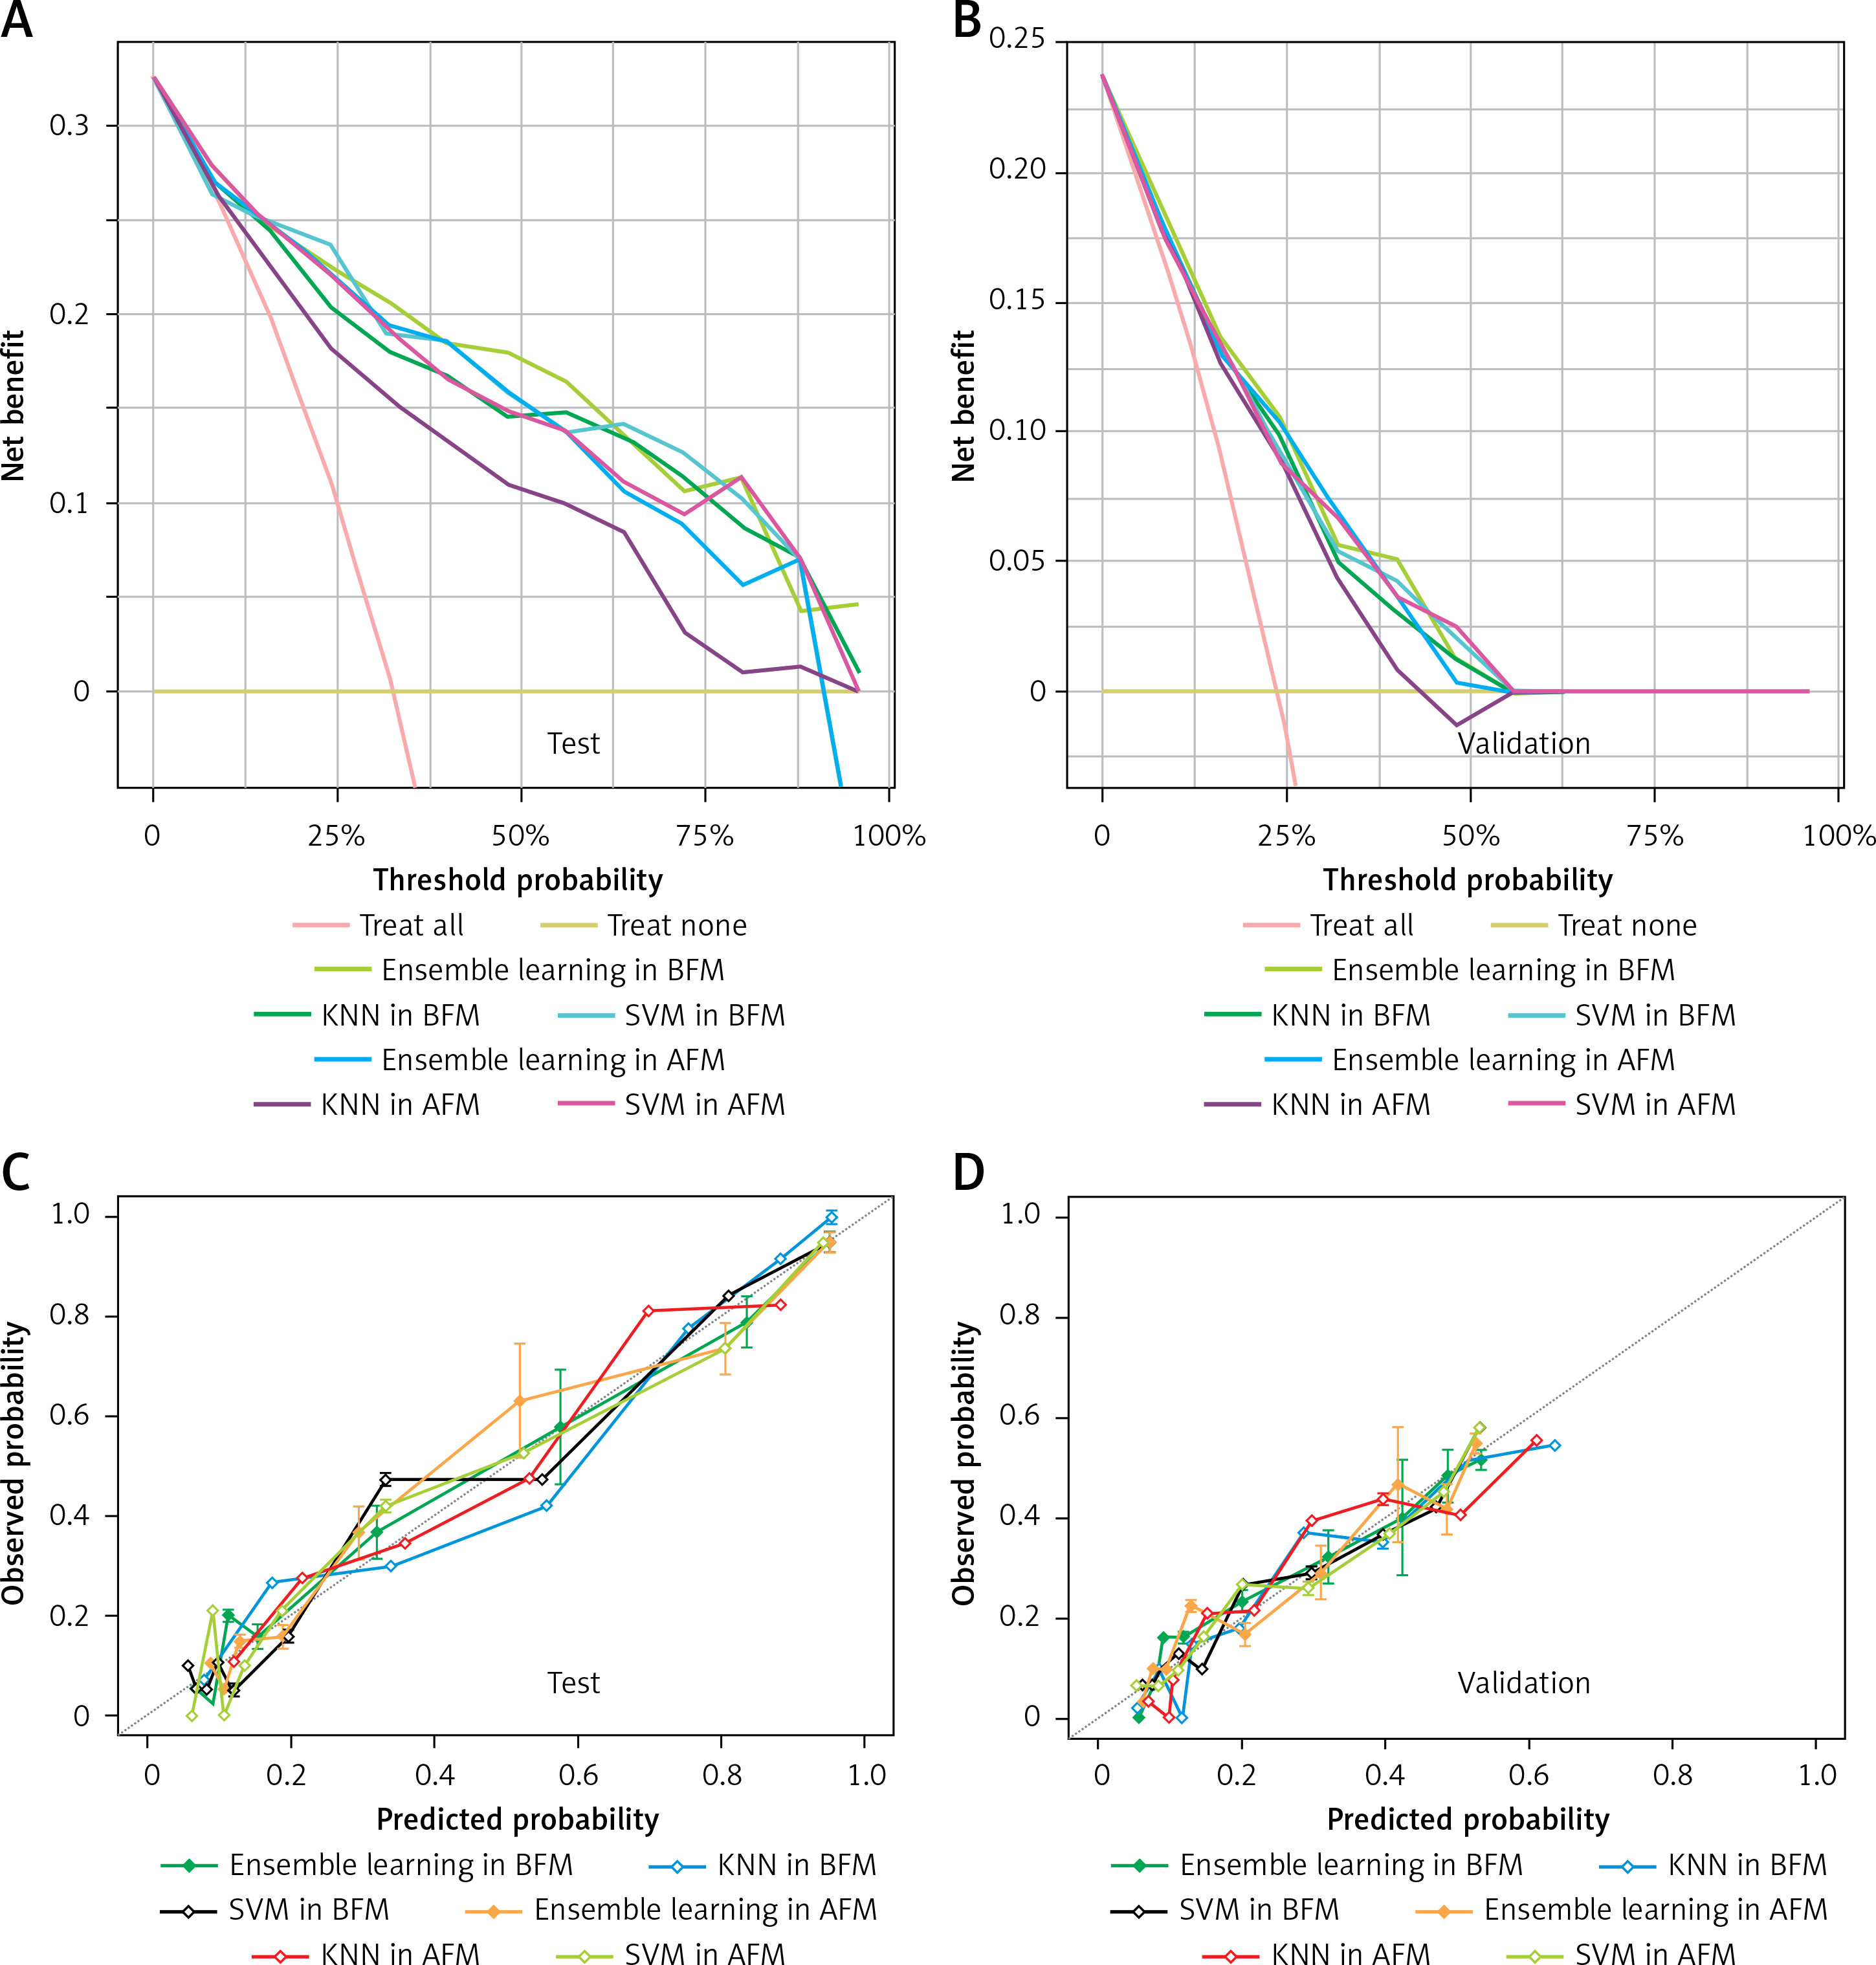
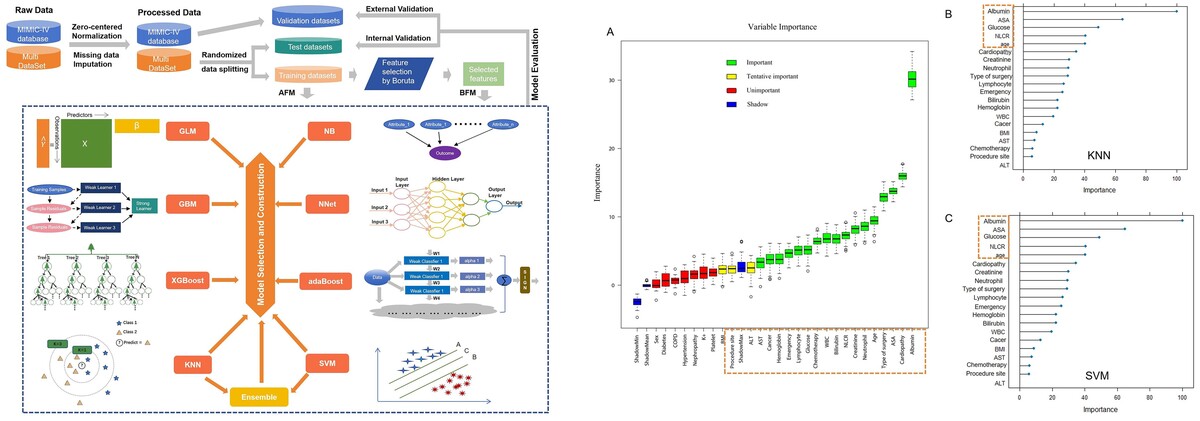
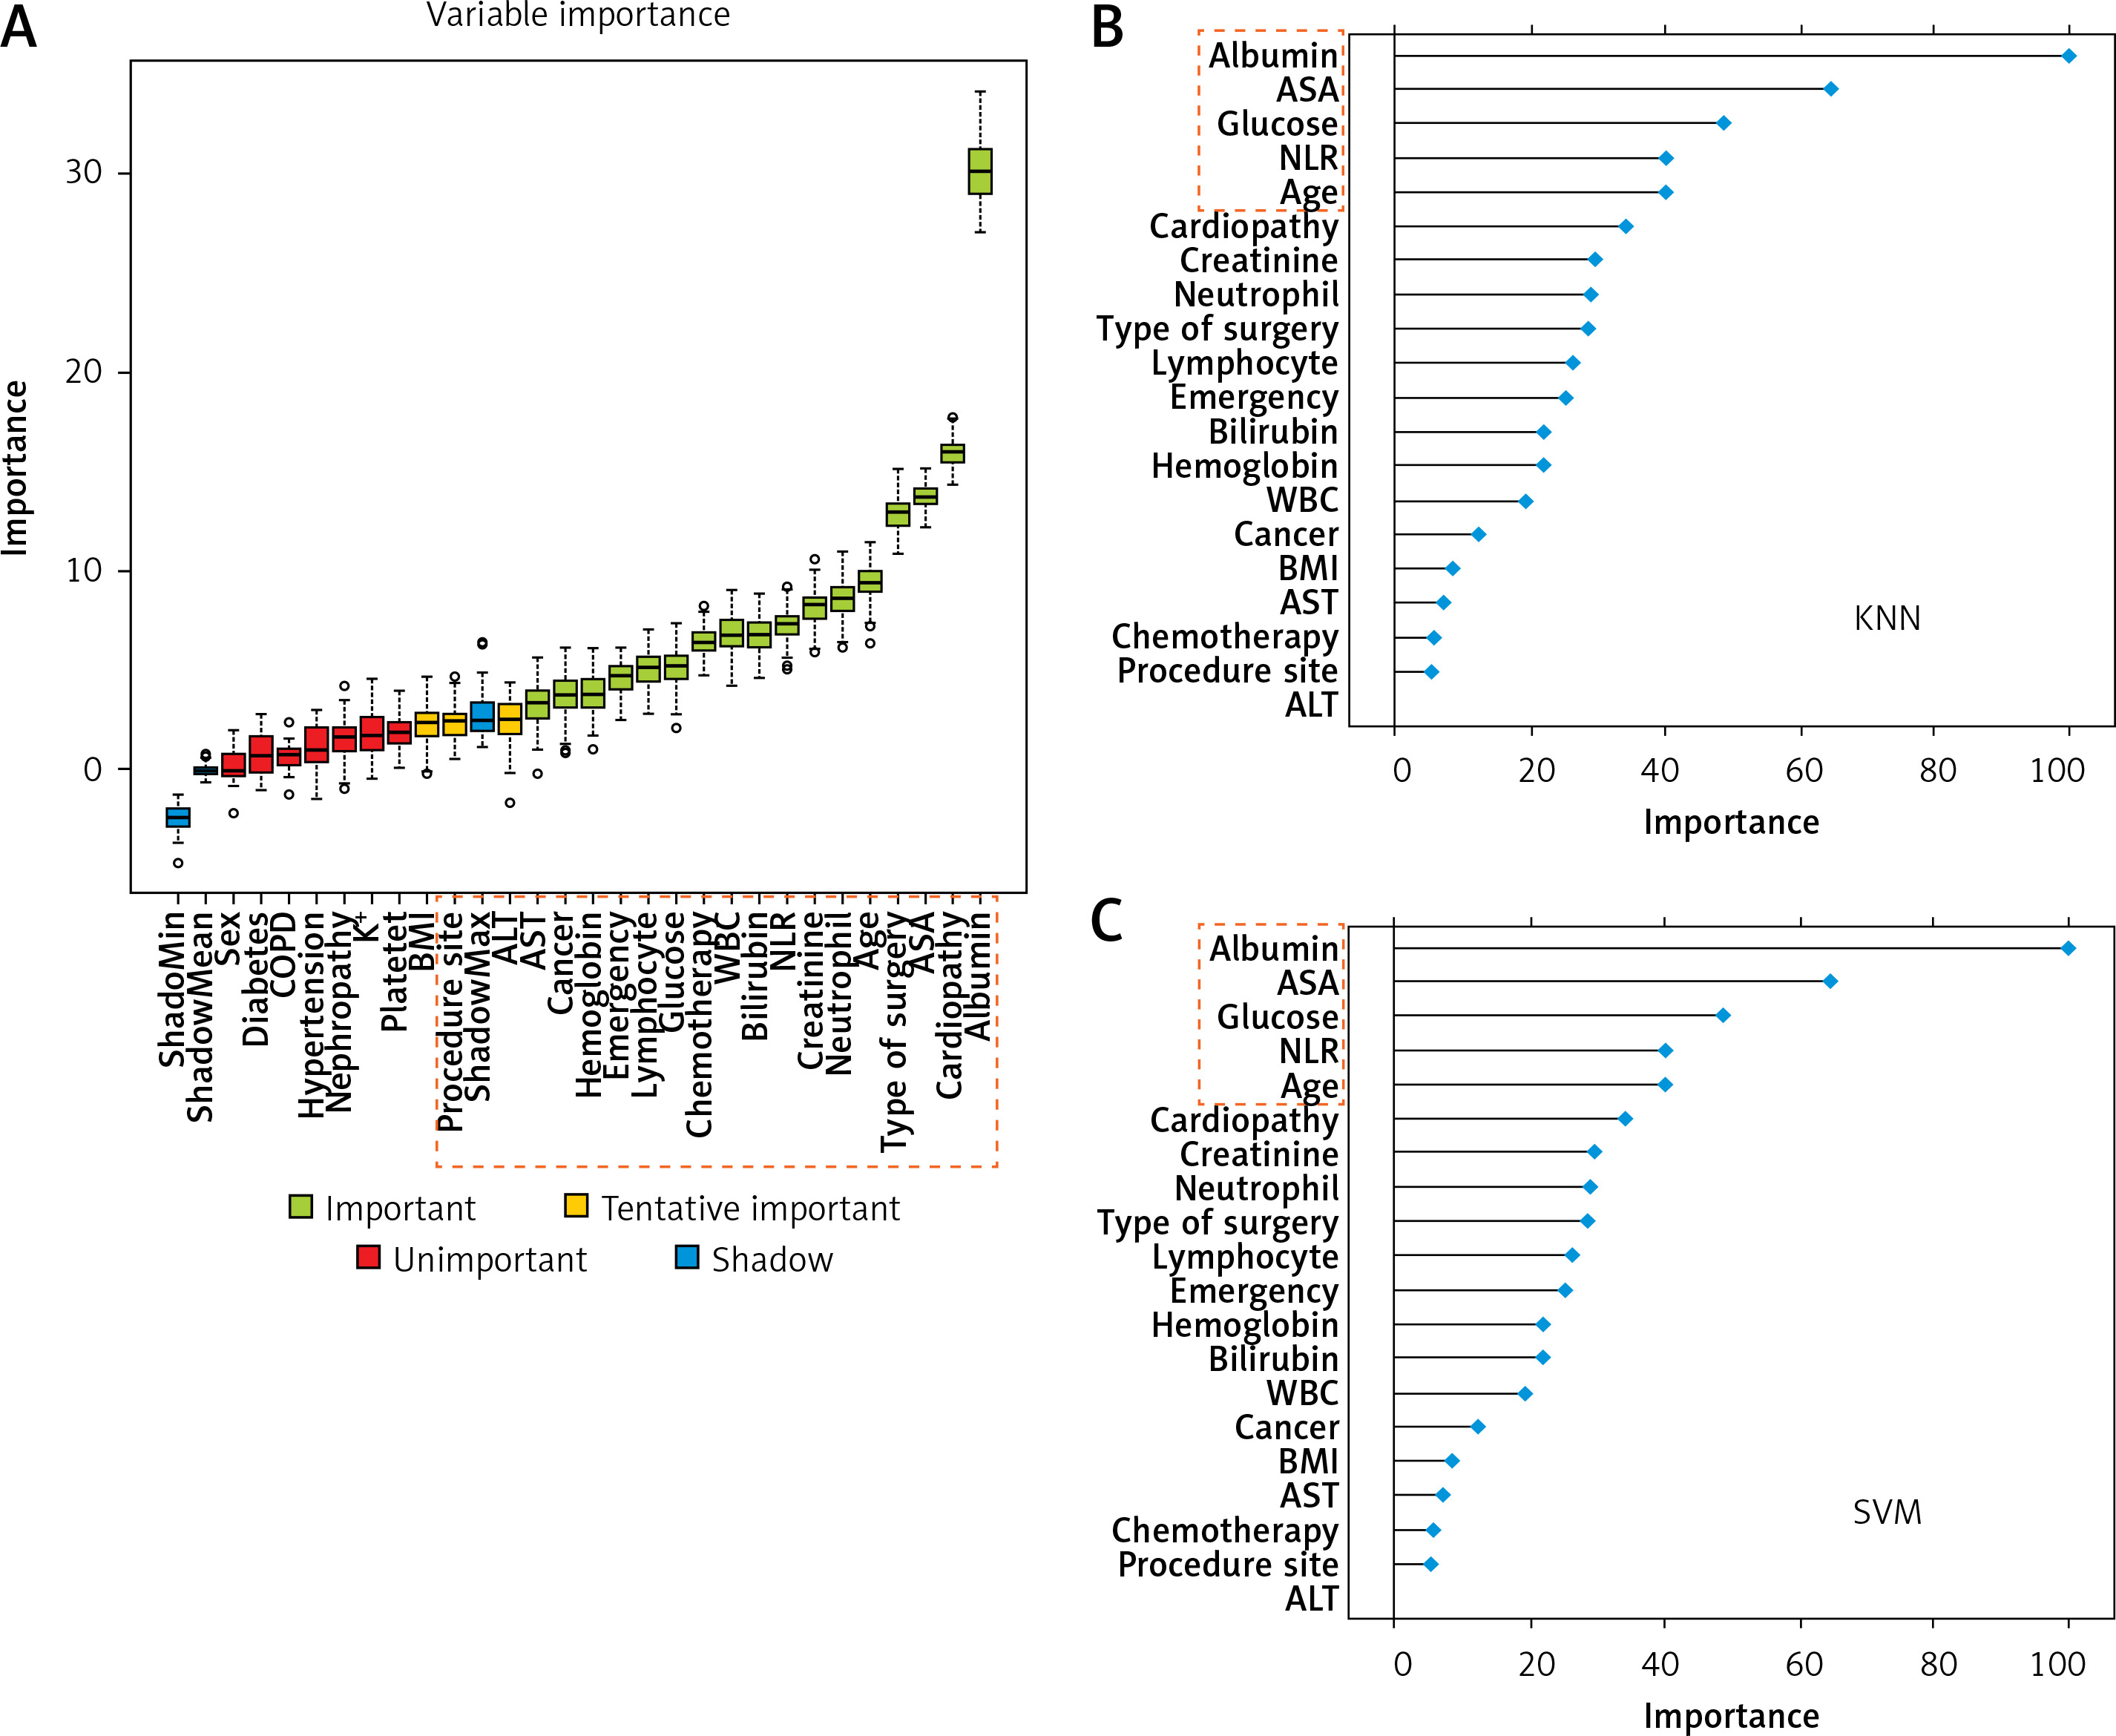
Figure 5
Results of feature selection and importance ranking. A – Feature selection by Boruta. The red box was rejected, the yellow one was tentative, and the green one was confirmed as important. Meanwhile, the rectangular box with red dotted line represents the variables selected for model construction. B – Feature importance ranking calculated by derivation from KNN on the training dataset. The rectangular box with red dotted line represents the top ranked features that were correlated with postoperative sepsis. C – Feature importance ranking calculated by derivation from SVM on the training dataset. The rectangular box with red dotted line represents the top ranked features that were correlated with postoperative sepsis
KNN – k-Nearest Neighbor, SVM – Support Vector Machine, BMI – body mass index, COPD – chronic obstructive pulmonary diseases, ALT – alanine aminotransferase, AST – aspartate aminotransferase, WBC – white blood cells, NLR – neutrophillymphocyte ratio.
Feature selection and importance analysis
As shown in Figure 5 A, albumin, cardiopathy, ASA score, type, age, neutrophil, creatinine, NLR, bilirubin, WBC, chemotherapy, glucose, lymphocyte count, emergency, hemoglobin, cancer, and AST were confirmed as important by Boruta. ALT, site, and BMI were found to be tentatively important. These variables were used for model construction and fitting, while others were rejected as unimportant.
Meanwhile, according to the results of each feature’s contribution determined by KNN and SVM, the importance ranking of the selected variables in the actual model was also conducted (Figures 5 B, C). Albumin, ASA score, NLR, age and glucose were identified as the top-ranking features associated with postoperative sepsis.
Discussion
In this study, we developed models using ML algorithms based on routine variables from the Multi dataset to predict the risk of postoperative sepsis for patients undergoing abdominal surgery, and externally validated the models on the MIMIC IV dataset. It may help doctors preoperatively screen patients at high risk for postoperative sepsis, then provide timely management, eventually benefiting surgical patients. Lower albumin, higher ASA score, older age, higher NLR, and higher glucose were the important indicators associated with postoperative sepsis, suggesting that doctors should pay more attention to them preoperatively.
Early recognition is particularly important as prompt management of septic patients may improve outcomes [28]. The Implementation of National Early Warning Score (NEWS), one of the best early warning scores for sepsis in England, was confirmed to reduce mortality in the suspicion of sepsis cohort [29]. Moreover, Croft et al. reported that applying a computerized sepsis management system would increase early recognition by 12% and reduce hospital mortality by 6% [30].
With the growing attempts and endeavors for applying ML algorithms as new tools to solve medical problems, the quality of data, and the generalizability and robustness of models are the main limitations for application to real-world data. To some extent, the quality of data from the real world is the main problem; it includes the limited number of positive cases, heterogeneity of data, and numerous missing data. As we described above, the incidence of postoperative sepsis is low both in the current study and other existing ones, which may be one of the reasons that research on preoperatively screening patients at high risk of postoperative sepsis is limited. The heterogeneity of medical data is widely accepted, as the incidence of postoperative sepsis varies among medical centers and countries, and representative datasets are sorely needed to enhance the generalizability and robustness of models. However, most of the existing studies were conducted on single-center datasets or public datasets due to data availability and standardization [8–10]. To address the growing need, we made efforts to improve the robustness of our model via multi-source data. Our data were extracted from three representative large-scale academic hospitals in China. Moreover, most of the previous studies only performed internal validation [7, 8], which resulted in the unclear robust performance of the established models. In this study, we also used the MIMIC IV dataset as a validation dataset to perform external validation, which was quite different from our multi-source data. On the other hand, most real-world data have missing values, especially the multicenter studies, as well as MIMIC IV. Only a few studies using their own hospital data allow data sharing [31], which may aggravate the limitations on screening for postoperative sepsis. The lack of high-quality data and scarcity of models developed or validated in middle- or low-income countries are likely promoting inequality in healthcare. Herein, we excluded patients with more than 30% missing data to make the selected feature relatively integrated. Also, KNN was used to impute missing values for cases with less than 30% missing to increase volumes. By collecting the routine structured data and preprocessing the missing data, the data quality was increased, and our model may be applied in other centers. For increasing the robustness and generalizability of the model, the ML algorithms used were also important. Besides constructing single conventional ML models, we chose the best two to build an ensemble learning model through the caretEnsemble R package.
According to the results of NRI and IDI, the ensemble learning model was comparable to KNN and SVM. However, based on calibration curves and DCA curves, the ensemble learning model performed better than KNN and SVM. Ensemble learning could flexibly assemble prediction models to build an accurate one, which has been shown effective in many applications [32, 33]. Likewise, the relatively satisfactory model performance manifested in our study indicated its potential for real-world medical datasets.
Compared with other existing studies, we had several advantages. Studies for predicting postoperative sepsis are scarce. Among them, most were for a single surgical type, or based on single-center data, or not for preoperatively screening high-risk patients, or used non-routine variables, or had no external validation. Bunn et al. developed a tool to screen patients at high risk for postoperative sepsis based on LR, RF, XGboost and support vector machine (SVM) algorithms with a total of 223,214 appendectomies from the national surgery quality improvement program database (NSQIP). However, it achieved only moderate discrimination ability (a maximum AUC of 0.7) on a test dataset [7]. Zhang et al. developed a postoperative sepsis scoring tool for hepatobiliary and pancreatic surgery from a single-center dataset based on the LR algorithm, but, due to the unbalance of data (total patients: 522, postoperative sepsis: 55), the PPV was only 35% [8]. Moreover, some variables used for model development, such as interleukin and TNF-α, are not routine, which further affected the promotion of this tool [8, 15]. Our model was developed and evaluated on representative multicenter data, and variables were all preoperative and routine. Furthermore, the performance of our model was relatively satisfactory, with external validation in the MIMIC dataset acceptable. Therefore, our model has greater potential for application to other centers for preoperative screening of patients at high risk for postoperative sepsis.
Feature selection and importance ranking help elevate the model’s performance and interpretability. In the current study, we chose the variables associated with the progression of postoperative sepsis based on the literature or experience of the physicians for the initial analysis. Then, feature selection was conducted using the Boruta algorithm, which is powerful, fast, and robust for both high-dimensional and low-dimensional datasets [23]. After model construction and fitting, we also ranked the importance of selected variables. Taking the rank by Boruta and importance ranking into consideration, the top 5 predictors were found to be the most important for postoperative sepsis. They were albumin, ASA score, NLR, age and glucose. Among these features, lower albumin, higher ASA score, and older age reflect the poor physiological state of the patient. Intact innate and adaptive immune responses depend on albumin, and low albumin is associated with increased risks of severity and death in patients with severe sepsis or organ failure [34]. NLR, a biomarker of systemic inflammation, indicates the balance between neutrophil and lymphocyte counts, and high NLR may indicate unfavorable prognoses in patients with sepsis [35, 36]. High glucose levels at sepsis onset have been proved to be independently associated with a worse prognosis, irrespective of the presence or absence of preexisting diabetes [37, 38]. Despite several features not actually being abnormal, it is recommended that anesthesiologists and surgeons pay more attention to them and adjust them to appropriate levels before surgery. The other variables selected for final analysis in our study, such as creatinine, neutrophil, WBC, ALT, and cardiopathy, are known to be clinically associated with postoperative sepsis [39–42]. Due to the important roles of albumin and NLR (these two variables were missing in more than 70% of the MIMIC-IV dataset), patients without albumin or NLR were excluded during data processing. Especially, anesthesiologists and surgeons could complete these two examinations before surgery, as both of them are routine and accessible.
There are a few limitations of this study. First, every effort was made to collect all patients with postoperative sepsis, but the amount of data is still relatively small compared with other big-data studies, and a larger volume of data is needed to improve the robustness. Second, this is a retrospective study, which may have the problems of missing data and inaccurate diagnosis and can only establish associations between factors, rather than causality. Prospective multicenter studies should be carried out to validate our model in the near future.
In conclusion, we confirm the feasibility of using an ensemble learning model based on KNN and SVM to accurately predict postoperative sepsis in patients undergoing abdominal surgery based on routine preoperative indicators. Meanwhile, albumin, ASA score, age, NLR, and glucose were considered as the important variables, suggesting that doctors should pay more attention to these variables preoperatively.