Introduction
Breast cancer, as a malignant tumor, poses a severe threat to women’s life and health. During the period from 2014 to 2018, the incidence of breast cancer continued to rise, and it has now become the most prevalent malignant tumor among women [1, 2]. Neoadjuvant therapy (NAT) can help reduce staging and shrink tumors, thereby potentially facilitating subsequent surgical treatment [3, 4]. This significantly improves patients’ event-free survival (EFS) and overall survival (OS) [5]. Thus, it is becoming one of the standard treatment approaches for breast cancer patients [6].
The Residual Cancer Burden (RCB) assessment system was first introduced in 2007. As a continuous numerical value, it comprehensively analyzes the two-dimensional size of the largest residual tumor, the proportion of tumor cells, and the status of lymph node metastasis [7]. This system enables a more comprehensive and effective evaluation of the effectiveness of NAT and patient prognosis in breast cancer [8]. Studies have shown that the pathologic complete response (pCR) after NAT can serve as a marker for patients’ disease-free survival (DFS) and OS [9, 10]. The team of researchers led by Christina Yau from the University of California, San Francisco, published a multicenter retrospective study in The Lancet: Cancer, revealing that for each unit increase in RCB score, there is an 82% increase in the risk of recurrence, metastasis, or death in breast cancer patients (HR = 1.82), and researchers believe that RCB scoring and grading can independently predict the long-term survival of breast cancer patients in various clinical research centers and within different breast cancer subgroups [10].
However, in clinical practice, not all patients can achieve pathological relief after receiving NAT, and some patients do not respond effectively to NAT, while the condition may even worsen in some cases [11]. Therefore, numerous biological indicators have been proposed for predicting the effectiveness of NAT [12, 13]. As we know, histological type, histological grade, molecular subtypes, estrogen receptor (ER), progesterone receptor (PR), human epidermal growth factor receptor-2 (HER2), and Ki67 in breast cancer tissues are all related to patients’ response to NAT [14]. However, due to the heterogeneity of tumors, the responsiveness to treatment is not always consistent among different patients [15]. Further exploration is necessary to identify more precise prognostic markers, providing a theoretical basis for the clinical prognosis assessment of breast cancer and thus enabling correct and effective personalized treatment.
Over the past decade, with the advancement of computer technology, machine learning has made substantial progress in the field of medicine, especially in computer-aided screening, precise diagnostics, and treatment decisions. Machine learning offers a new approach to assist clinicians in classifying medical information and images. Pathologists can extract information about the tumor from pathological slides of tumor tissue. Through visual inspection and evaluation based on diagnostic criteria and their accumulated diagnostic experience, they assess the pathological grading of the tumor. However, due to variations in pathologists’ experiences, this diagnostic model still lacks specificity and efficiency.
Recently, researchers from Southwest Medical University developed a multi-scale fusion model based on the Support Vector Machine (SVM) algorithm, combining computed tomography (CT) and whole-slide images (WSI) images of breast cancer patients. This model is designed for predicting the pCR after neoadjuvant chemotherapy (NAC) [16]. However, the assessment of pCR in breast cancer patients who received NAC in this study is based on clinical doctors’ experience. The evaluation criteria are not standardized in pathological practice, making it challenging to accurately distinguish various degrees of tumor residue. We decided to evaluate the efficacy of NAT for breast cancer using pathological characteristics combined with RCB scoring. We categorized RCB 0-I as the significantly effective therapy group (NAT-sensitive), and RCB II–III as the group showing a less significant response to therapy (NAT-resistant) [7].
Therefore, based on WSI of breast cancer hematoxylin and eosin (H&E) stained slides and pathological analysis methods, we established a model to classify the chemotherapy outcomes after breast cancer NAT. The aim was to identify patients who can achieve a good chemotherapy response, providing guidance for clinicians in devising personalized treatment strategies.
Material and methods
H&E slicer
Research design
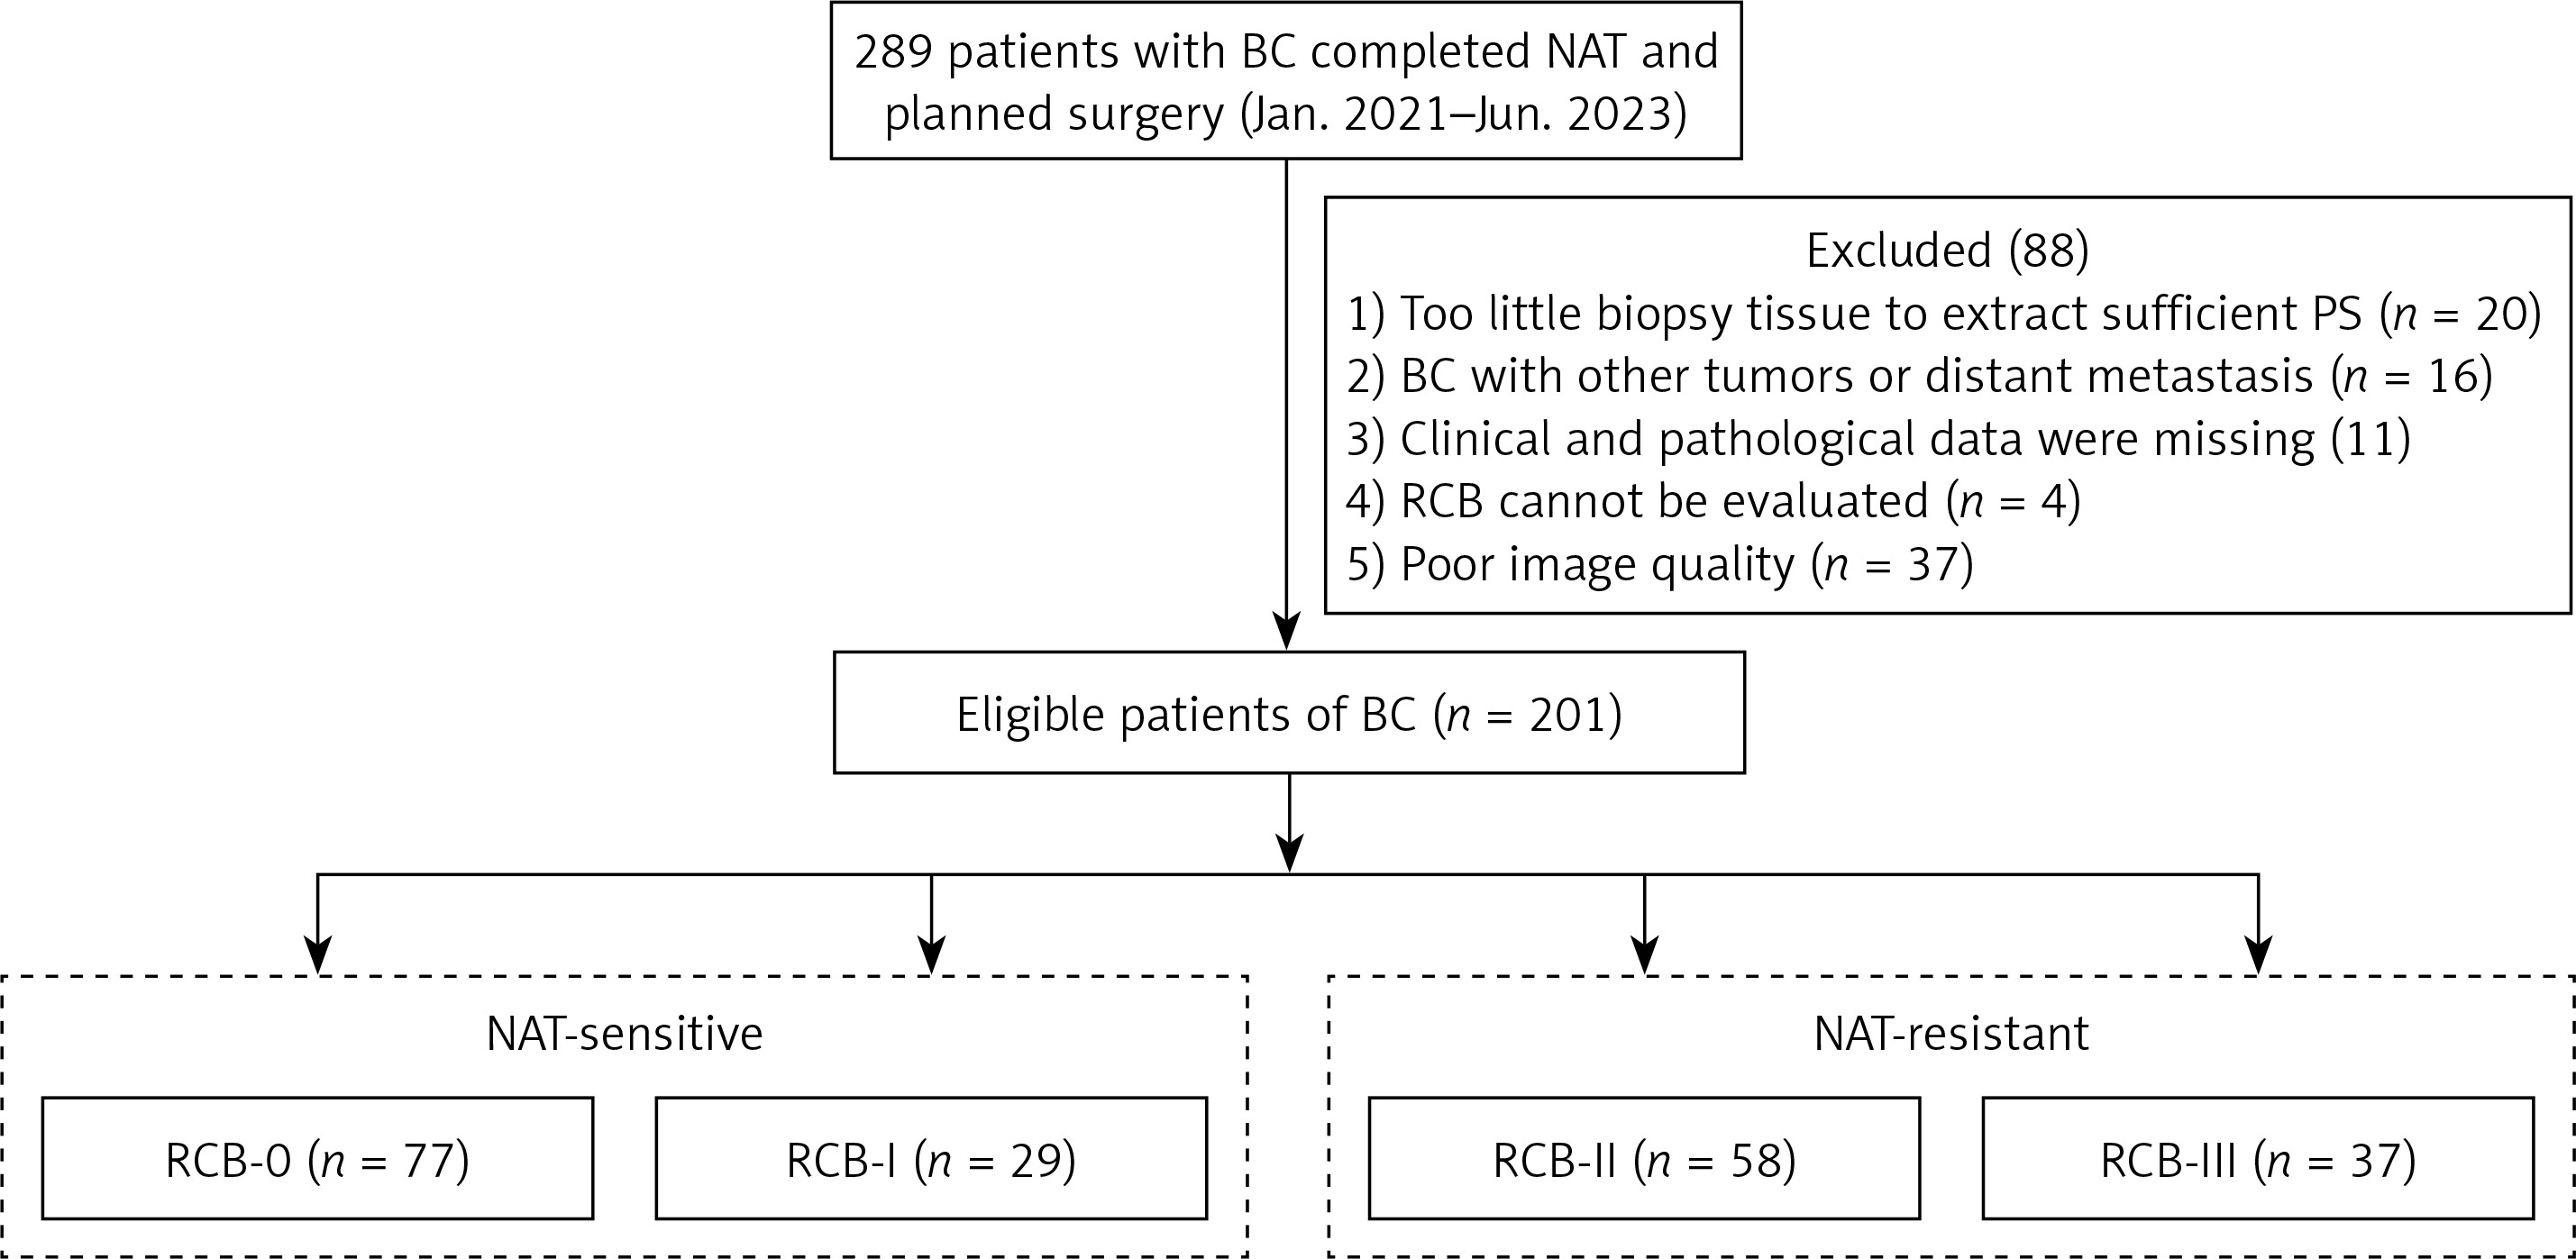
A total of 289 patients records who underwent NAT and surgical treatment at Renmin Hospital of Wuhan University between January 2021 and June 2023 were collected. Based on the inclusion criteria, 201 patients were ultimately included. Among them, 20 cases were excluded due to insufficient cancer tissue in the biopsy samples to extract enough histological features, 16 cases were excluded due to concomitant presence of other malignancies or diagnosed distant metastases at the time of diagnosis, 11 cases were excluded due to incomplete clinical or pathological information, 4 cases were excluded due to the destruction of tumor masses in the surgical samples, making the RCB assessment inaccurate, and 37 cases were excluded due to unclear image quality in the scanned WSI images, making it impossible to accurately extract the Primary Score. Finally, a total of 201 eligible patients were obtained (Figure 1). Clinical baseline information of the patients was collected preoperatively, including age, histological grading, histological type, ER, PR, androgen receptor (AR), HER2, Ki67, and cytological lymph node involvement. This retrospective study has obtained approval from the Ethics Review Committee of Renmin Hospital of Wuhan University (Ethics No. WDRY2024-K04) and has been exempted from the requirement for informed consent.
Pathological response assessment
Currently, there are three commonly used methods for prognostic assessment of NAT in breast cancer: the Miller-Payne system, the American Joint Committee on Cancer (AJCC) ypTNM staging, and the RCB system [17, 18]. Among these, the RCB assessment system can consider the dimensions of the primary tumor, the number of tumor bed cells, and the axillary lymph node burden. Therefore, the RCB score demonstrates very good accuracy, objectivity, and feasibility in predicting the prognosis of NAT for breast cancer [7, 10]. This study also utilized the RCB score to evaluate the therapeutic effects of neoadjuvant treatment for breast cancer, with the RCB index calculated using an online-based calculator (calculation website: http://www.mdanderson.org/breastcancer_RCB). According to the calculation results of the RCB index, the RCB classification is divided into four levels: RCB 0 (complete pathological response, pCR), RCB I (0 < RCB ≤ 1.36, minimal residual lesions), RCB II (1.36 < RCB ≤ 3.28, moderate residual lesions), and RCB III (RCB > 3.28, extensive residual lesions) [7] (Figure 2).
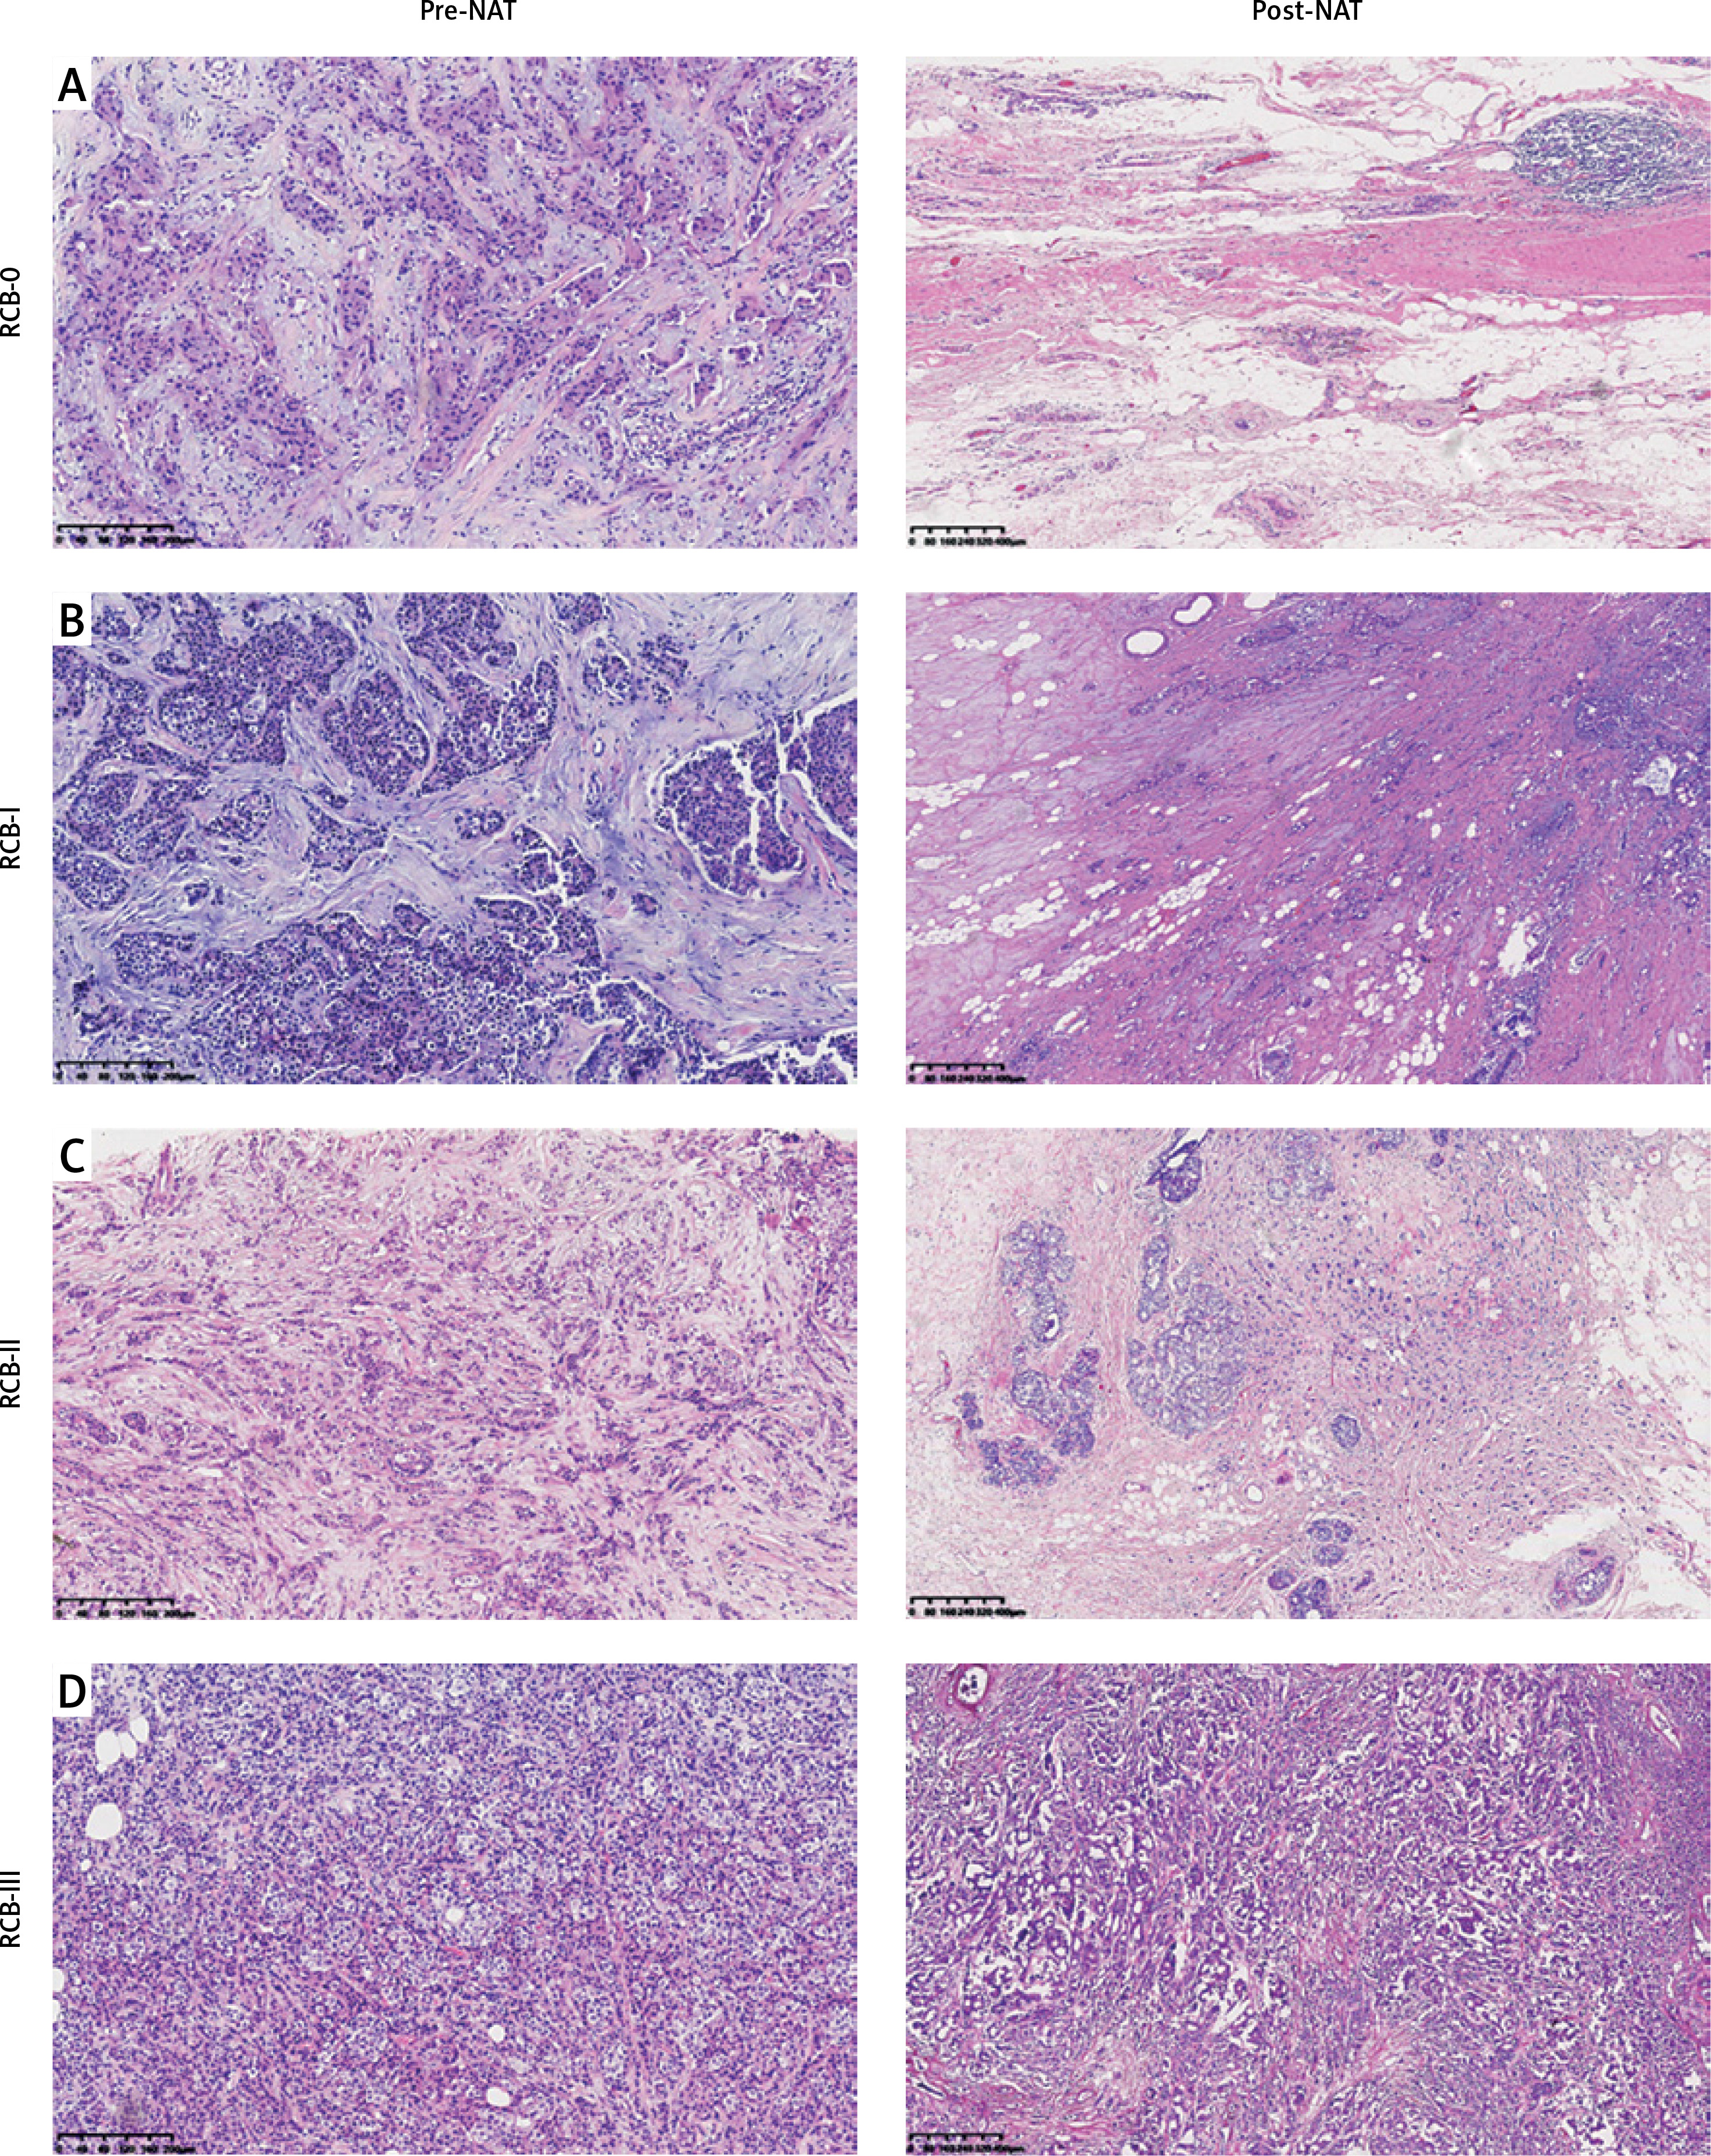
Figure 2
Histological images of breast cancer patients before and after NAT. A – RCB-0: Tumor cells disappeared completely after NAT; B – RCB-I: Only a small amount of tumor remained after NAT; C – RCB- II: There was moderate residual lesion in the tumor bed after NAT; D – RCB- III: There was extensive residual lesion in the tumor bed after NAT
Patients were treated according to the Guidelines and Norms for the Diagnosis and Treatment of Breast Cancer developed by the Breast Cancer Committee of the Chinese Anti-Cancer Association in 2019 [19]. All patients underwent 3 to 9 cycles of NAT, with chemotherapy regimens based on taxanes, carboplatin, and anthracycline drugs. HER2-positive patients also received treatment with trastuzumab. After completion of NAT, surgical resection was performed. Postoperatively, sampling and assessment were conducted following the methods recommended in the Expert Consensus on Pathological Diagnosis of Neoadjuvant Therapy for Breast Cancer [20]. Based on the postoperative RCB grading of patients, RCB grades 0 to I were classified as the significantly effective therapy group, while RCB grades II to III were classified as the insignificantly effective therapy group.
Pathomics
Development and validation of breast cancer pathomics prediction model
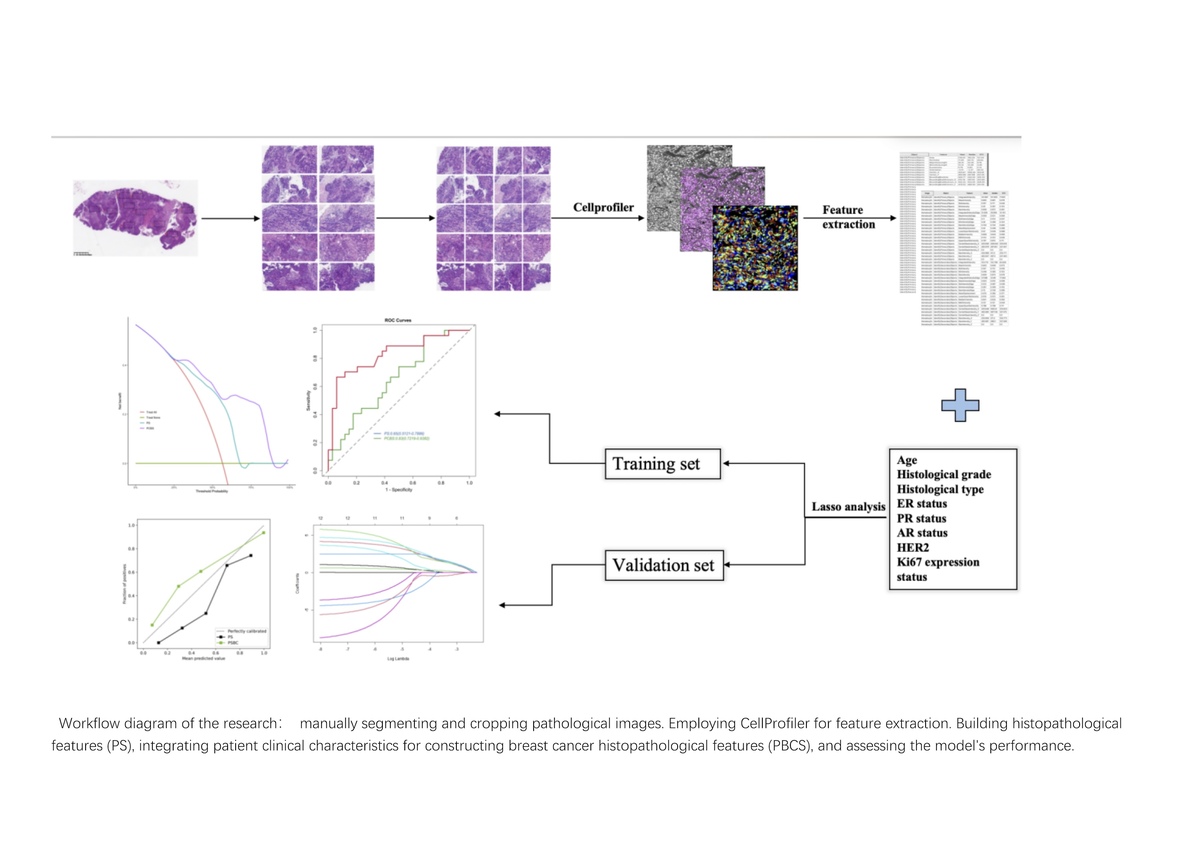
The predictive values of the Pathomics model were combined with independent clinical predictive factors using the SVM to construct a Pathomics Breast Cancer Signature (PBCS) for the prediction of RCB scores in patients undergoing NAT for breast cancer. We conducted a comprehensive evaluation of the model using the following methods. Receiver operating characteristic (ROC) curve analysis, sensitivity, specificity, positive predictive value (PPV), and negative predictive value (NPV) were employed to assess the discriminative performance [21]. We assessed the model’s calibration using calibration curves. Decision curve analysis (DCA) was performed on all models to quantify the net benefit for patients at different probability thresholds, thereby evaluating the clinical value of our predictive model in this study.
Sample preparation and selection of regions of interest
All included breast cancer tissue H&E stained slides were prepared from formalin-fixed paraffin-embedded samples. Subsequently, the pathology department director of Renmin Hospital of Wuhan University selected the slides that best represented the tumor cell heterogeneity. KFBIO (KF-PRO-020) was used to scan the selected slides at 20× magnification to acquire WSI of the patients and digitize the images into SVS format files. Managed using K-Viewer (version: 1.7.0.21), under the quality control of the director of the Pathology Department at Renmin Hospital of Wuhan University, two pathologists selected 10 non-overlapping screenshots per case containing the most tumor cells, each with a field of view of 1800 × 900 pixels. We saved the selected screenshots as formatted files (JPEG). Using Photoshop (version: 24.0.0), we segmented all screenshots into non-overlapping small frame images (500 × 500 pixels) for subsequent analysis.
Extraction of pathomics features
We used CellProfiler (version 4.0.7) [22] (an open-source image analysis software developed by the Broad Institute in Cambridge, Massachusetts) to extract quantitative pathological features from the selected pathology screenshots. We used the UnmixColors module to separate H&E-stained images into grayscale images representing hematoxylin and eosin staining components. Additionally, we utilized the ColorToGray module to convert the H&E images into grayscale images for further analysis. We conducted two measurements on the images. In the first comprehensive measurement, we accumulated a total of 285 primary features. We evaluated the image quality features of the grayscale images of H&E, hematoxylin, and eosin using the MeasureImageQuality and MeasureImageIntensity modules. Subsequently, using the MeasureLocalization module, we computed, on a per-pixel basis throughout the entire image, the co-localization and correlation of intensities between each hematoxylin and eosin staining image. Assessing the granularity features of each image was done using the MeasureGranularity module. These features summarize three types of images. In the second measurement, we extracted detailed features in the hematoxylin staining. First, we identified the primary and secondary objects and then measured them separately, obtaining 831 pathomics features. The extracted pathomics features were aggregated through the mean values of the features from 10 screenshots of each WSI. We cumulatively extracted 1116 pathomics features, which were randomly divided into training and validation sets in a 7 : 3 ratio for subsequent model construction. For a detailed summary of the extracted pathomics features, please refer to the supplementary materials (Supplementary Figures S1–S3).
Construction of pathomics models
Constructing pathomics features can reveal tumor information from the tumor microenvironment. However, these features are high-dimensional data, which adversely affect the prediction of RCB grading. Therefore, we should obtain the features most closely associated with RCB 0-I levels in the training set. Initially, all variables were normalized and a U-test was conducted on each feature to eliminate redundant features. To thoroughly extract discriminative features in this process, the threshold for the p-value was set at 0.05. Subsequently, considering the correlation between features, we conducted a correlation analysis. If the correlation coefficient between two features exceeded 0.8, one of the features was excluded. Next, the Least Absolute Shrinkage and Selection Operator (LASSO) algorithm was used to select the extracted features, and tenfold cross-validation was employed to choose the value of lambda to determine the optimal features. Based on the optimal features from the aforementioned pathomics characteristics, we constructed a Pathomics Prediction Model using the Support SVM algorithm. Subsequently, Pathomics Predictive Values were utilized to build a signature, named the PS.
Development and validation of breast cancer pathomics prediction model
The predictive values of the pathomics model for breast cancer. We conducted a comprehensive evaluation of the model using the following meth were combined with independent clinical predictive factors using the SVM to construct a PBCS, for the pre-diction of RCB scores in patients undergoing NAT for breast cancer. We conducted a comprehensive evaluation of the model using the following methods. ROC curve analysis, sensitivity, specificity, PPV and NPV were employed to assess the discriminative performance [21]. We assessed the model’s calibration using calibration curves. DCA was performed on all models to quantify the net benefit for patients at different probability thresh olds, thereby evaluating the clinical value of our predictive model in this study.
Statistical analysis
All statistical analyses were performed using R Studio (Version 4.1.1; R Studio, http://www.R-project.org) and Jupyter Notebook (Version 6.4.11). The differences in categorical variables were calculated using the χ2 test. The differences in continuous variables were analyzed using the Mann-Whitney U test. All tests were two-tailed, and a two-tailed p-value < 0.05 was considered statistically significant.
Results
Correlation between clinicopathological features and RCB grading
This study included a total of 201 female breast cancer patients who underwent NAT, with an average age of 49.4 (ranging from 22 to 76) years. Postoperative specimens were assessed using the RCB grading system, with 77 (38.3%) patients classified as RCB 0, 29 (14.4%) patients as RCB I, 58 patients (28.8%) as RCB II, and 37 (18.4%) patients as RCB III. According to the clinical efficacy of therapy, RCB 0-I (106 cases) was defined as effective therapy, and RCB II-III (95 cases) was defined as ineffective. The χ2 test showed that histological grade, histological type, ER, PR, HER2, and Ki67 proliferation index were all associated with the efficacy of NAT (Supplementary Table SI). Further univariate logistic regression analysis indicated a correlation between histological grade, histological type, ER, PR, HER2, and Ki67 proliferation index with the efficacy of NAT. Patients with higher histological grades, non-special type invasive breast cancer, negative expression of ER and PR, positive expression of HER2, and a high Ki67 proliferation index (≥ 30%) were more likely to achieve RCB 0-I, and this association was statistically significant (p < 0.05). Multivariate logistic regression analysis revealed that HER2 is an independent predictive factor influencing the efficacy of NAT (p < 0.05) (Table I). The data of 201 cases were randomly divided into training and validation sets at a ratio of 7 : 3, resulting in 140 cases in the training set and 61 cases in the validation set. χ2 tests were performed on both sets, demonstrating differences in ER, PR, and Ki67 expression between the groups. Additionally, no statistically significant difference was observed between the two groups of patients (Supplementary Table SII).
Table I
Univariate and multivariate regression analysis of clinicopathological features and NAT
Selection of pathomics features and construction of the PS model
Using the U-test and Spearman correlation analysis, redundant features were eliminated, resulting in 12 pathomics features from 201 patients (Figure 3). Subsequently, LASSO was used for further feature selection. We performed tenfold cross-validation to find the optimal lambda value. We chose the features with a lambda value equivalent to one standard error. Ultimately, 9 pathomics features were obtained. Please refer to the supplementary file for details. We extracted 9 highly correlated pathomics features with patient RCB scores from H&E stained slices of breast cancer NAT patients using CellProfiler. Subsequently, we employed the SVM algorithm to construct a PS. The ROC curve evaluated the model’s predictive performance, showing an AUC of 0.75 in the training set and 0.65 in the validation set, indicating acceptable accuracy of the model (Figure 4).
Figure 3
Feature selection process. Pathomics features (A, B) were selected by the LASSO model with the tuning parameter (λ) using fivefold cross-validation via minimum and 1se criteria
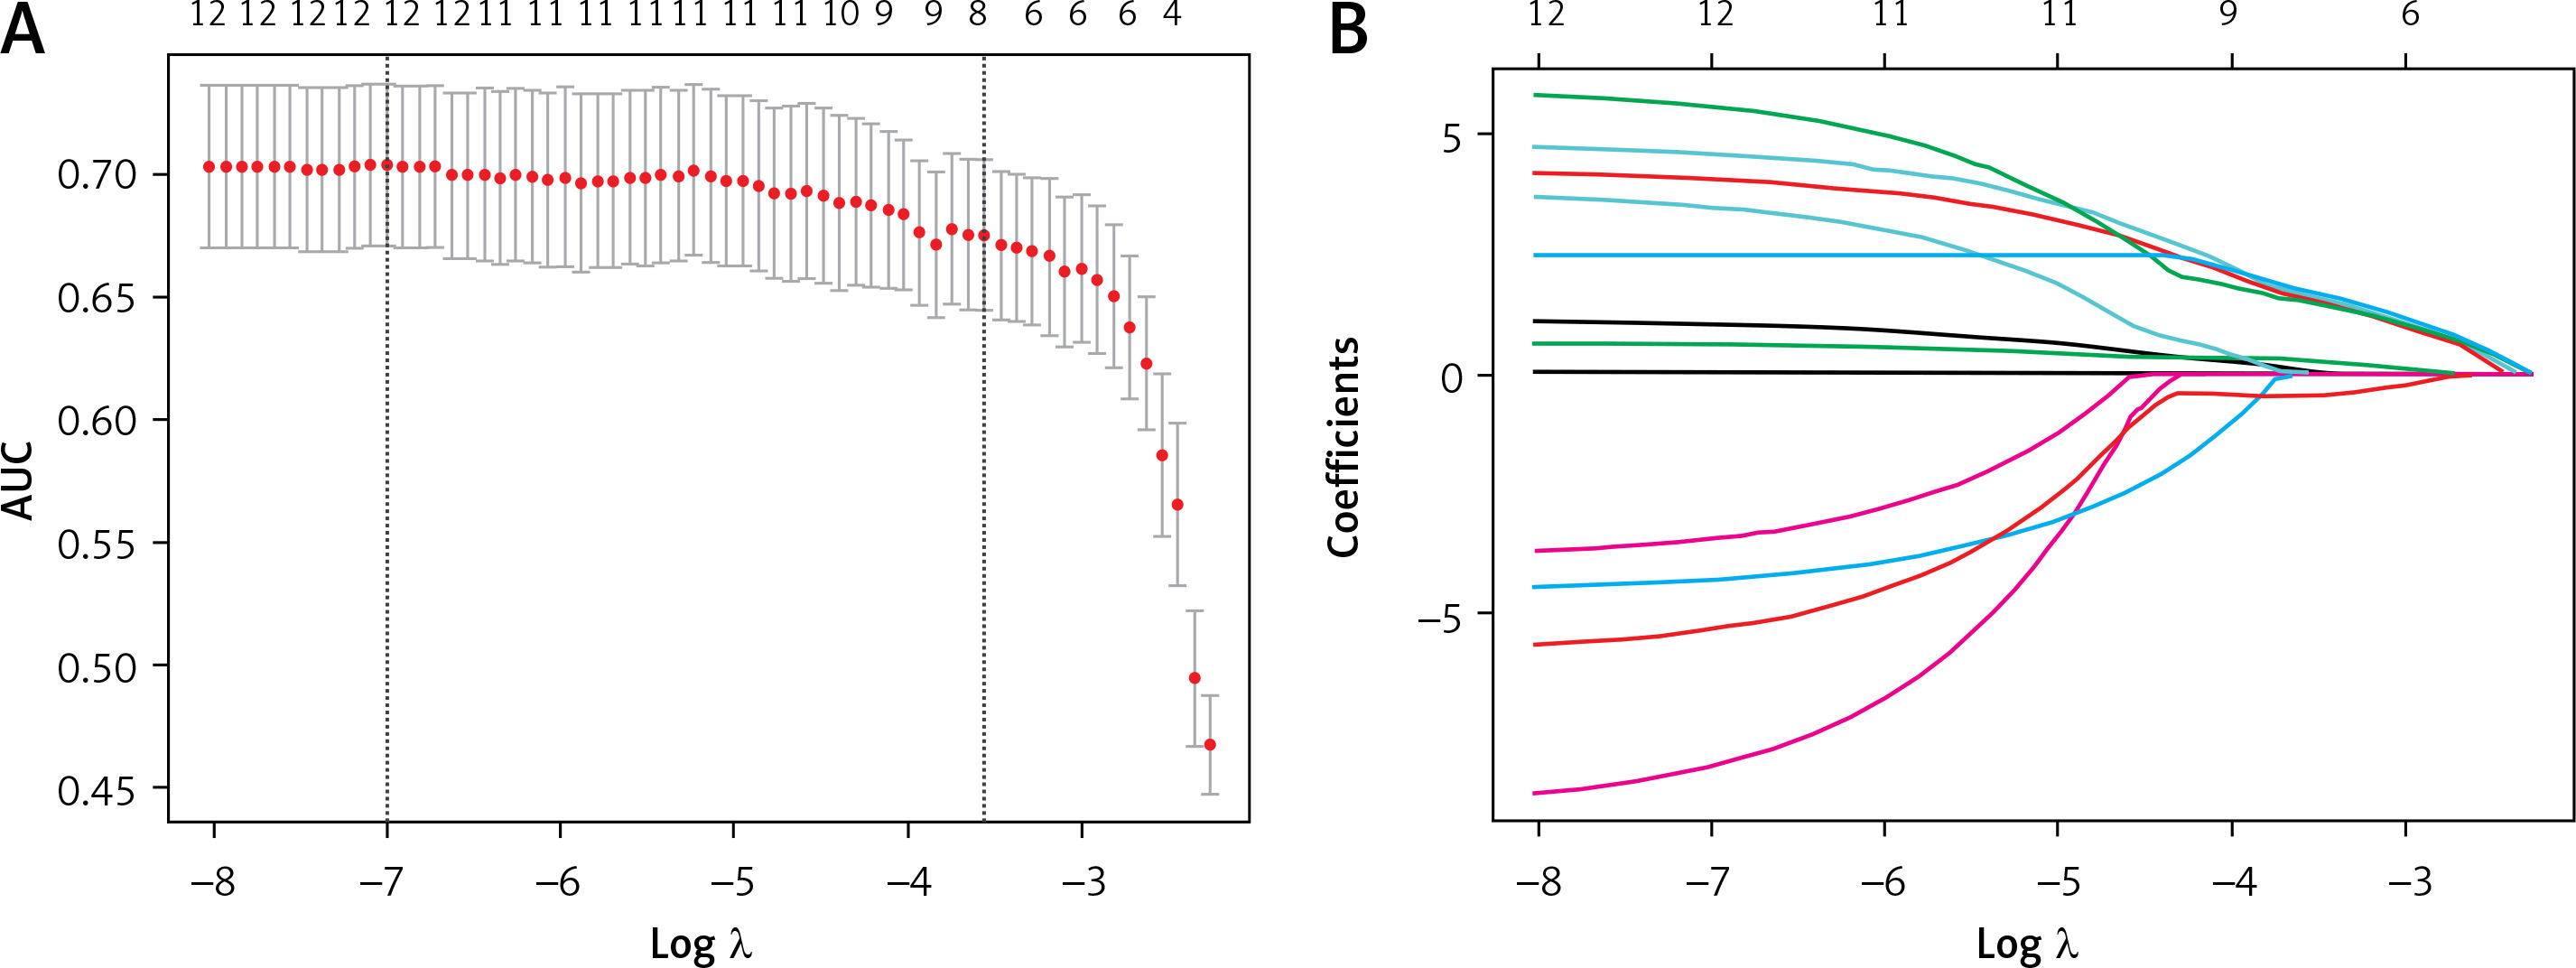
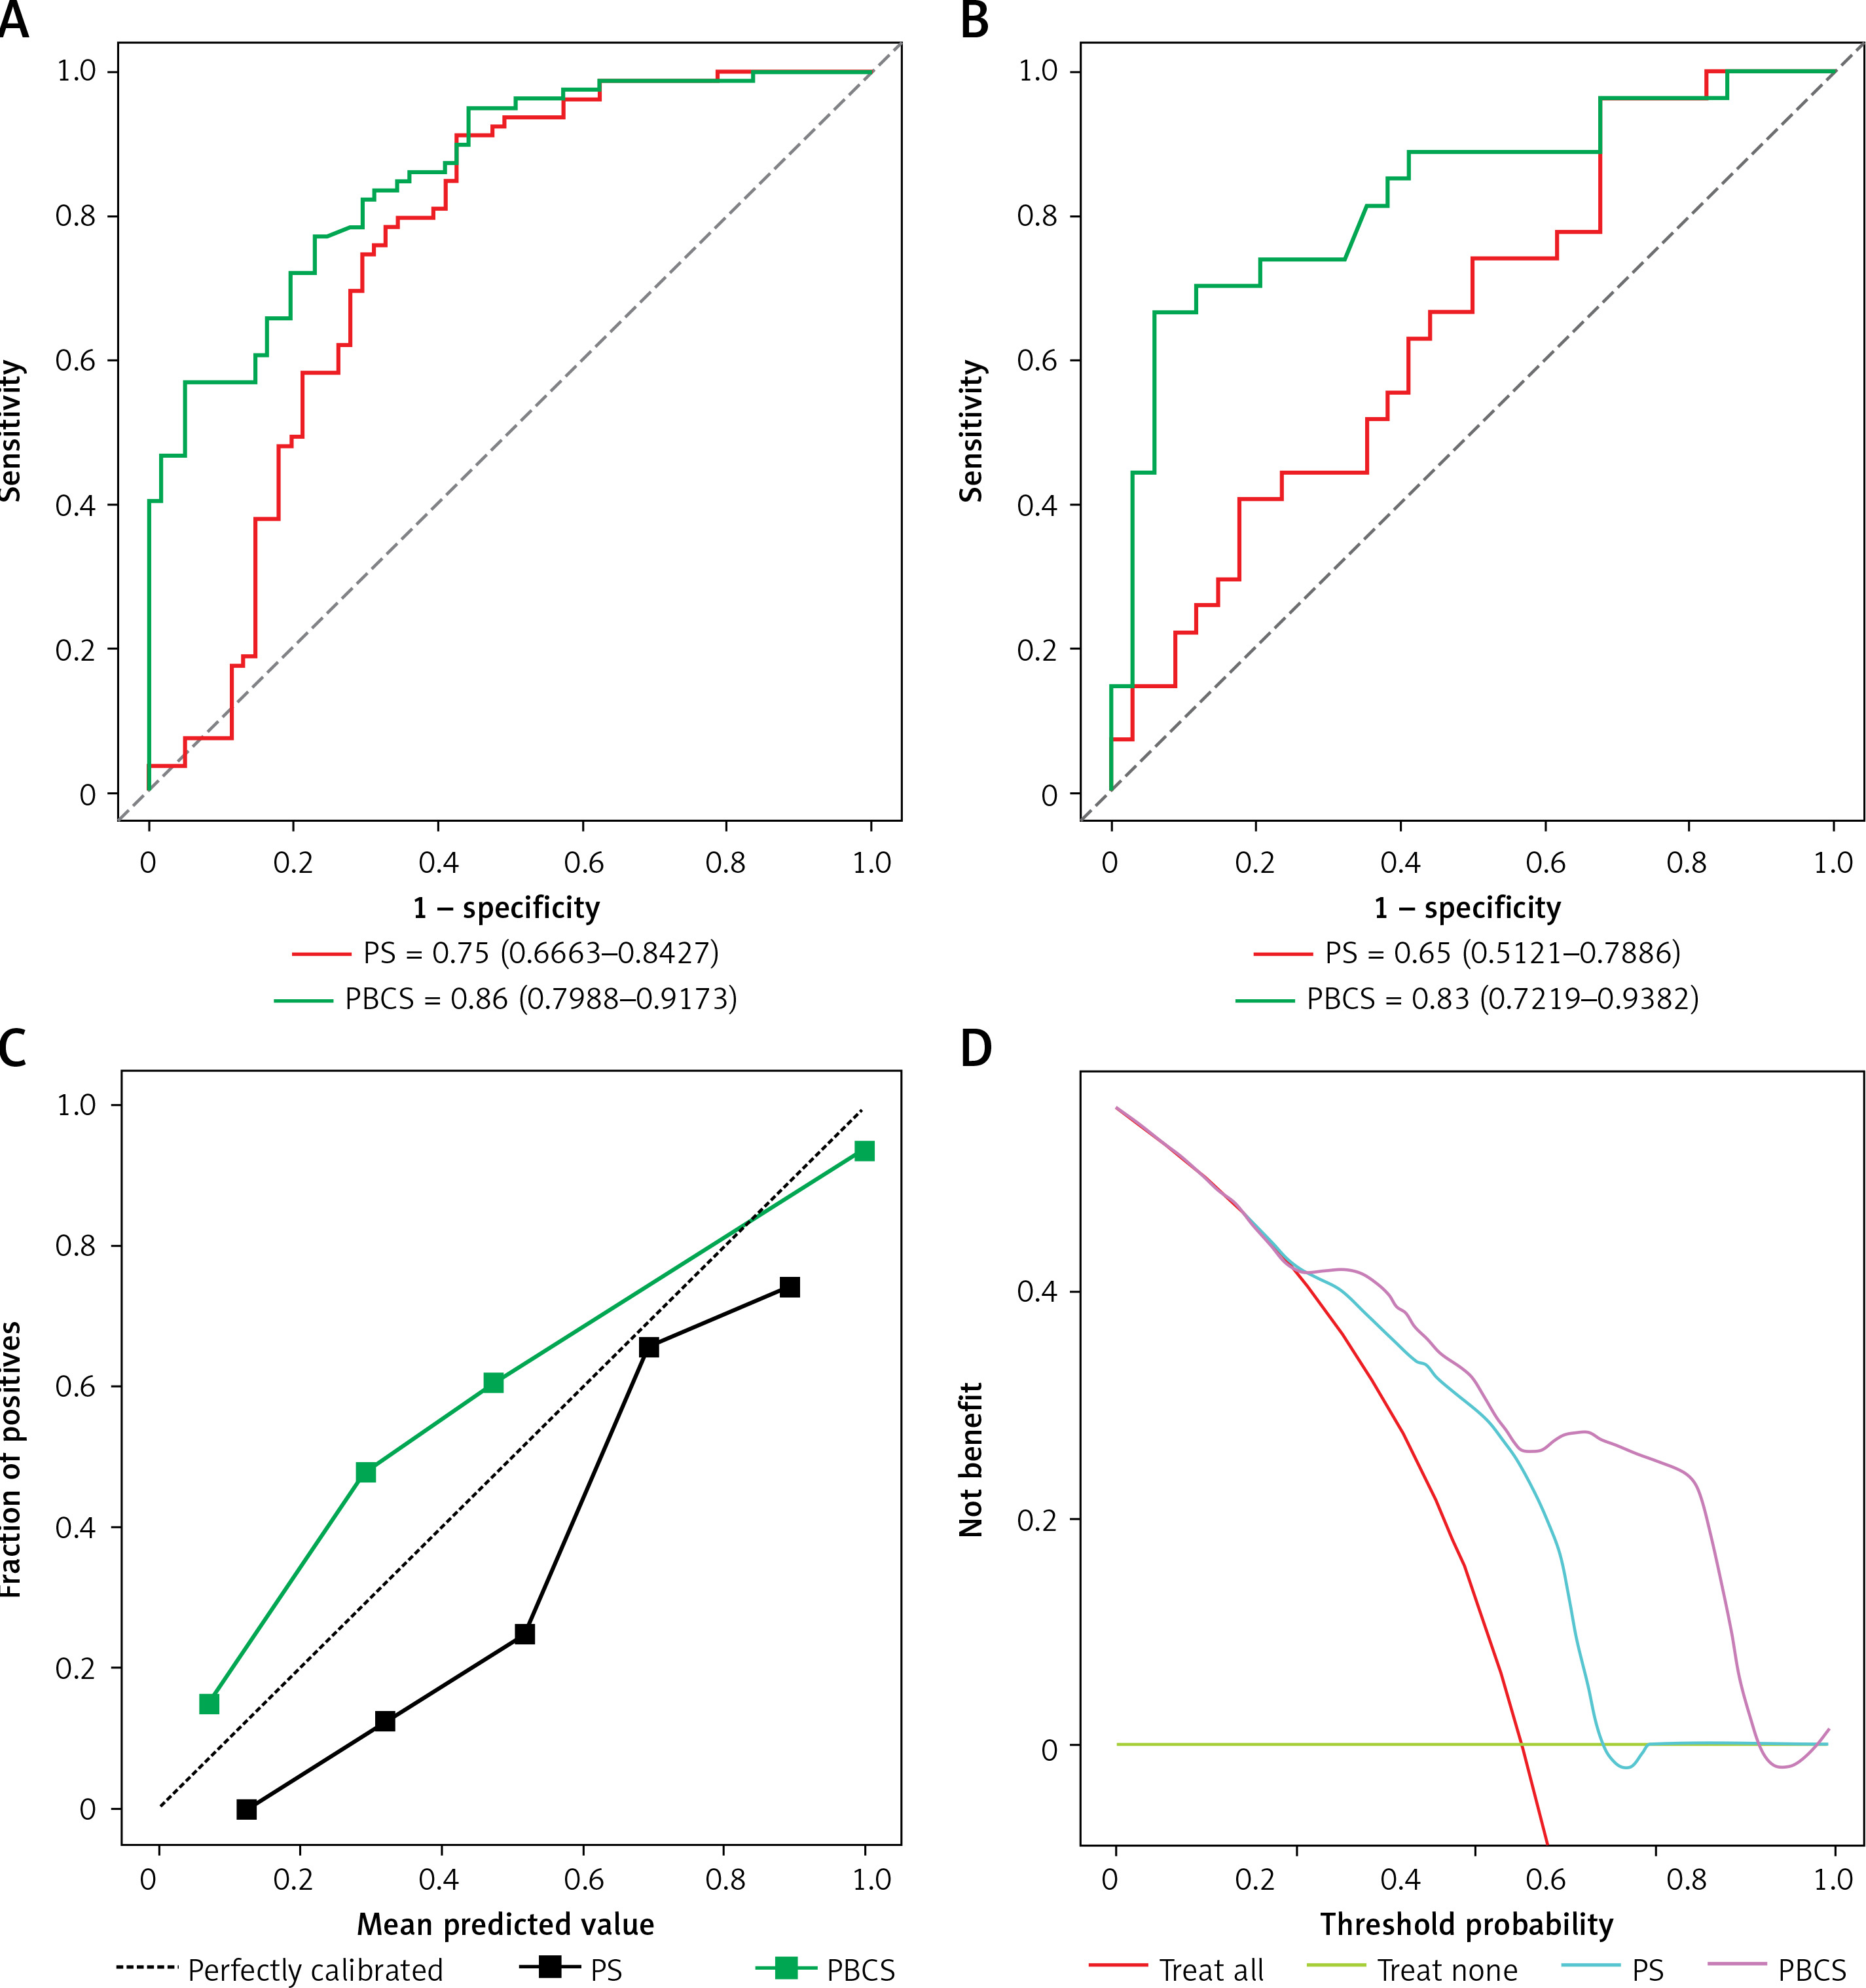
Figure 4
ROC analysis of predictive models for predicting significant therapy response group in the training set (A) and validation set (B). C – Calibration curves of models in training set on discriminating group with significant effect of therapy versus group with insignificant effect of therapy. D – Decision curve analysis in training set using PS and PBCS
Development and validation of PBCS
The results of the multifactor regression analysis showed that HER2 is an independent predictive factor influencing the efficacy of NAT. Thus, integrating HER2 with PS into the training set, a comprehensive predictive model, PBCS, was developed using the SVM algorithm. The model’s discriminative performance was evaluated using the ROC curve. PBCS accurately predicted effective therapy (RCB0-I) in the training set (AUC = 0.86 [95% CI: 0.7988–0.9173]) and the validation set (AUC = 0.83 [95% CI: 0.7219–0.9382]) (Table II).
Table II
Discrimination performance of predictive models for predicting RCB0-I in breast cancer patients
Discussion
Due to the high incidence and increasing trend of breast cancer among patients, NAT combined with surgical treatment as a standardized approach brings hope to an increasing number of patients. However, due to individual variations, different patients also respond differently to therapy [9]. Hence, numerous biological indicators predicting treatment response are gradually becoming a hot area in clinical research. Currently, decisions regarding whether patients should undergo NAT are largely based on clinical pathological features. Numerous studies have shown that higher histological grading, a high Ki67 proliferation index, negative expression of ER and PR, and positive expression of HER2, are all associated with a favorable treatment response [23]. Among these, the molecular subtypes determined by ER, PR, HER2, and Ki67 are among the most important indicators for predicting NAT. This suggests that patients with HER2-enriched and triple-negative breast cancer are recommended candidates for NAT, while those with ER and PR positive expression (luminal subtype) may benefit more from hormonal therapy or surgical treatment. Klein et al.’s research also indicates higher sensitivity of HER2-positive and triple-negative breast cancer patients to neoadjuvant treatments [24]. Therefore, in the complex clinical practice, relying solely on clinical pathological features does not yield satisfactory results, necessitating the urgent development of more accurate biological markers to predict patients’ treatment responses.
In the field of digital pathology, artificial intelligence techniques such as support vector machine algorithms and convolutional neural networks have been used to assist in the diagnosis of oncologic pathology [25–29]. Previous studies have confirmed the effectiveness of using ultrasound images of tumors to predict the outcome of pathological complete response to neoadjuvant chemotherapy in breast cancer patients [30]. Recently, some investigators have developed a CT-based radiological model that is effective in predicting the validity of axillary pathologic complete response after NAT [31]. In this study, based on clinical pathological features and pathological histological characteristics, we developed a predictive model for the efficacy of NAT in breast cancer using an SVM algorithm. This model aims to forecast the RCB score in breast cancer patients after neoadjuvant treatment. The predictive model based on pathological characteristics showed complete accuracy in predicting the RCB score, demonstrating good performance in discrimination, calibration, and at the level of clinical decision-making. Internally validated within our center, the model exhibited a good AUC, high sensitivity, specificity, and NPV. In clinical practice, our research provides an effective and replicable tool to predict the RCB score in breast cancer patients undergoing NAT. This tool can assist in timely adjustment of treatment strategies for patients with ineffective treatment (RCB II-III), enabling the development of personalized treatment plans for them.
For breast cancer patients, accurately predicting their RCB classification before initiating NAT can significantly maximize their treatment benefits and aid in the early development of personalized treatment strategies. In the traditional treatment process, pathologists often use optical microscopes to determine the tumor’s malignancy, differentiation degree, and growth pattern. Clinical physicians then combine the patients’ molecular characteristics and their own experience to decide on whether to use NAT. However, due to limitations in optical microscope magnification, variations in pathologists’ experiences, and the heterogeneity of tumors among different patients, numerous biological markers do not always accurately predict a patient’s response to NAT. This leads to cases where patients with ineffective treatment (RCB II-III) are subjected to NAT strategies. This not only fails to cause significant regression in tumor cells but also brings numerous side effects to patients and might delay the appropriate timing for treatment. With the application of cell analysis software and the rapid advancement of computer storage technology, the digitization of pathological slides has become achievable. Within histopathological sections lie a multitude of microscopic structural details that elude the naked eye, reflecting the characteristics of tumor cells and microenvironment features [32]. This information can directly indicate the malignancy level of the tumor and its response to treatment.
In our study, the PS model, solely based on pathology image extraction in the validation set, showed an AUC of 0.65 for predicting NAT in breast cancer, yielding reasonably reliable results regarding predicting patient responses to neoadjuvant treatment. Additionally, considering that patients’ clinical characteristics, particularly HER2 status, are closely associated with NAT efficacy, the PCBS model constructed by combining PS with the patients’ clinical feature HER2 exhibited a significant enhancement in predictive value (AUC = 0.83). The PBCS achieves a predictive value for NAT in breast cancer with an AUC > 0.8, similar to the results in Zhang et al.’s study [16]. They used radiomics, pathomics, and deep learning pathomics to predict pCR in breast cancer NAC. However, their assessment of patients’ pathological response relies on the clinical pathologists’ experience, which holds a degree of subjectivity. In contrast to their study, our research adopted a more advanced and objective method, utilizing RCB classification to evaluate the effectiveness of NAT in patients, hence providing a more accurate assessment of treatment outcomes. During the construction of our model, we conducted two extractions of our pathological images using CellProfile. The PBCS model demonstrated high sensitivity and NPV in an independent validation set, indicating its reliability in identifying individuals with no significant response to neoadjuvant treatment.
Although our research pioneered the introduction of RCB classification as an evaluation tool for pathological remission of NAT for breast cancer patients, providing greater objectivity in distinguishing treatment effects, the study still has certain limitations. Firstly, due to random assignment of cases in this study, the proportion of triple-negative breast cancer patients was significantly higher in the training set compared to the validation set, causing statistically significant differences in ER, PR, and Ki-67 between the training and validation set patients. Further single-factor and multi-factor regression analyses conducted separately on the training and validation sets showed that high histological grading, negative expression of ER and PR, positive expression of HER2, and a high Ki67 (≥ 30%) proliferation index were all factors influencing patients’ chemotherapy response, leading to poor uniformity in clinical pathological factors between the training and validation sets. Secondly, our study is a single-center retrospective study where all breast cancer patients originated from the same medical institution. The sample size is limited. In the future, we aim to acquire sample data from more medical institutions and conduct prospective studies to validate the accuracy and applicability of PBCS.
In conclusion, we have developed the PBCS, a novel artificial intelligence model that predicts the RCB score after NAT for breast cancer by integrating pathology biopsy WSI and clinical pathological features. This model aids clinical physicians in preparing for NAT by predicting the therapy response, enabling timely adjustment of personalized treatment strategies for patients.