Introduction
According to a previous observational research, the first teeth to be lost due to periodontal disease are usually the maxillary first and second molars [1]. After the loss of maxillary molars, the residual bone height is insufficient owing to the alveolar bone atrophy and maxillary sinus pneumatization [2]. Bone deficiency is regarded as a challenge for operators in maintaining the stable osseointegration of implants locally. In 1986, Tatum first proposed the lateral window osteotomy as a technique for bone augmentation in the posterior maxilla [3]. Boyne and James used autogenous marrow and bone to raise the Schneiderian membranes and promote osteogenesis [4]. The disadvantages of this technique include postoperative swelling, a long healing period, and the need for numerous operations [5]. In order to improve the inadequacy, Summer proposed a new technique called transalveolar maxillary sinus floor elevation, which used an osteotome to make a ‘green-stick’ fracture prior to placement of implants [6]. Compared to lateral window osteotomy, the advantages of this technique are minimal invasiveness, fewer postoperative reactions, and shorter operation time. However, the indication for surgery is a minimum residual bone height, ranging from 4 to 6 mm, to achieve the primary stability of the implants [7]. With improvements in implant surfaces, acceptable primary stability has been achieved in areas of bone deficiency [8]. In the past, most researchers considered it necessary for maxillary sinus floor elevation (MSFE) to be combined with graft materials. Currently, MSFE using graft materials is unnecessary. Lundgren et al. first reported new bone formation in an area without bone grafts after removing a cyst from the maxillary sinus [9]. Riben et al. conducted retrospective studies of patients who underwent MSFE without bone grafts. The results showed a high survival rate of 94.3%, with an average endo-sinus bone gain (ESBG) of 6 mm and an acceptable implant stability quotient of 77 [10]. MSFE without bone grafts prevents maxillary sinusitis caused by membrane perforation, which leads to bone graft leakage. However, this means a lower economic burden for patients in terms of MSFE [11].
According to the present systematic review that reported MSFE without bone grafts, the results demonstrated high survival rates for implants placed in the posterior maxilla [12–14]. However, fewer systematic review have simultaneously included randomised controlled trials (RCTs) on transalveolar maxillary sinus floor elevation and lateral window osteotomy for non-graft MSFE. At the same time, our study performed sample size estimation for the clinical outcomes in the meta-analyses.
The goal of this review was to use evidence-based medicine methods to evaluate the clinical outcomes of MSFE without graft materials based on current evidence.
Material and methods
This systematic review was conducted in accordance with the Preferred Reporting Items for Systematic Reviews and Meta-Analyses (PRISMA) 2020 Statement [15]. To minimise selection bias and avoid duplication, the protocol for this review was registered in the International Prospective Register of Systematic Reviews (PROSPERO) on 20 May, 2023 (CRD42023424526; available from www.crd.york.ac.uk).
Search strategy
An electronic search of four databases (PubMed/Medline, Embase, Web of Science, and Cochrane Library) for studies published in English between January 1980 and May 2023 was conducted. MeSH and entry terms were combined to search for potential studies. The search string on EMBASE was as follows: (‘sinus floor augmentation’ OR ‘augmentations, sinus floor’ OR ‘floor augmentation, sinus’ OR ‘floor augmentations, sinus’ OR ‘sinus floor augmentations’ OR ‘maxillary sinus floor augmentation’ OR ‘sinus augmentation therapy’ OR ‘augmentation therapies, sinus’ OR ‘augmentation therapy, sinus’ OR ‘sinus augmentation therapies’ OR ‘therapies, sinus augmentation’ OR ‘therapy, sinus augmentation’) AND (‘Bone Substitutes’ OR ‘Replacement Material, Bone’ OR ‘Replacement Materials, Bone’ OR ‘Materials, Bone Replacement’ OR ‘Bone Substitute’ OR ‘Substitute, Bone’ OR ‘Substitutes, Bone’ OR ‘Bone Replacement Material’ OR ‘Material, Bone Replacement’ OR ‘Bone Replacement Materials’).
A manual search of implant-related journals was also performed from January 1980 until May 2023, including Clinical Oral Implants Research, Clinical Implant Dentistry and Related Research, International Journal of Implantology, Implant Dentistry, Journal of Periodontal and Implant Science, Journal of Oral Implantology, Implantologie, International Journal of Oral & Maxillofacial Implants. A further search of the references of implant-related reviews was conducted for literature that could not be retrieved from electronic databases and journals. A single examiner (J.C.) performed the search.
Eligibility criteria
For potential articles to be included in the meta-analyses, the following criteria had to be met:
Participants – Patients with a loss of bone height in the posterior maxilla underwent treatment for maxillary sinus floor elevation during implant surgery. In addition, all patients were in good general health.
Interventions – Patients without sufficient residual bone height in the posterior maxilla underwent graftless maxillary sinus floor elevation.
Comparators – Patients without sufficient residual bone height in the posterior maxilla undergoing maxillary sinus floor elevation with bone grafts.
Outcomes – (1) survival rate of implants, (2) perforation, (3) ESBG, (4) stability of implants, (5) bone density (BD), (6) marginal bone loss (MBL) height, (7) surgical time (ST), and (8) treatment cost.
Studies – Clinical trials on humans.
Exclusion criteria were as follows: (1) Animal studies, (2) in vitro studies, (3) conferences, (4) patents, (5) one-arm studies, (6) studies presenting incomplete data, (7) non-RCTs, (8) low-quality studies, and (9) review articles.
Data extraction
All electronically retrieved and manually searched studies were imported into the EndNote X9 software. Data were extracted from articles initially retrieved by two independent observers (J.C. and Y.L.). The demographic data of the included articles were recorded on a spreadsheet, including the time of publication, region, number of people, age, sinus sample size, implant sites, residual bone height, approaches used, types of implants, kinds of grafting materials, and follow-up durations. Survival rate as the main outcome was extracted by screening full texts. Additional outcomes, if there were any, recorded for included studies were perforation, ESBG, BD, implant stability quotient (ISQ), MBL, ST, visual analogue scale (VAS), and treatment costs. If there was any disagreement concerning inclusion or exclusion in the collection procedure, another author (J.X.) was consulted. If any data were incomplete, the original authors were emailed for further details.
Risk of bias assessment and certainty of evidence
RCTs included in the quantitative analysis were evaluated for risk of bias by two reviewers (J.C. and Y.L.) as part of data collection. Any divergence was resolved by consensus. The criteria used to assess the quality of the included RCTs were adapted from the guidelines proposed in the Cochrane Handbook, which provided items for the following parameters: sequence generation, allocation concealment, blinding of participants and personal information, blinding of outcome data, incomplete outcome data, selective reporting, and other biases [16]. The risk of bias was explicitly judged in each criterion as “low”, “high”, or “unclear”. Allocation concealment, blinding of outcome data, and incomplete outcome data were considered to summarise the evidence quality. Each trial was classified as having a low risk of bias when all three parameters were assessed at a low risk of bias, a high risk of bias when at least one parameter was at a high risk of bias, and a moderate risk of bias in the remaining condition. GRADEpro GDT online was used to evaluate the strength of the evidence for the main and additional outcomes [17]. Each GRADE item (study design, risk of bias, inconsistency, indirectness, imprecision, and other considerations) was assessed for all outcomes, according to the GRADE handbook. Simultaneously, the importance of the data outcomes was judged on a 9-point scale based on clinical issues.
Statistical analysis
Statistical analysis was performed using Review Manager 5.4 and Stata MP 17. The risk difference (RD) with 95% confidence intervals (CIs) was used as the effect size for dichotomous outcomes, as the relative risk (RR) and odds ratio (OR) could not be calculated for zero events. For continuous data, the standard mean difference (SMD) or weighted mean difference (WMD) with 95% CIs was used as the effect measure. If the relative outcomes of the included studies were inadequate, descriptive analyses were performed without statistical calculation. Heterogeneity was explored among the included articles (using the I2 test and χ2 test). A fixed effects model was used when there was quantitative evidence of heterogeneity (i.e. I2 < 50% and p-value of χ2 test > 0.05). If the heterogeneity was significant (i.e. I2 > 50% and p-value of χ2 test < 0.05), a random-effects model was applied. For outcomes with significant heterogeneity, meta-regression analyses were used to explore the sources of the heterogeneity. Covariates included approaches for vertical bone augmentation, bone substitutes, follow-up period, year of publication, and risk of bias. To examine the stability of the results drawn from the meta-analysis, we used a statistical method of meta-analysis-based influence analysis. Funnel plots and Egger’s test were applied to detect potential publication bias [18]. For each outcome, trial sequential analysis (TSA) was used to judge whether the current RCTs had sufficient statistical power to draw a strong conclusion with TSA 0.9.5.10 Beta Java [19]. Sequential monitoring boundaries, known as required information size (RIS), were used to calculate the sample sizes of the included studies. We set the two-sided type-1 error probability at 5% (alpha boundary) and performed calculations with 80% statistical power, assuming an effect type mean and variance based on low-risk studies for continuous outcomes. The RR reduction (RRR) was given a parameter of 10% for dichotomous data. A Z-curve was obtained from the cumulative evidence provided by existing trials. If this Z-curve crosses the 5% alpha boundary, adequate evidence supporting the intervention has been obtained. The current evidence is sufficient to find no statistical difference between the test and control groups if the Z-curve crosses the futility boundary (inner wedge).
Results
Study selection
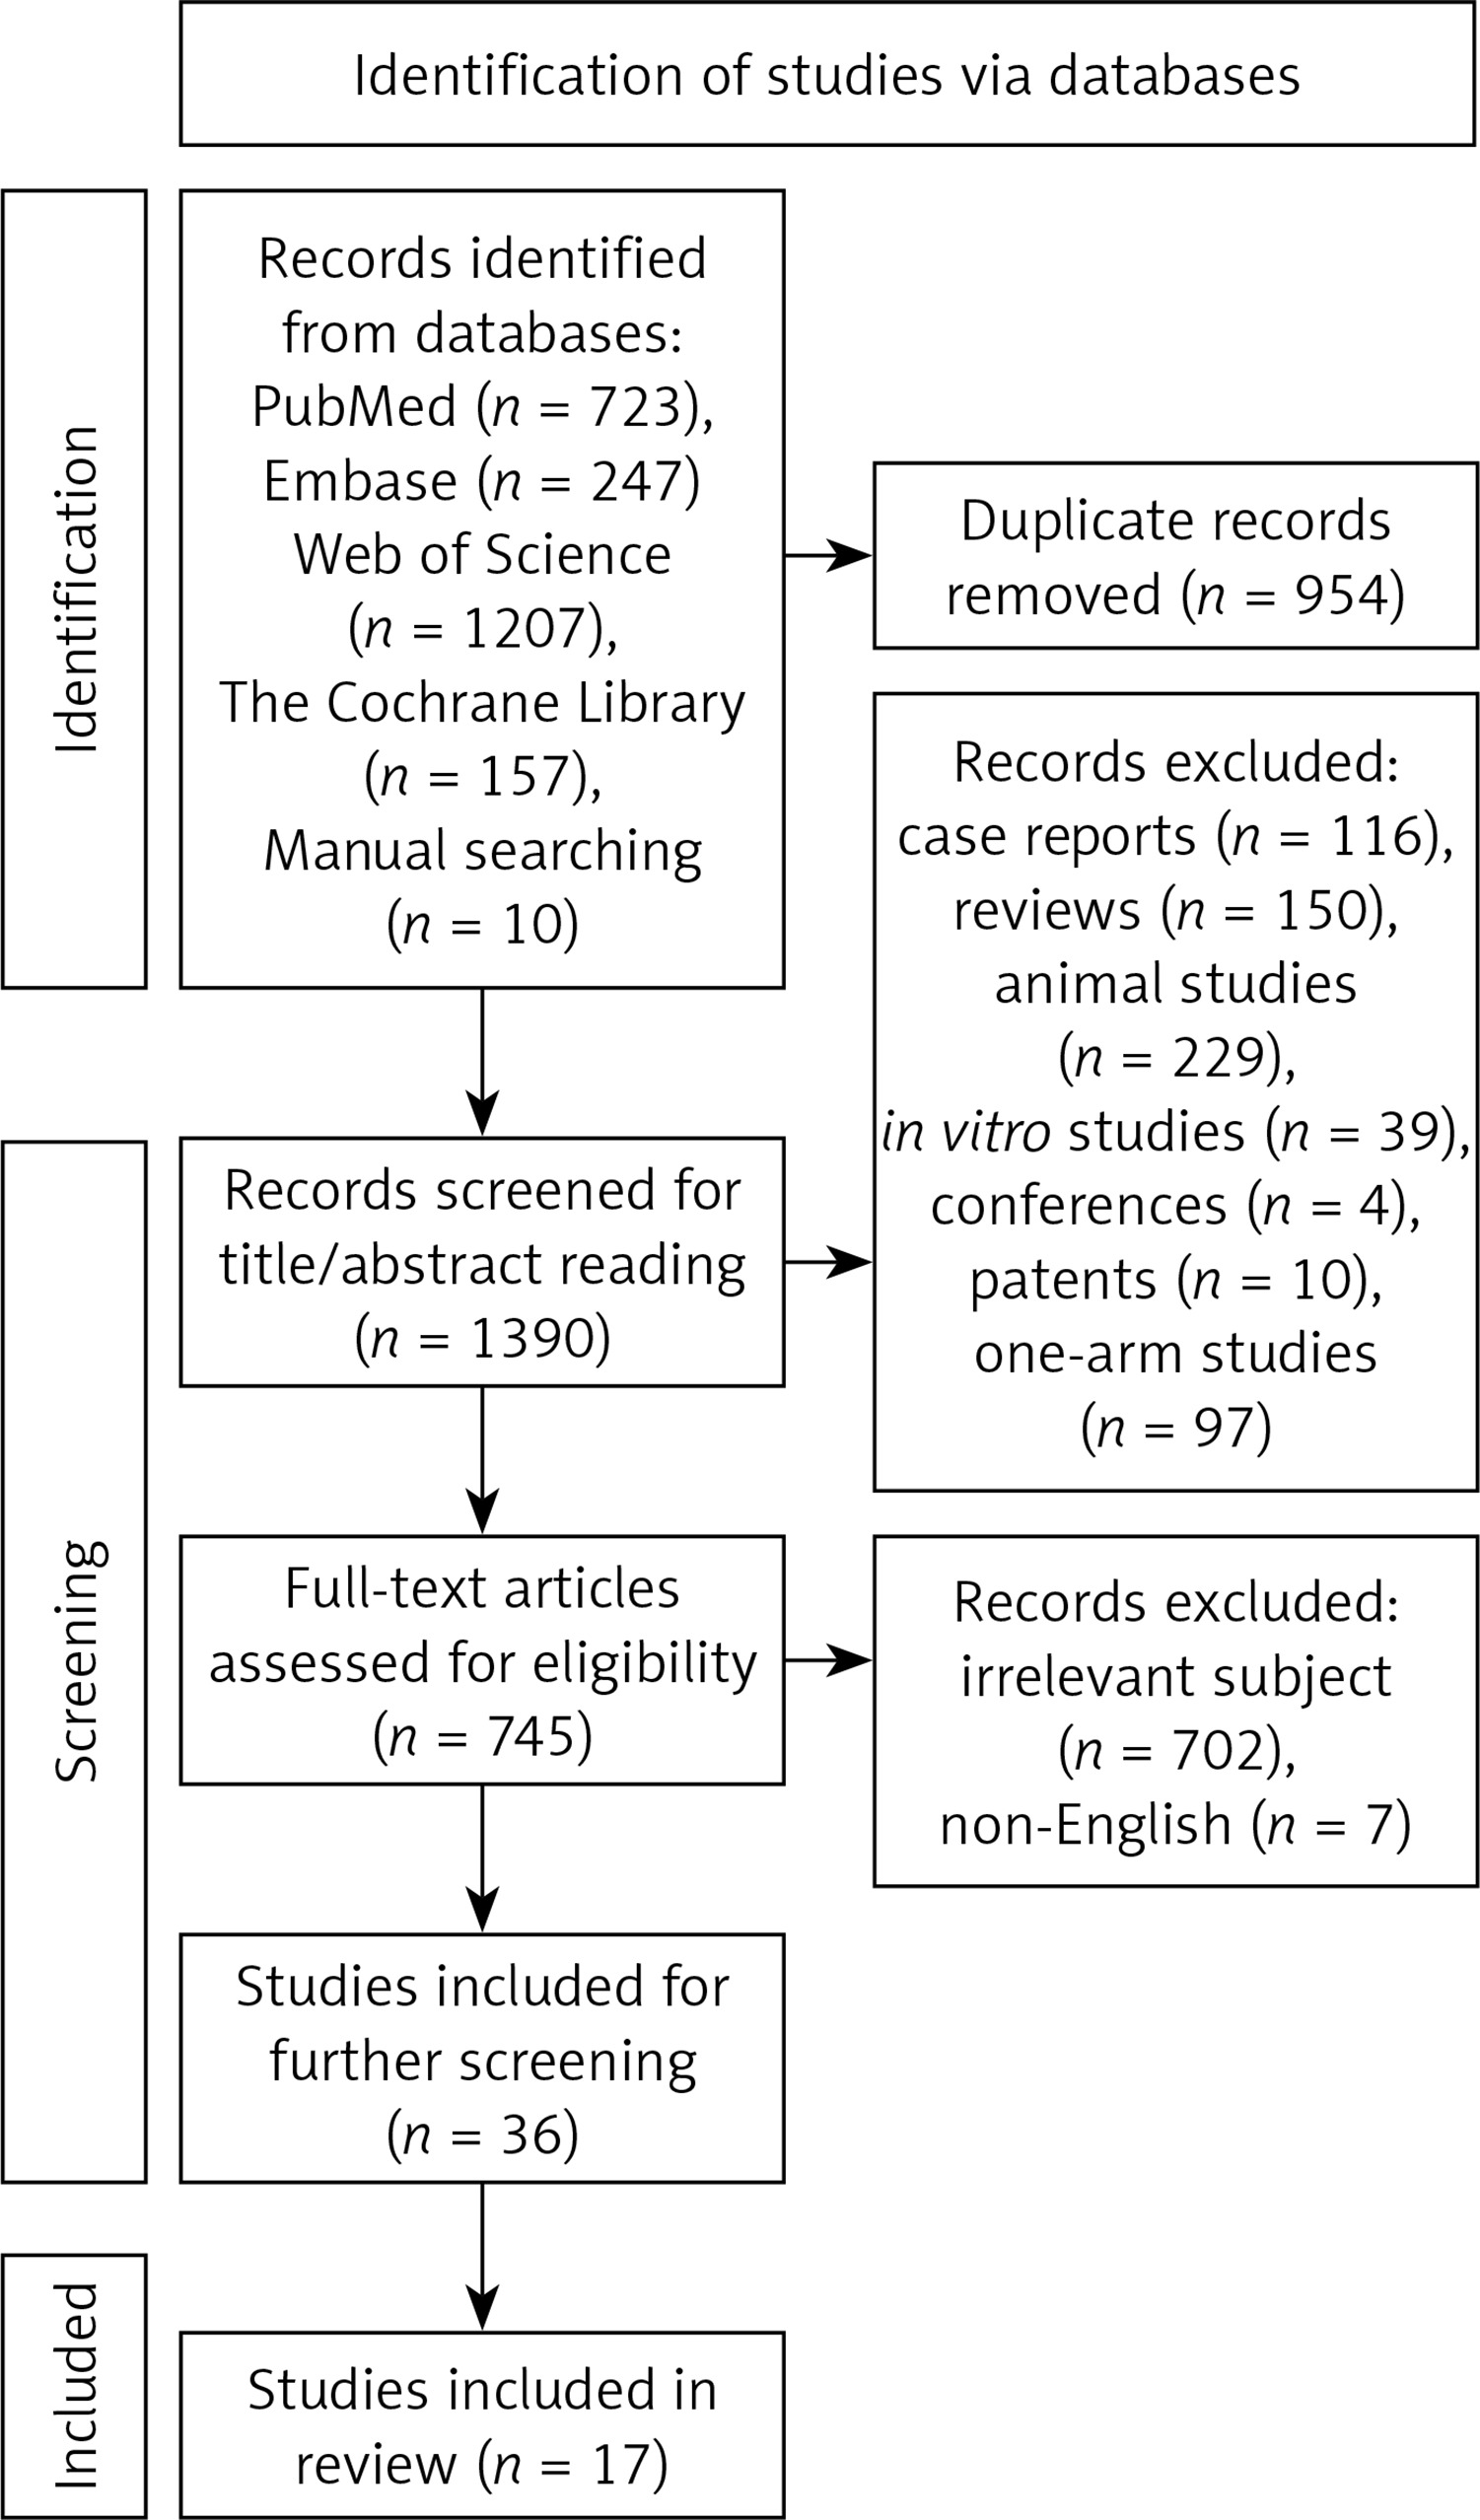
The search identified 1390 studies after removing duplicates (Figure 1). A total of 645 studies (116 case reports, 150 review articles, 229 animal studies, 39 in vitro studies, 4 conferences, 10 patents, and 97 one-arm studies) were excluded after reading their titles and abstracts. We removed 709 articles after full-text screening of the remaining 745 articles because 702 articles were irrelevant to the present subject and seven articles were published in other languages. The remaining 36 trials were then assessed. Finally, 17 studies were included in this meta-analysis [20–36]. The reasons for excluding these 19 studies are listed in Table I. Altogether, the included studies included 483 patients with an atrophic posterior maxilla.
Table I
Studies excluded from further screening
Characteristics of studies
The characteristics of the included studies are shown in Table II. All studies were RCTs published between 2009 and 2023. The sample size of implants was 696, and 547 sinuses were included in this meta-analyses. Internal maxillary sinus elevation was mentioned in eight studies while nine articles used external maxillary sinus elevation as a method for vertical augmentation. The bone grafts used in MSFE were as follows: xenograft, allograft, autogenous bone, sponge, nanoparticles, and autogenous bone + xenograft. The most commonly used implant in these trials was Straumann. Table III describes the basic information included in the meta-analysis and the follow-up durations ranging from 1 to 120 months. The conclusions drawn from more than half of the included trials were based on short-term observations. Thirteen studies measured ESBG of sinuses as outcomes, four studies measured ISQ of implants, five studies measured BD of sinuses, four studies measured MBL of implants, three studies measured ST of sinuses, 11 studies measured survival rate of implants, and 13 studies measured perforation of sinuses.
Table II
Articles included for review: characteristics
Table III
Articles included for review: outcomes
Risk of bias assessment
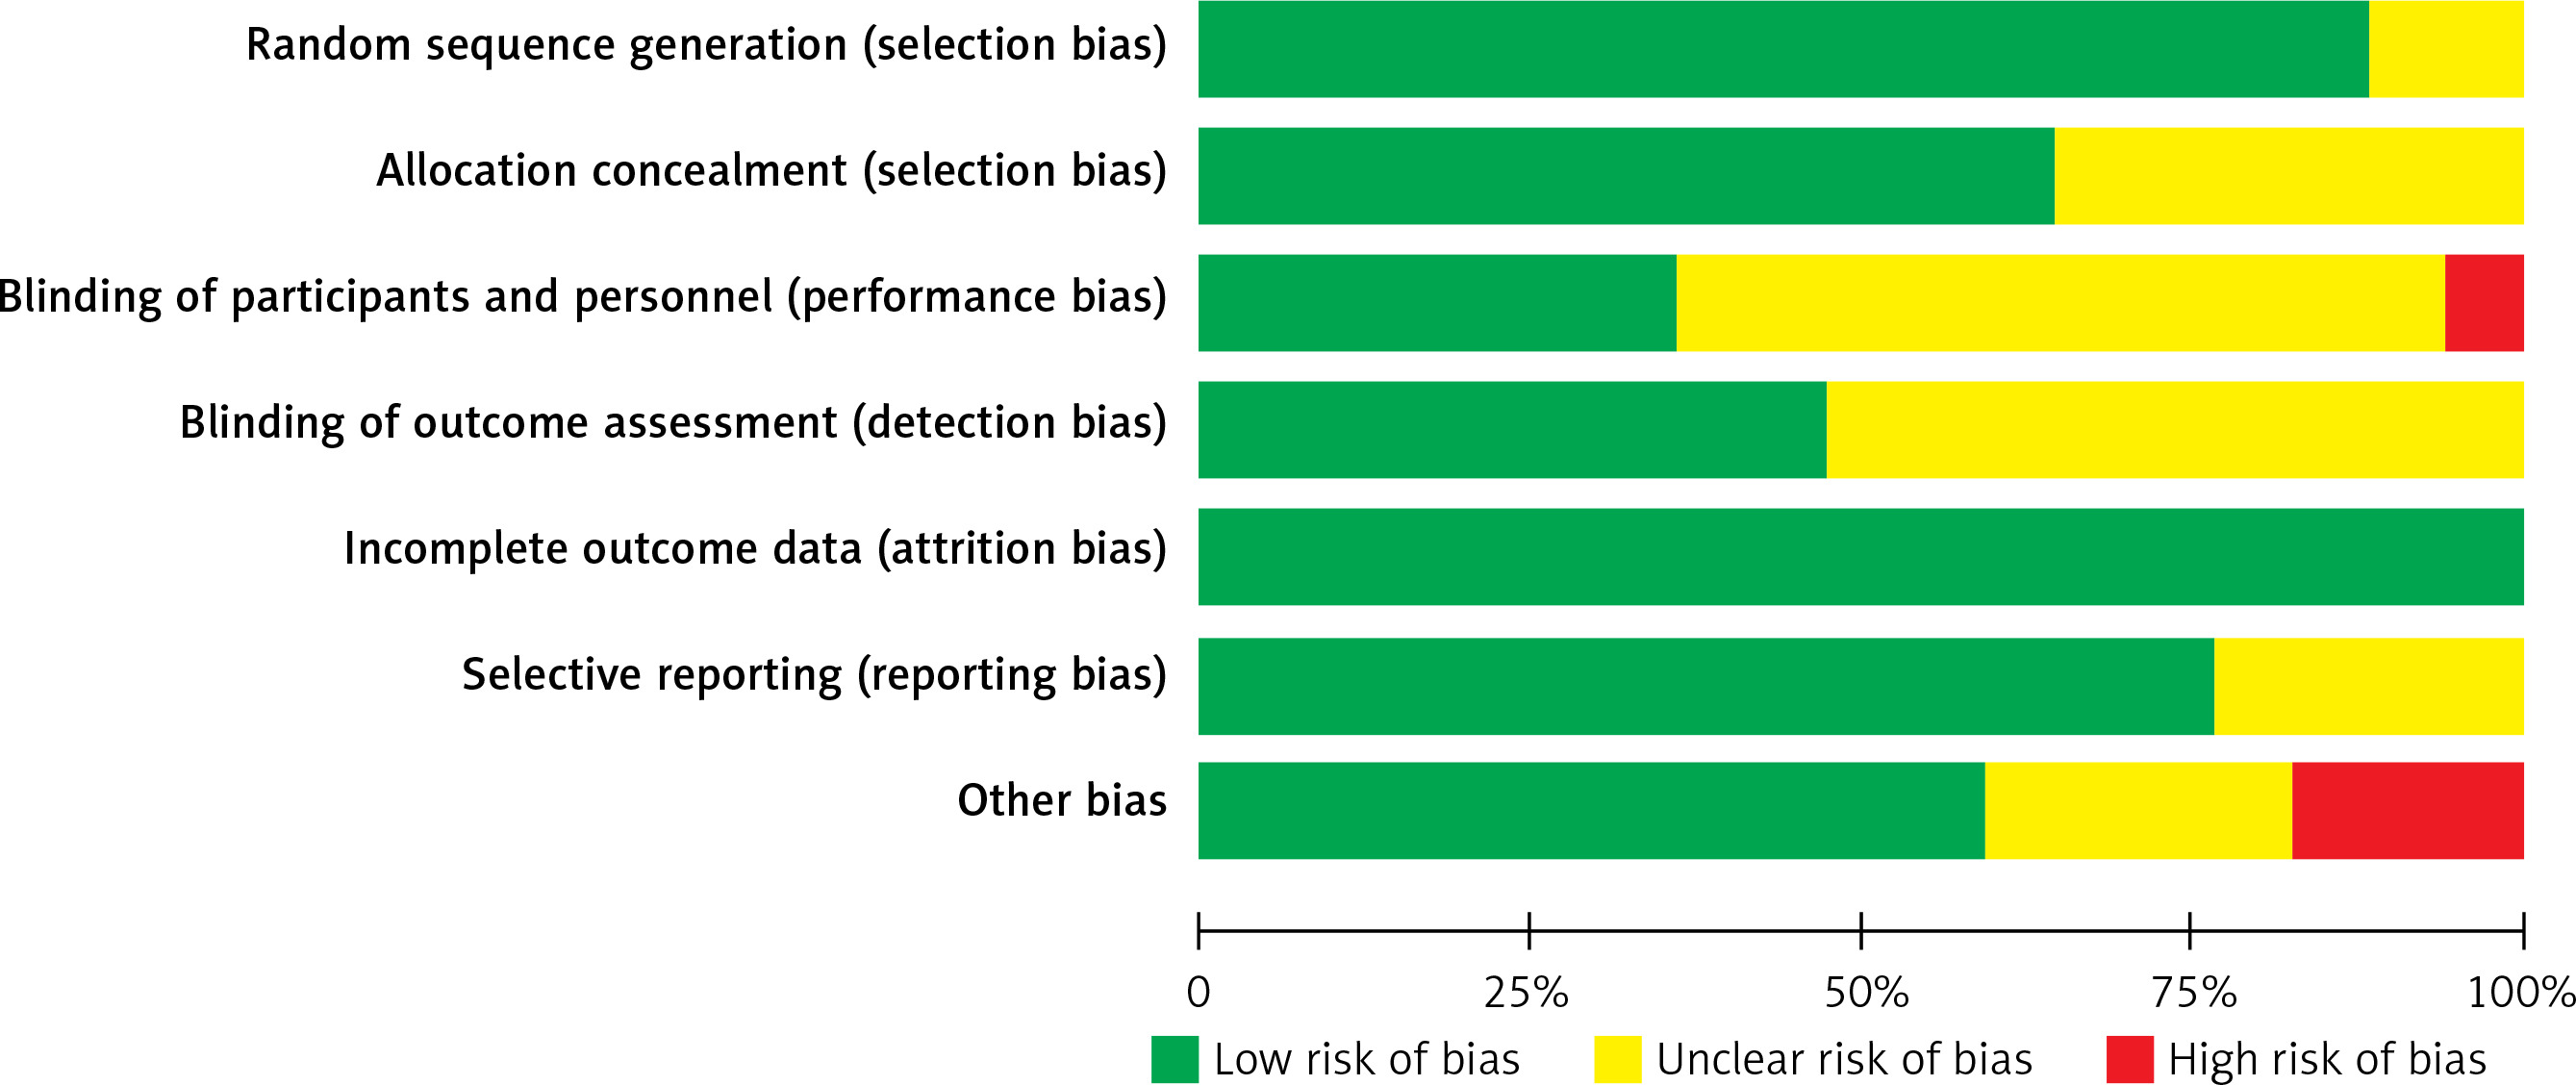
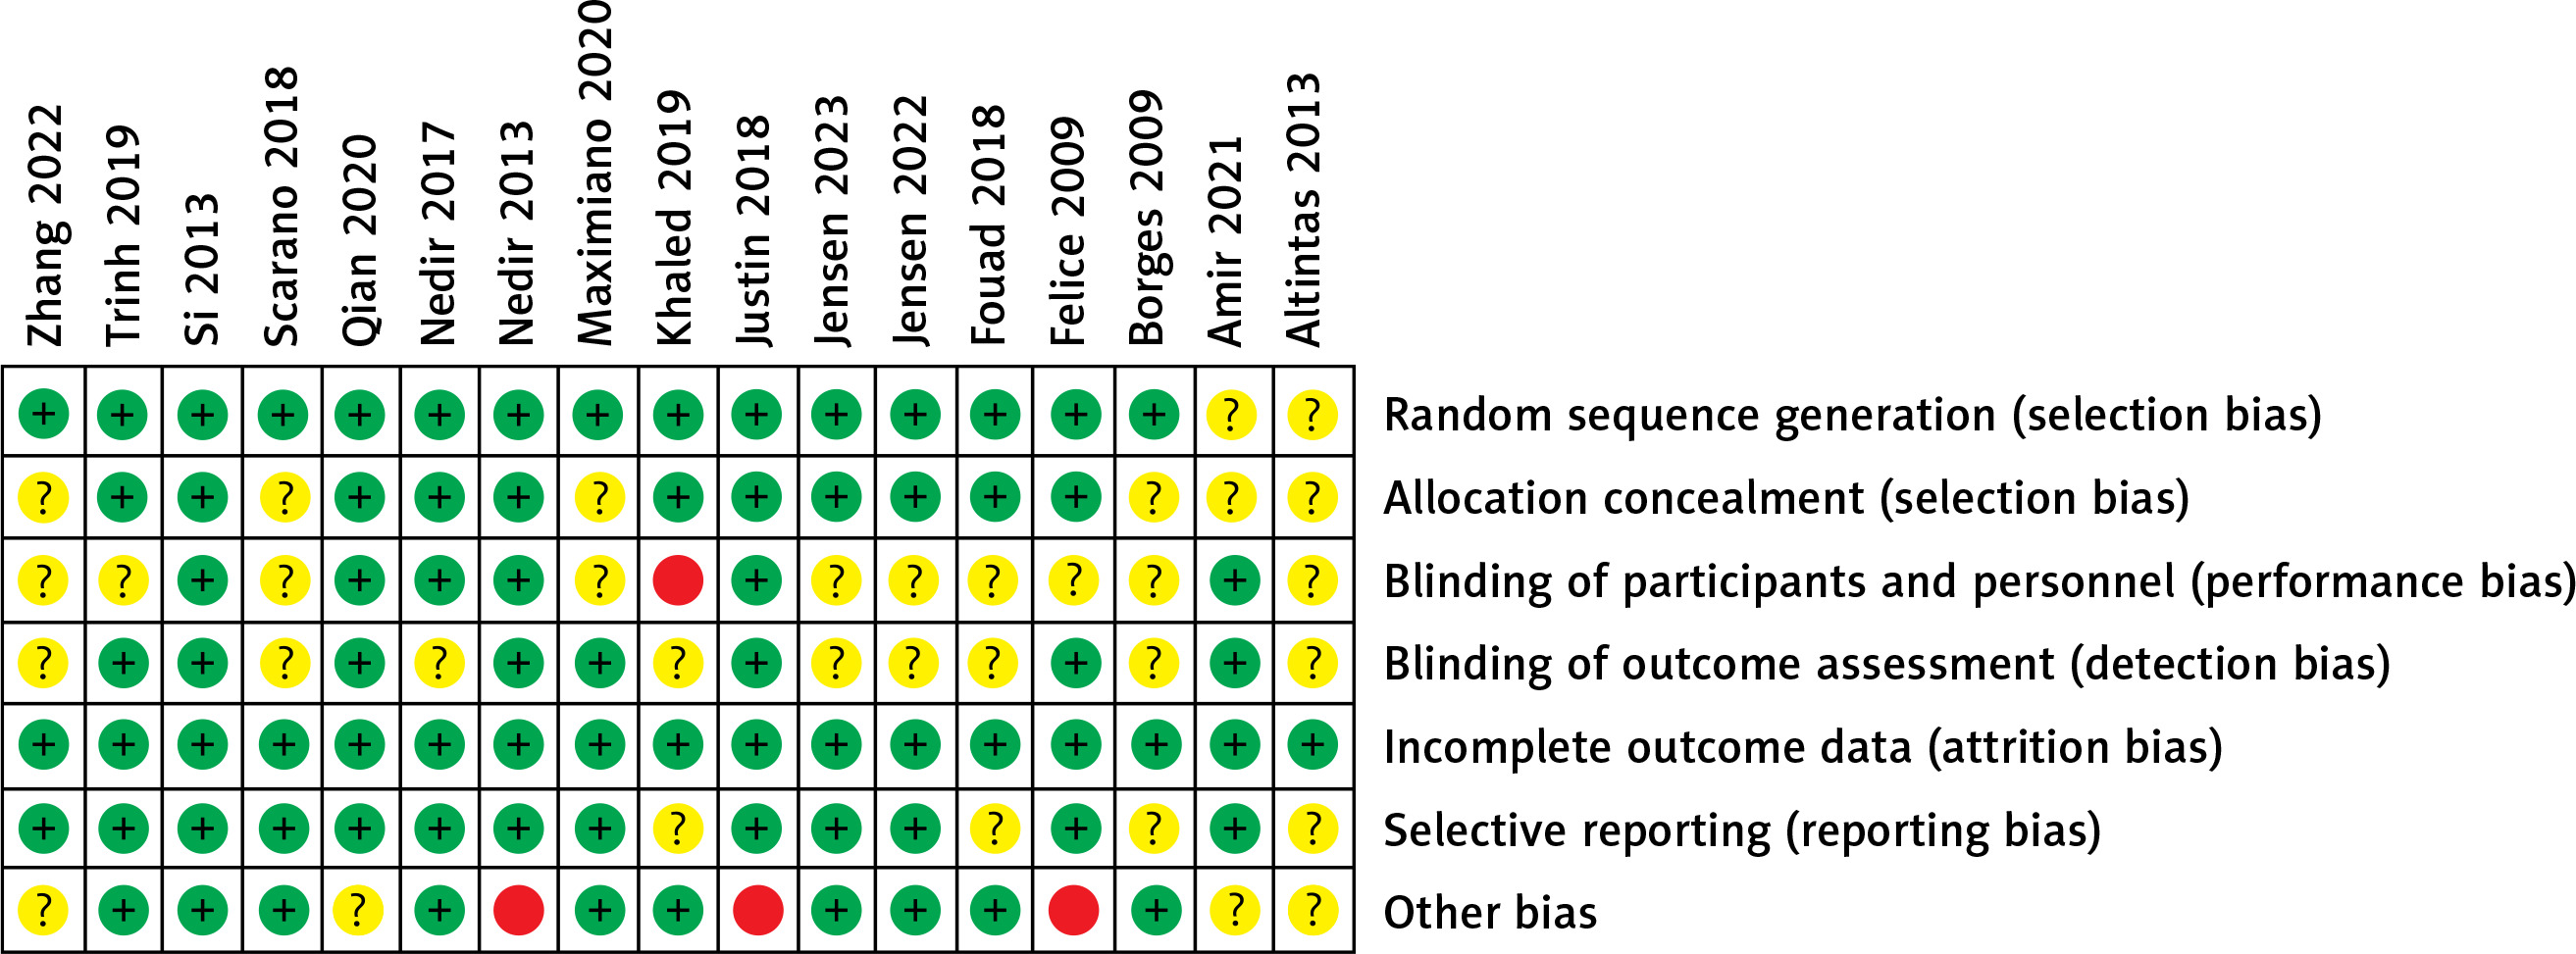
Figures 2 and 3 summarise the risk of bias assessment. Six studies were judged at a low risk of bias and the remaining 11 articles were assessed at a moderate risk of bias. All studies showed a low risk of random sequence generation, allocation concealment, incomplete outcome data, and selective bias. Regarding performance bias, one study reported no blinding of surgeons because the numbered envelopes were opened by the operators on the day of surgery. Ten studies had unclear results regarding this parameter. Nearly half of the studies were unclear regarding the blinding outcome assessment. This may be due to the difficulty in blinding investigators and patients in split-mouth studies. Three studies were judged at a high risk of other biases because these trials were sponsored by an implant company and might have had other potential biases.
Data synthesis and meta-analyses
Survival rate for implants
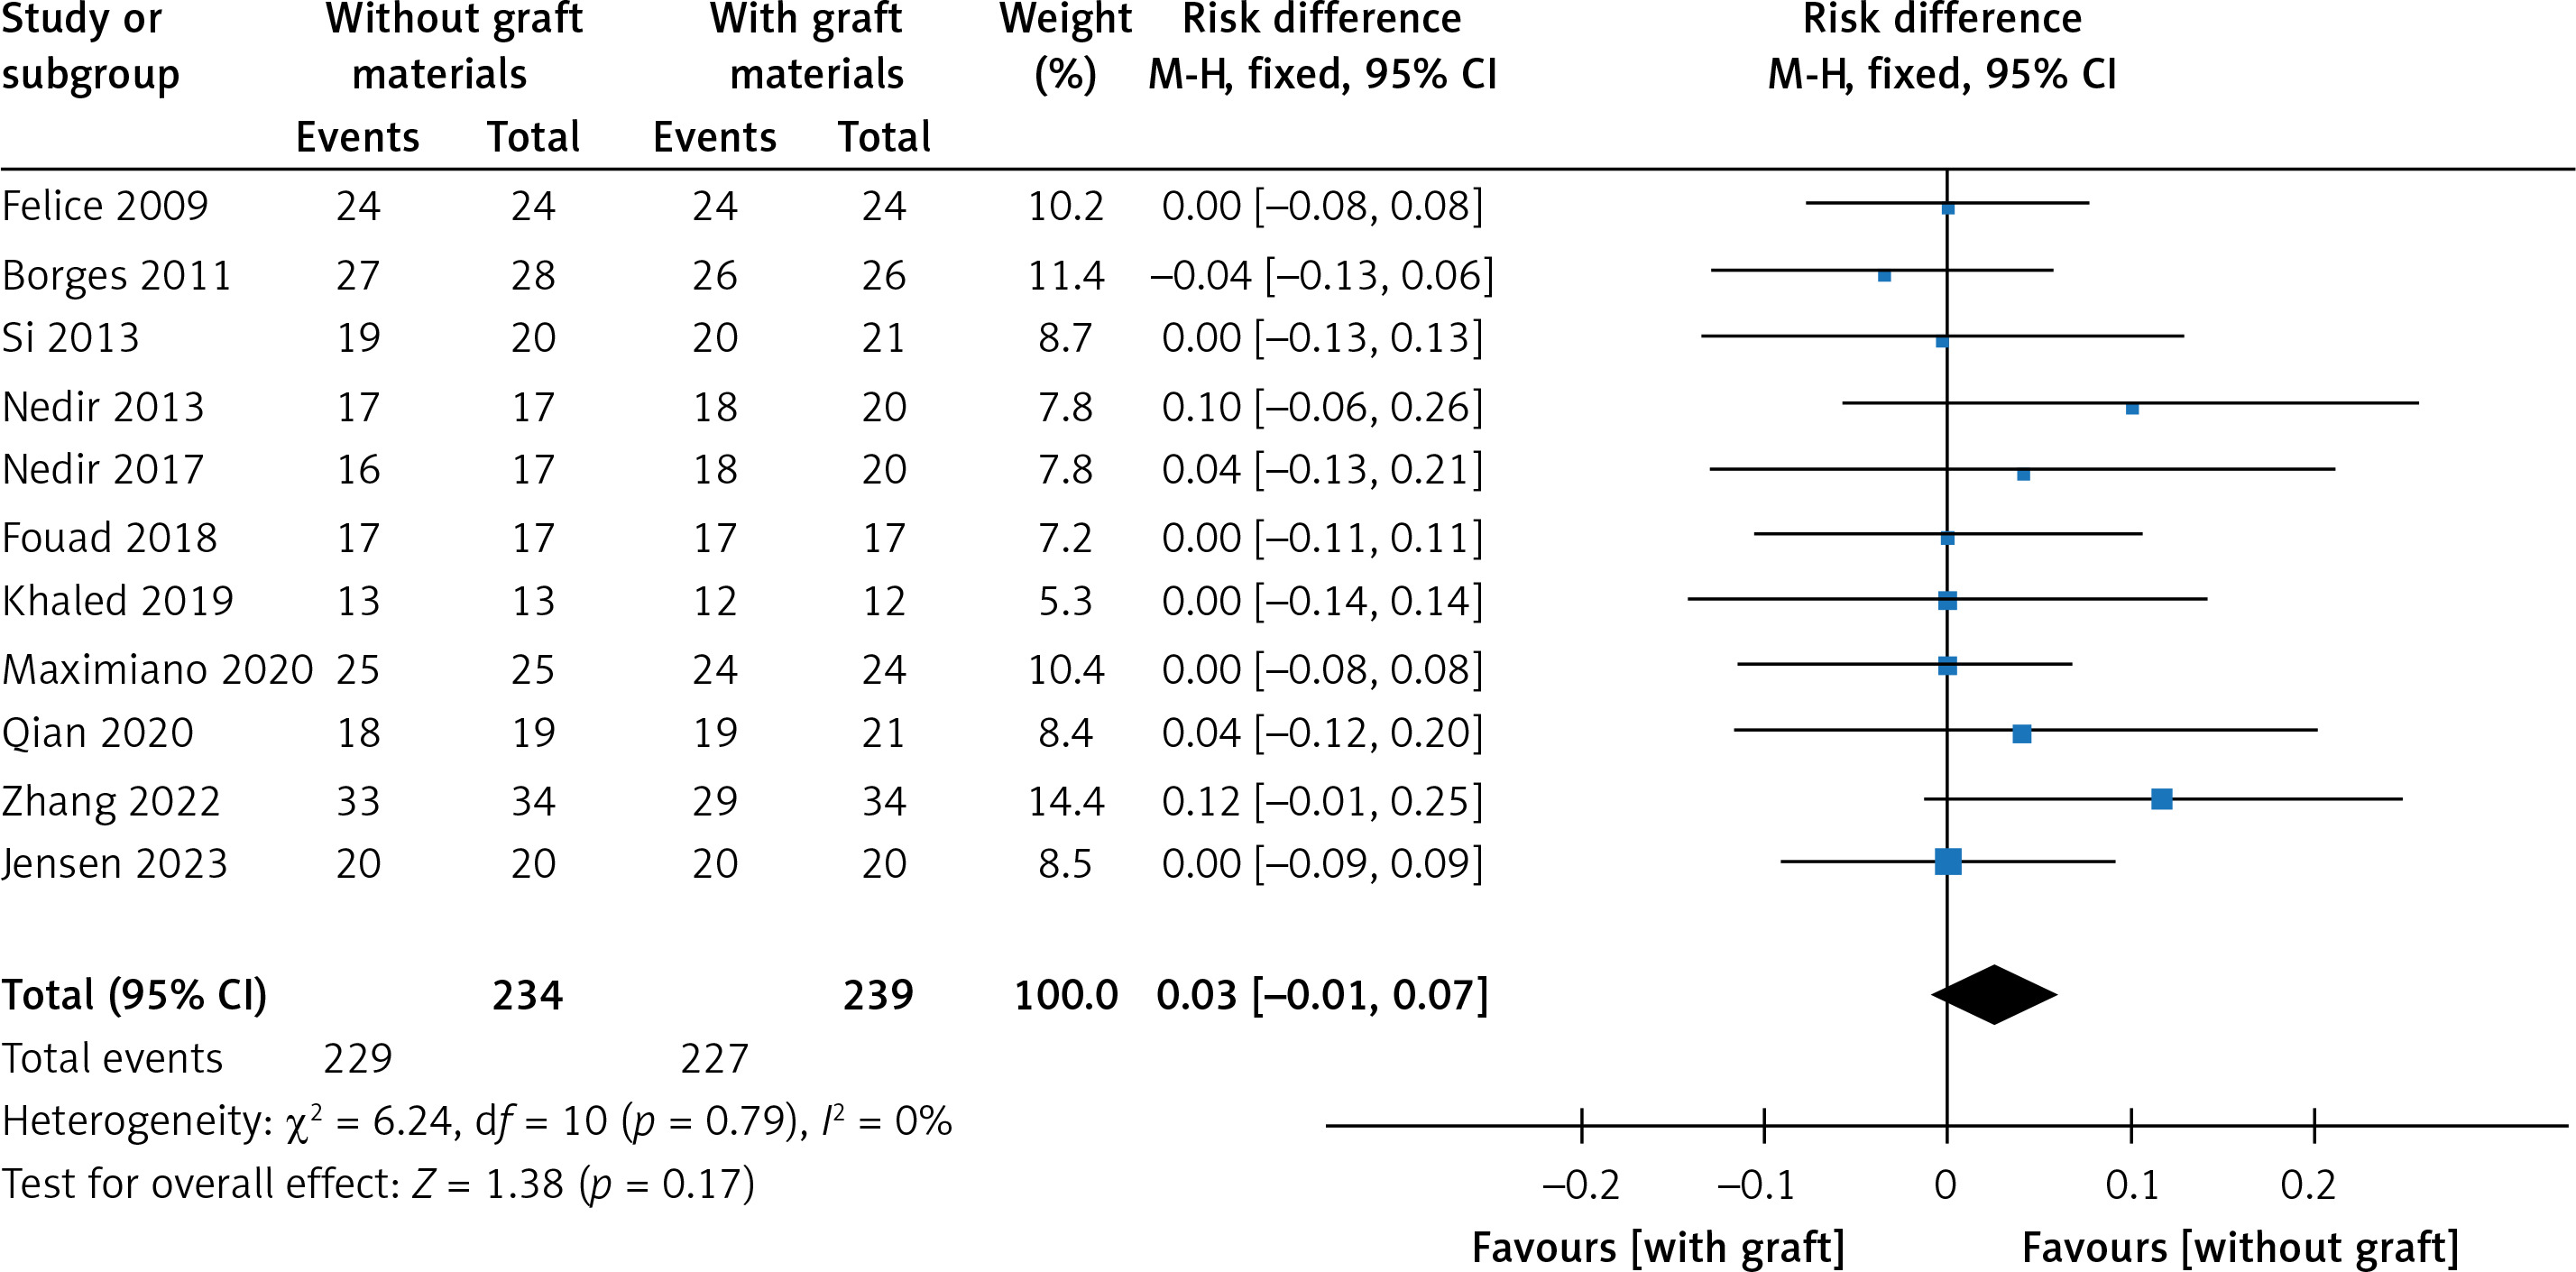
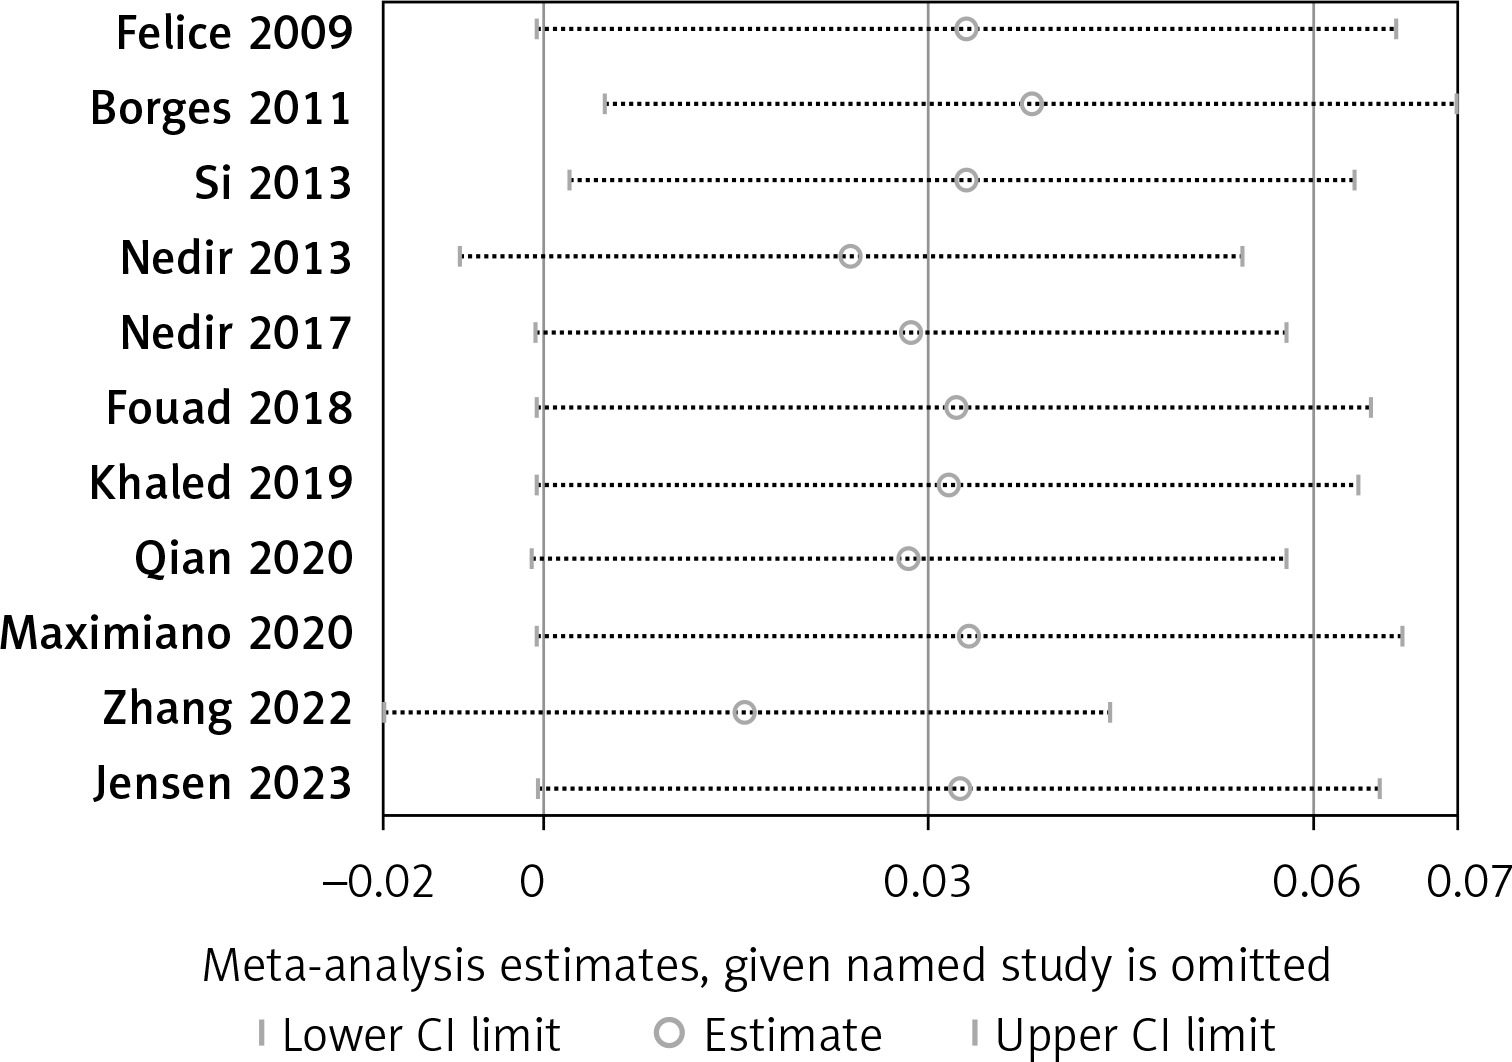
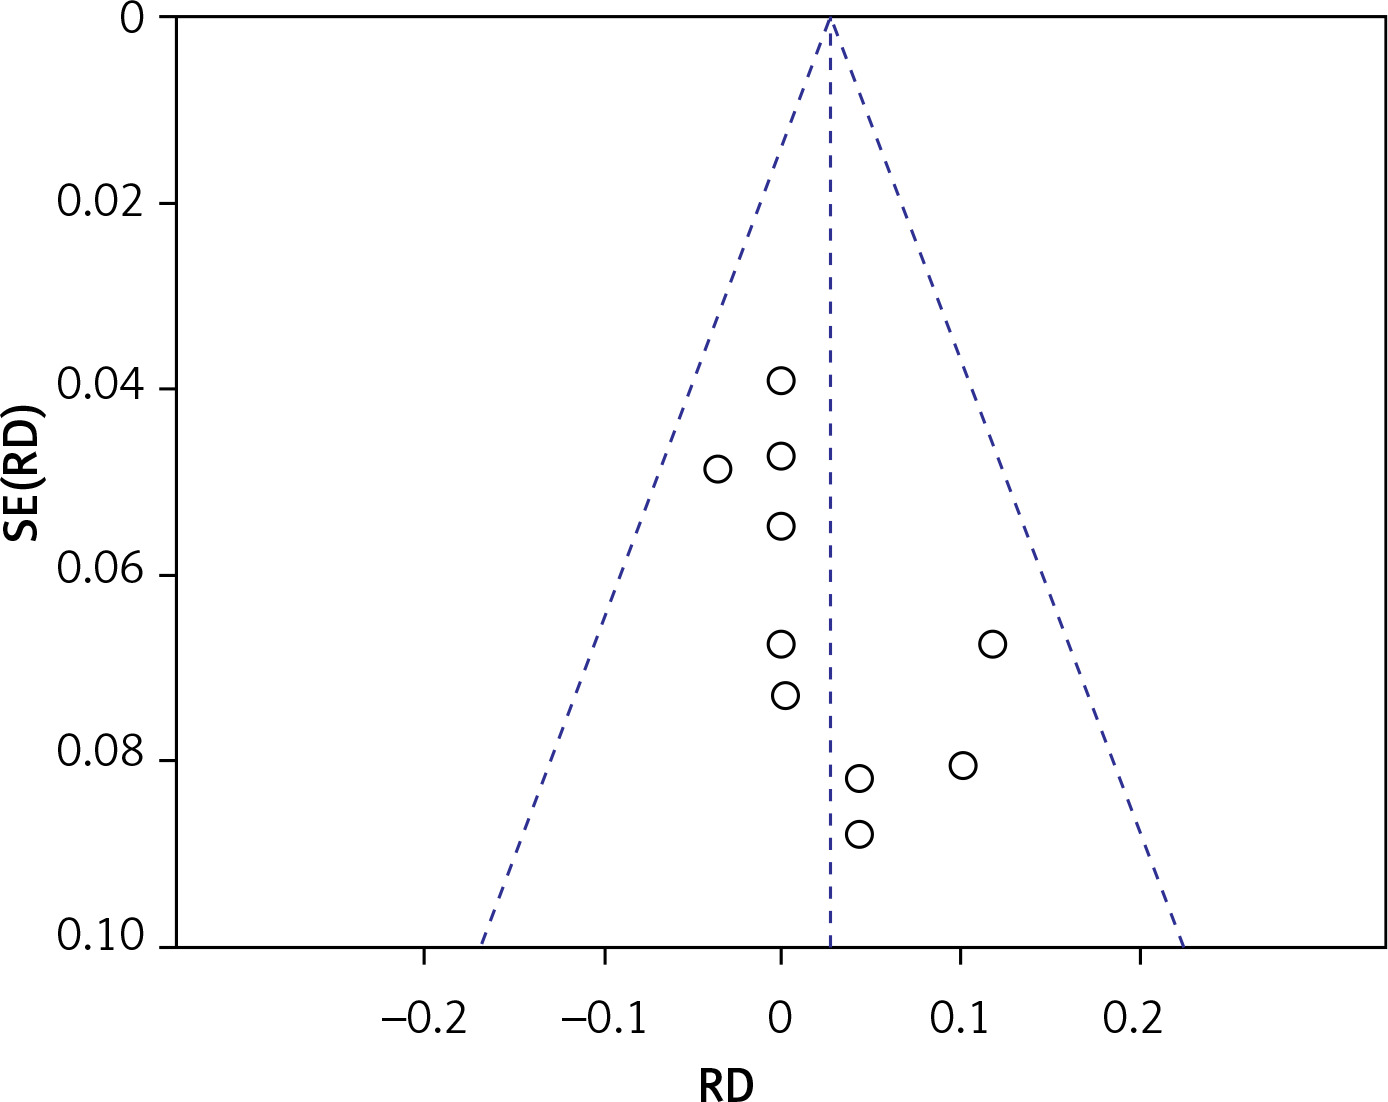
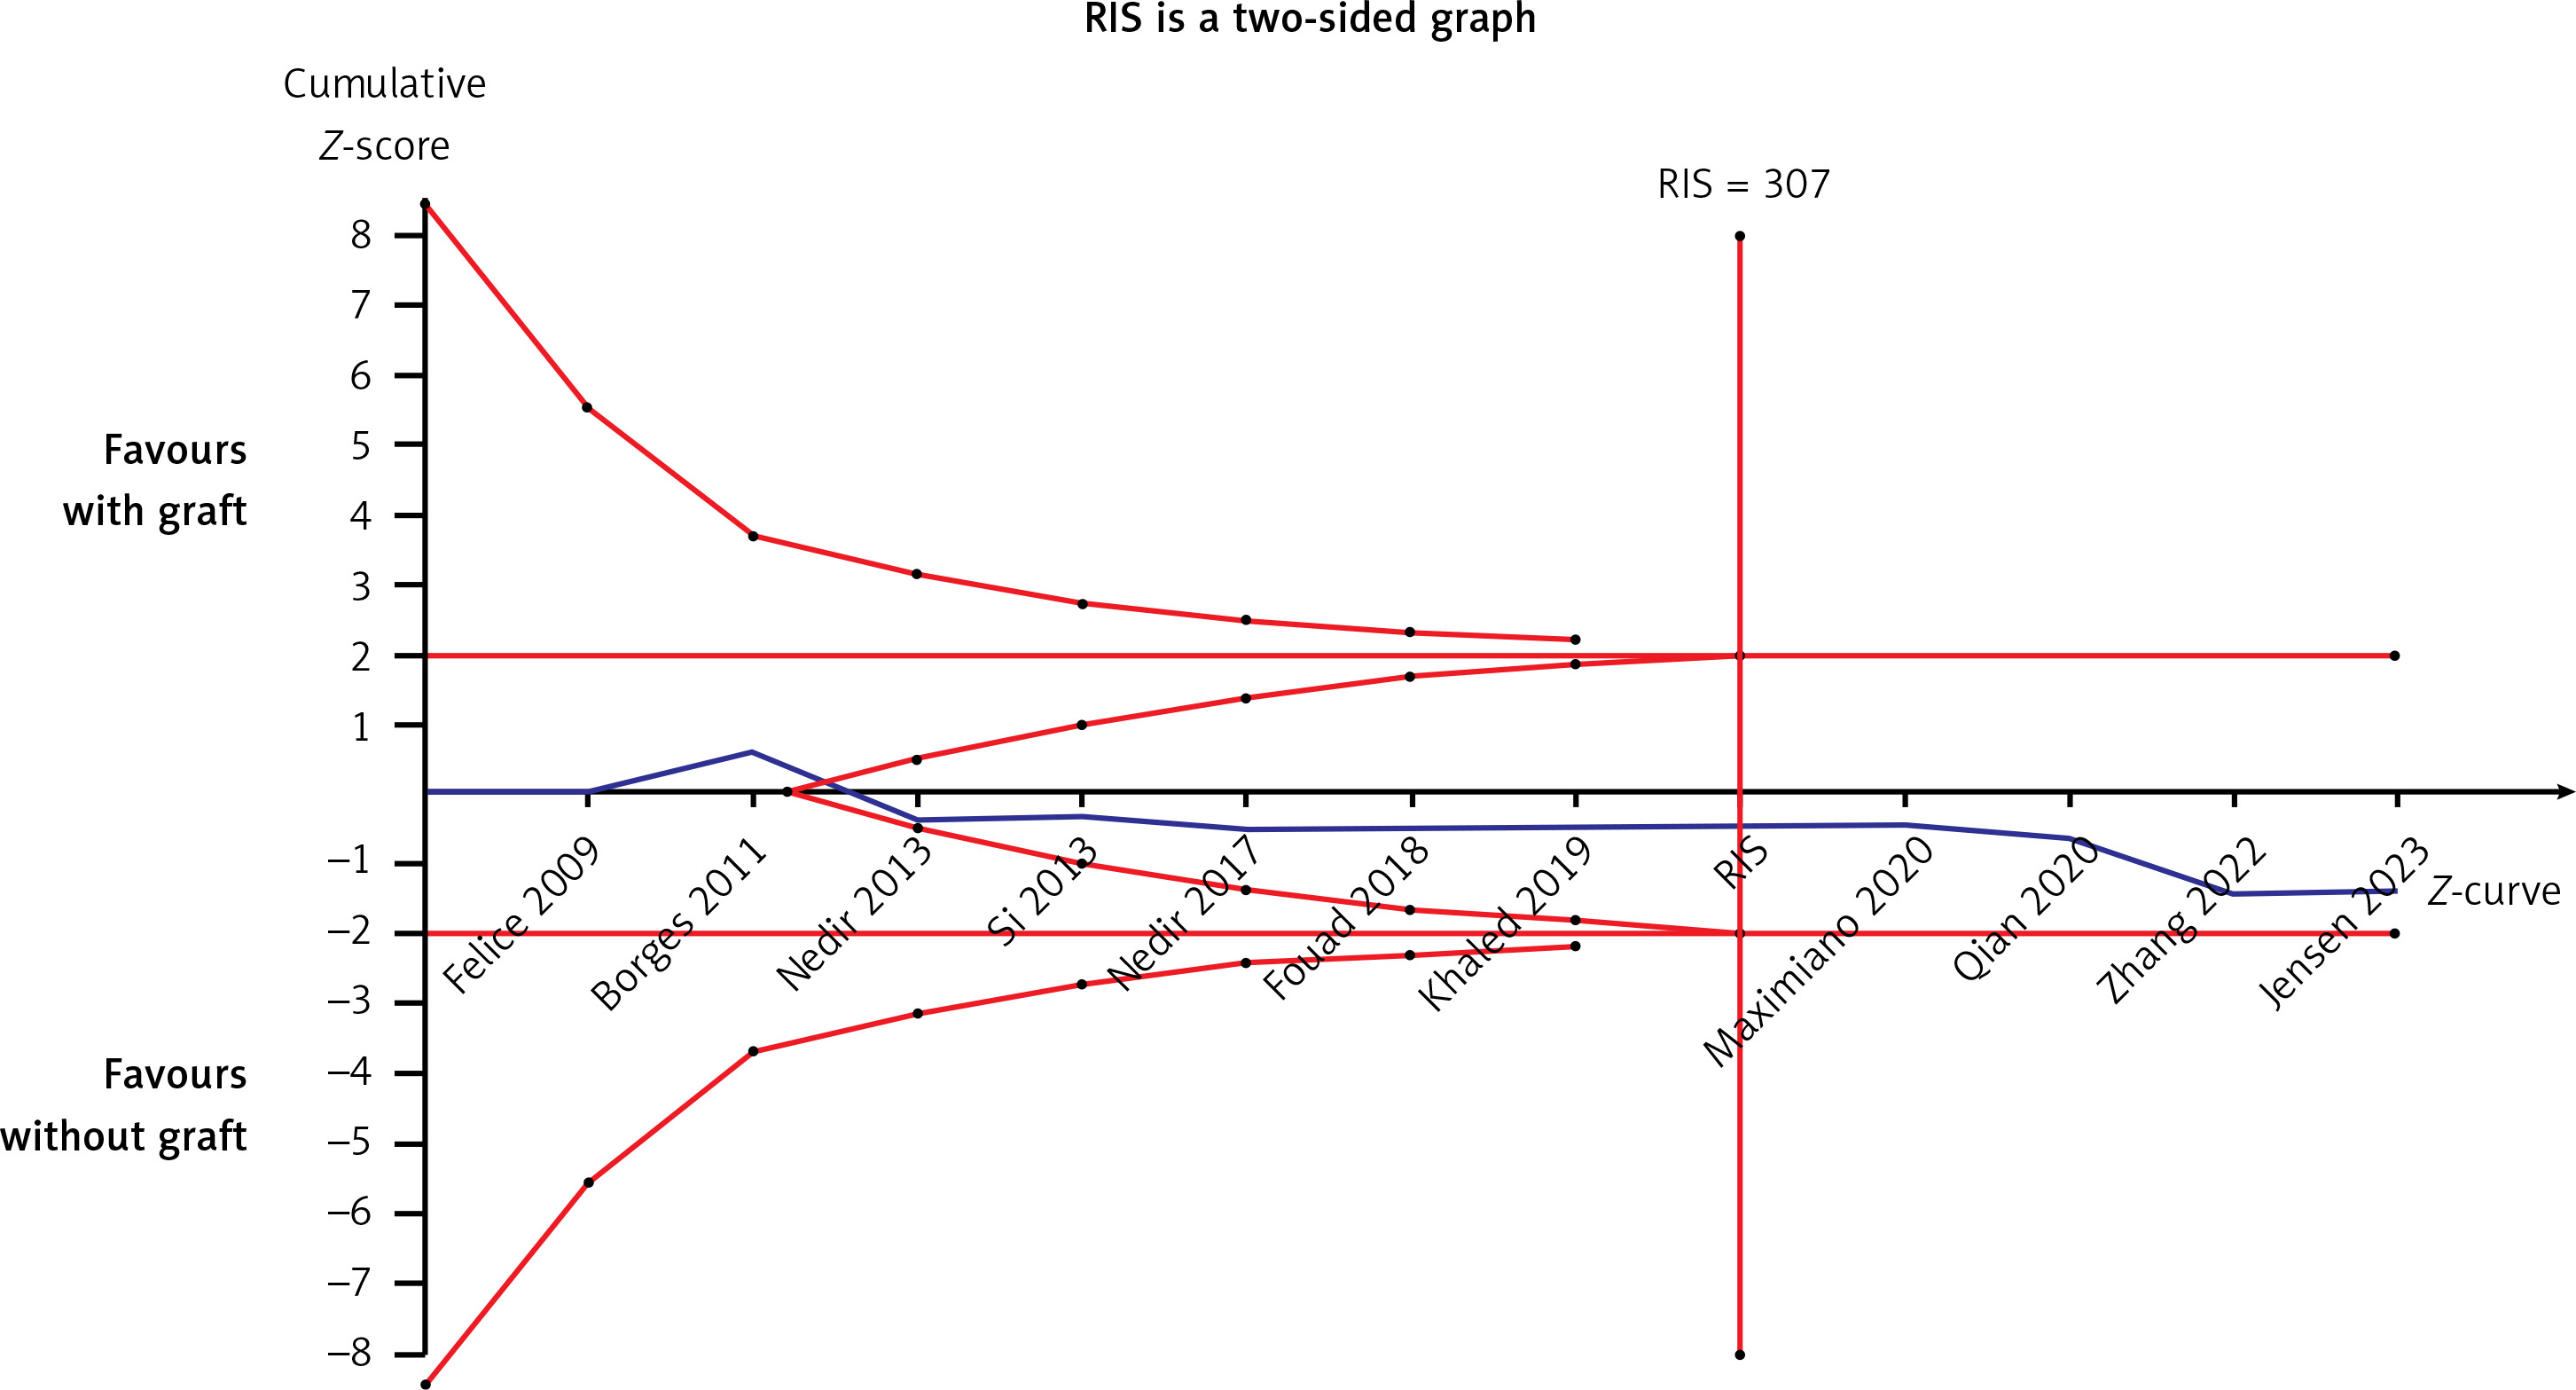
There were eleven studies that reported data on the survival rate of implants [22–24, 26, 28–32, 34, 36]. Eleven articles demonstrated high survival rates in the without-graft and with-graft groups, with weighted survival rates of 97.93% and 95.21%, respectively. No evidence of heterogeneity was found in this meta-analysis (p = 0.79, I2 = 0%). A fixed effect was used in the data synthesis. Figure 4 shows no statistical difference between the two groups, with RD of 0.03 (95% CI: –0.01–0.07, p = 0.17). The stability of the results is presented in Figure 5. There were no statistical differences after excluding each study individually, suggesting that the results had strong stability. A funnel plot was drawn from studies comparing survival rates (Figure 6). No studies were found outside the funnel plots. This symmetry may indicate the absence of publication bias. Egger’s test confirmed this conclusion (p = 0.062). Using TSA boundaries to favour the survival rate showed that an RIS of 307 was required to achieve 80% test power. The RIS can be acquired from the pooled data. Meanwhile, the Z-curve crossed the futility boundary and failed to reach the conventional boundaries. This firmly indicates that the cumulative evidence from the present literature supports no difference between the test and control groups (Figure 7).
Perforation
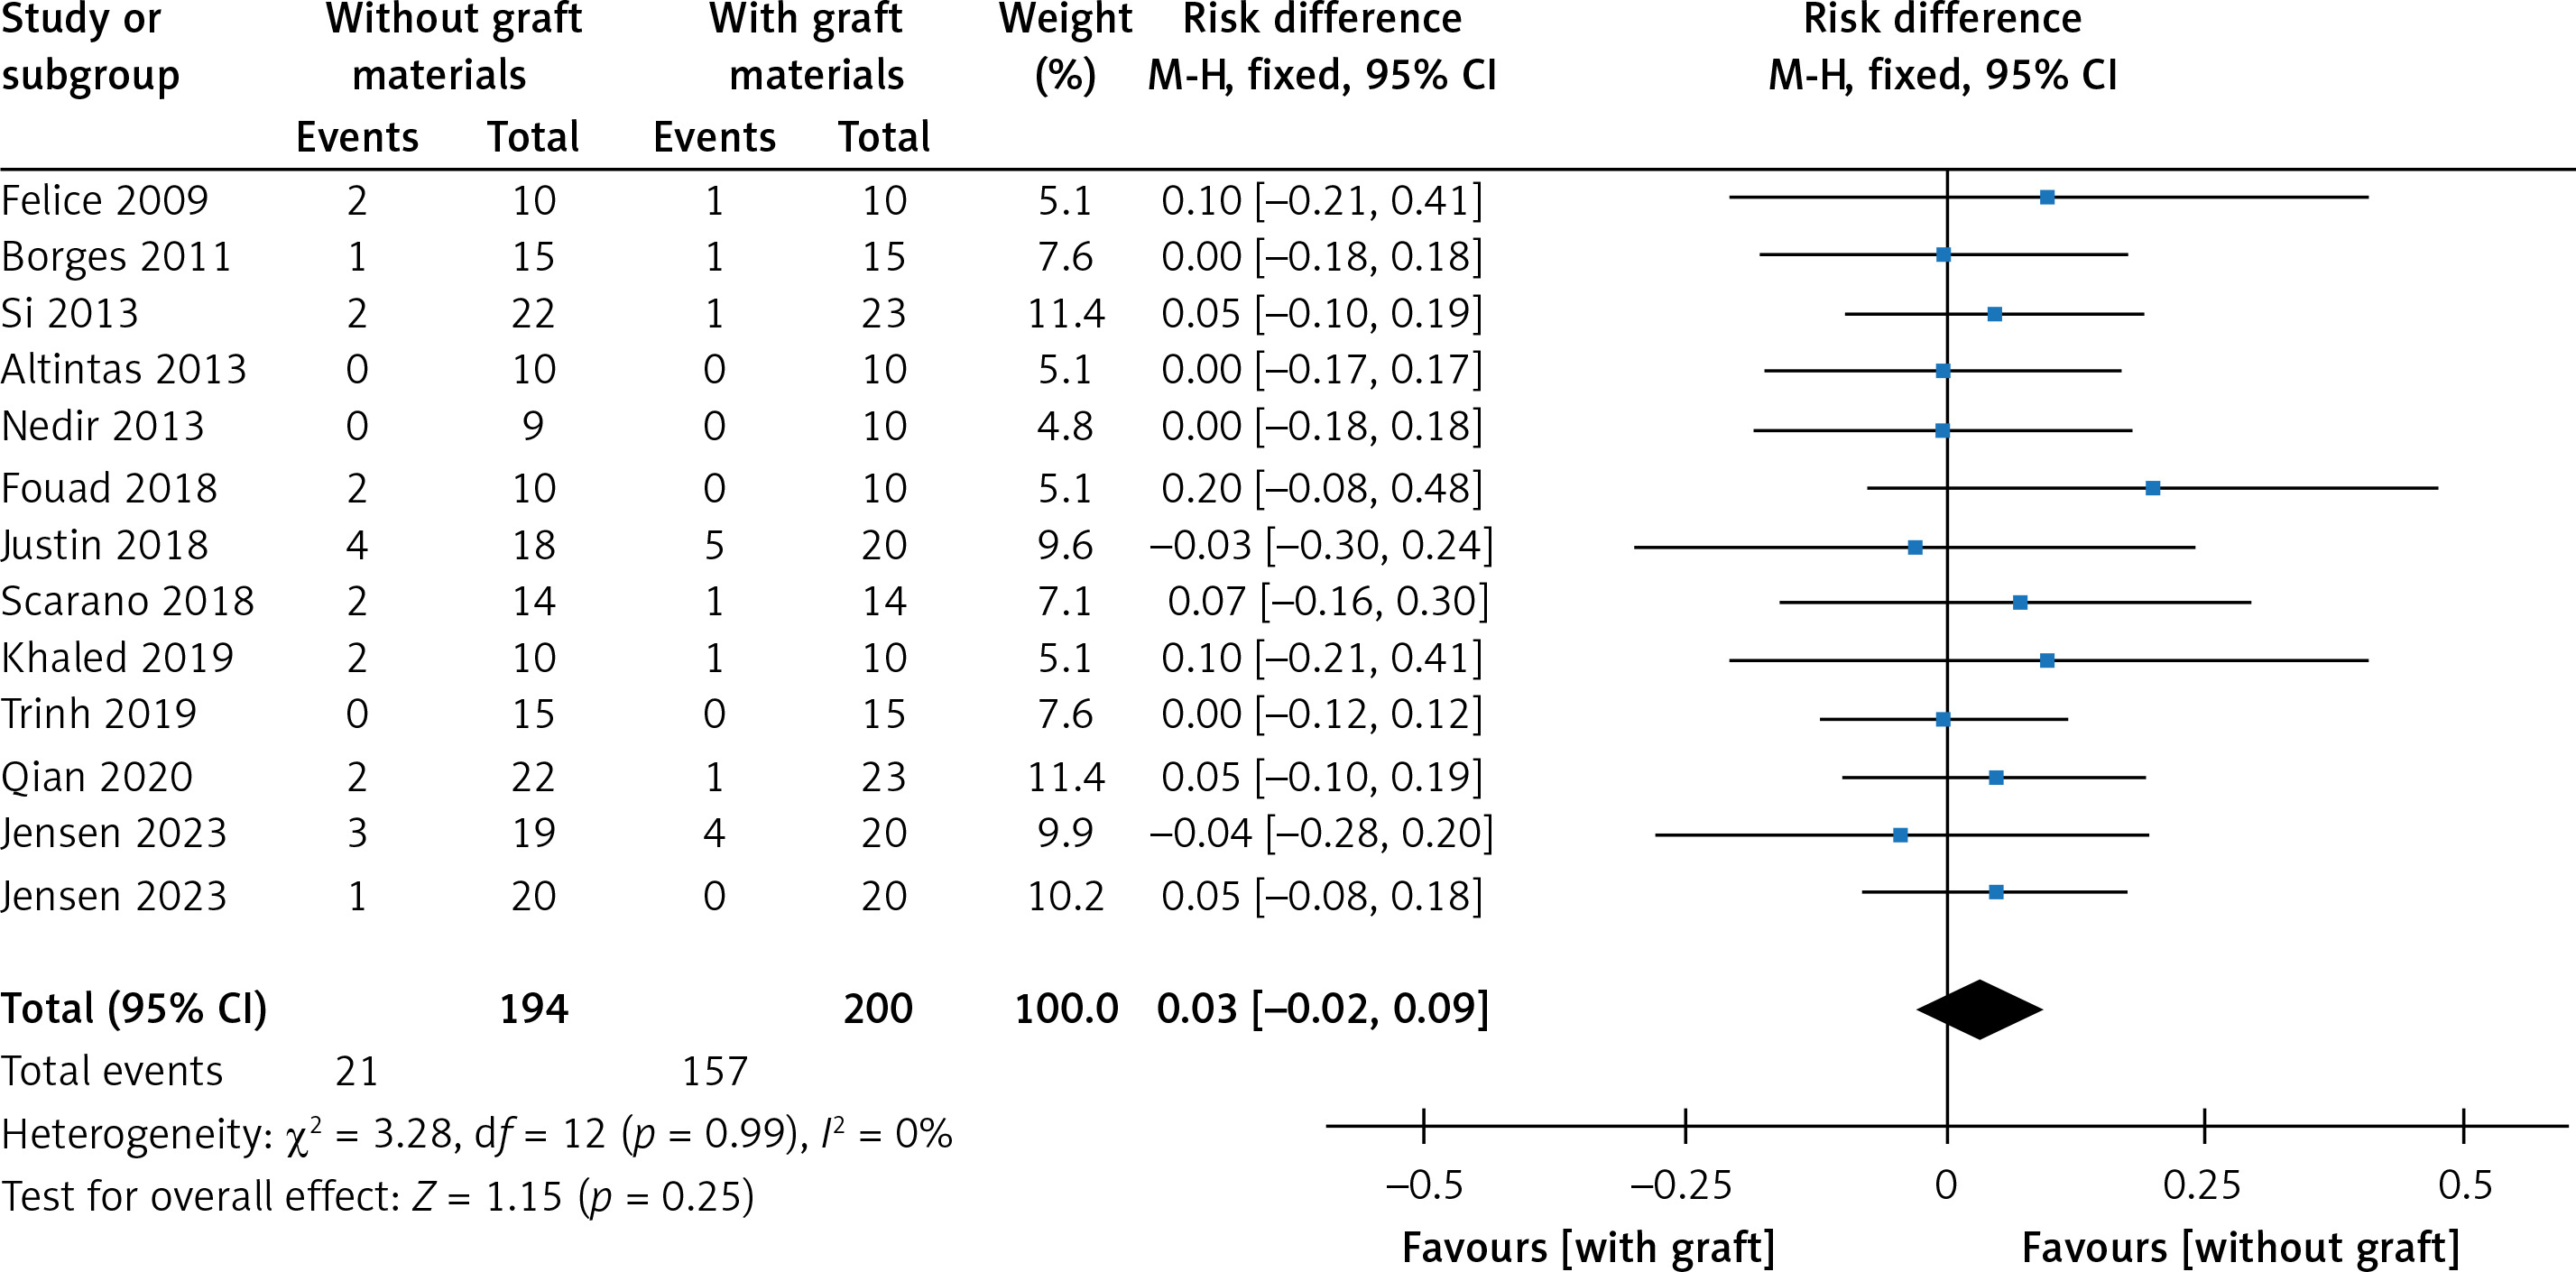
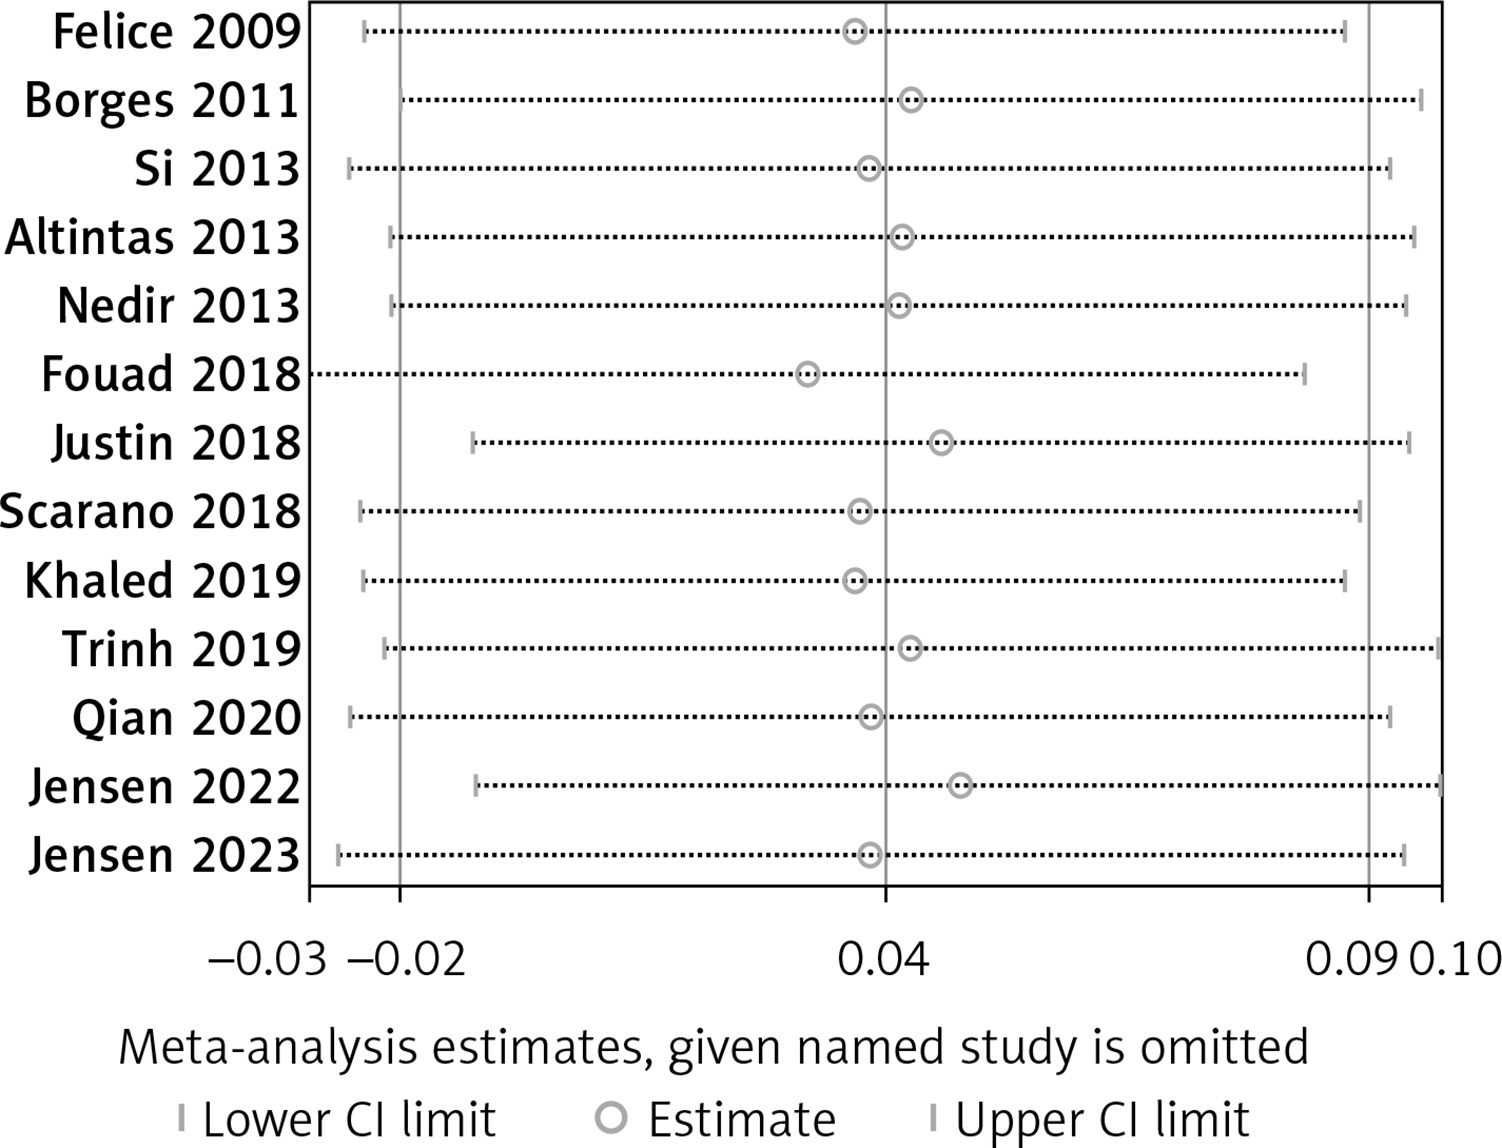
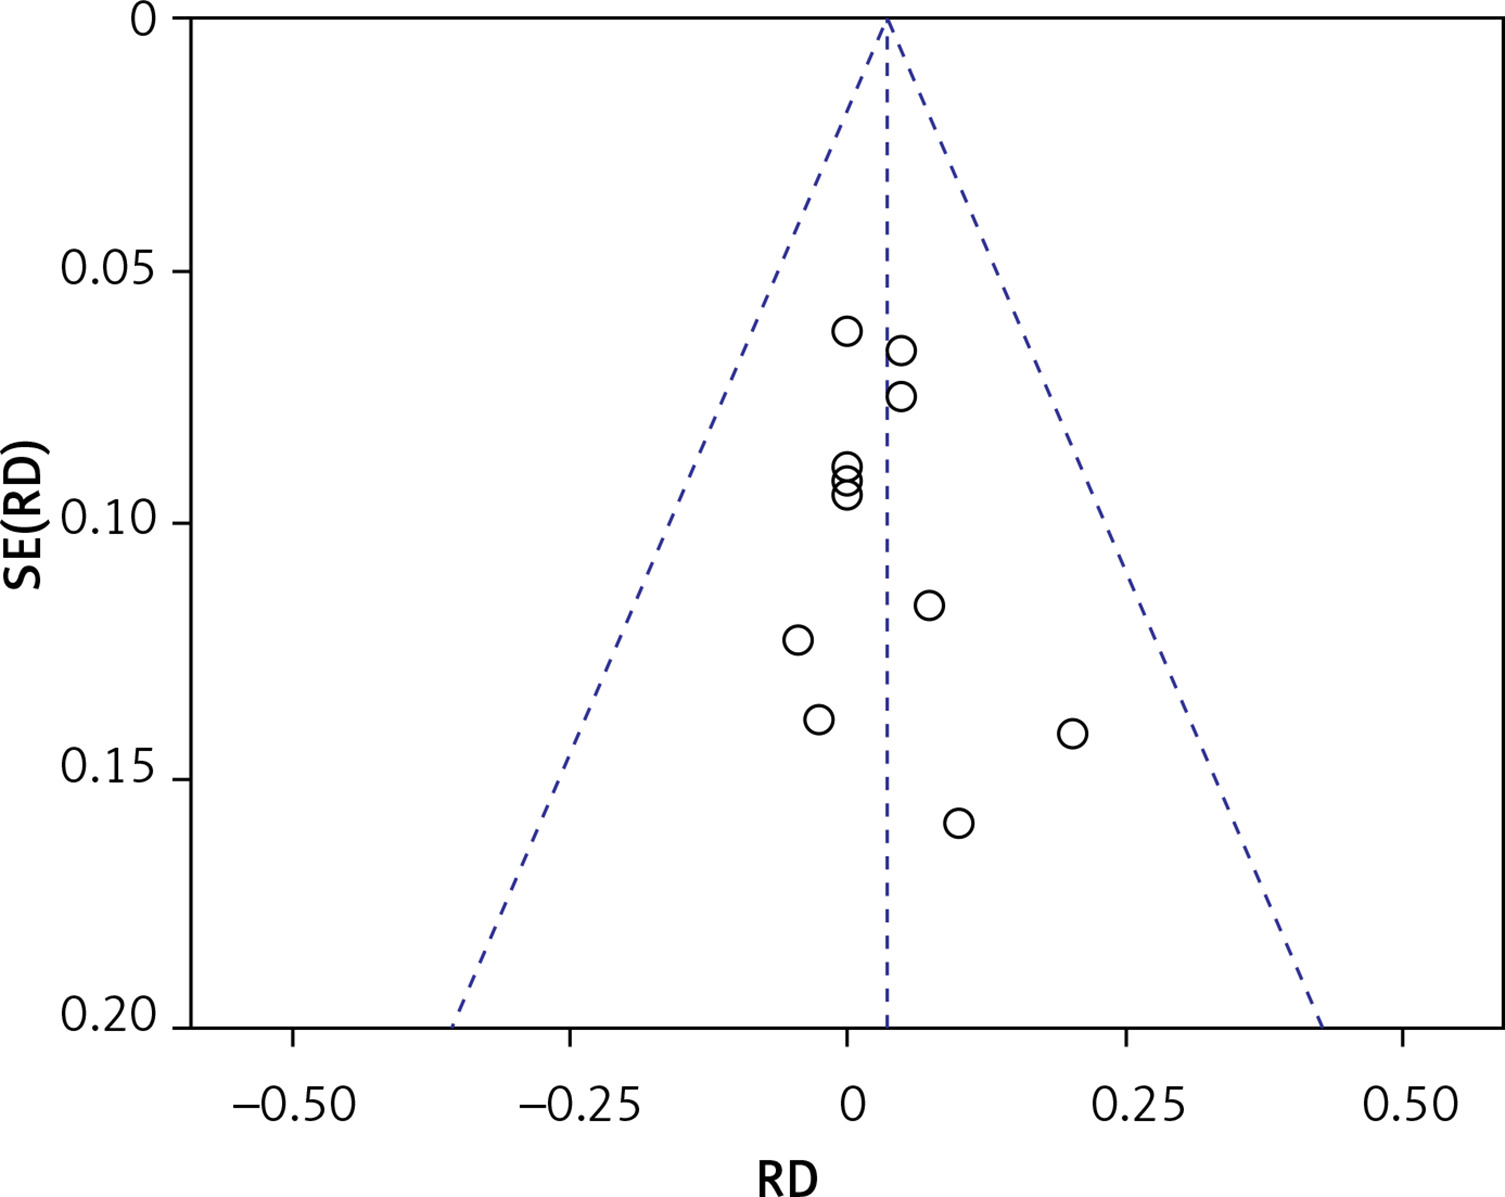
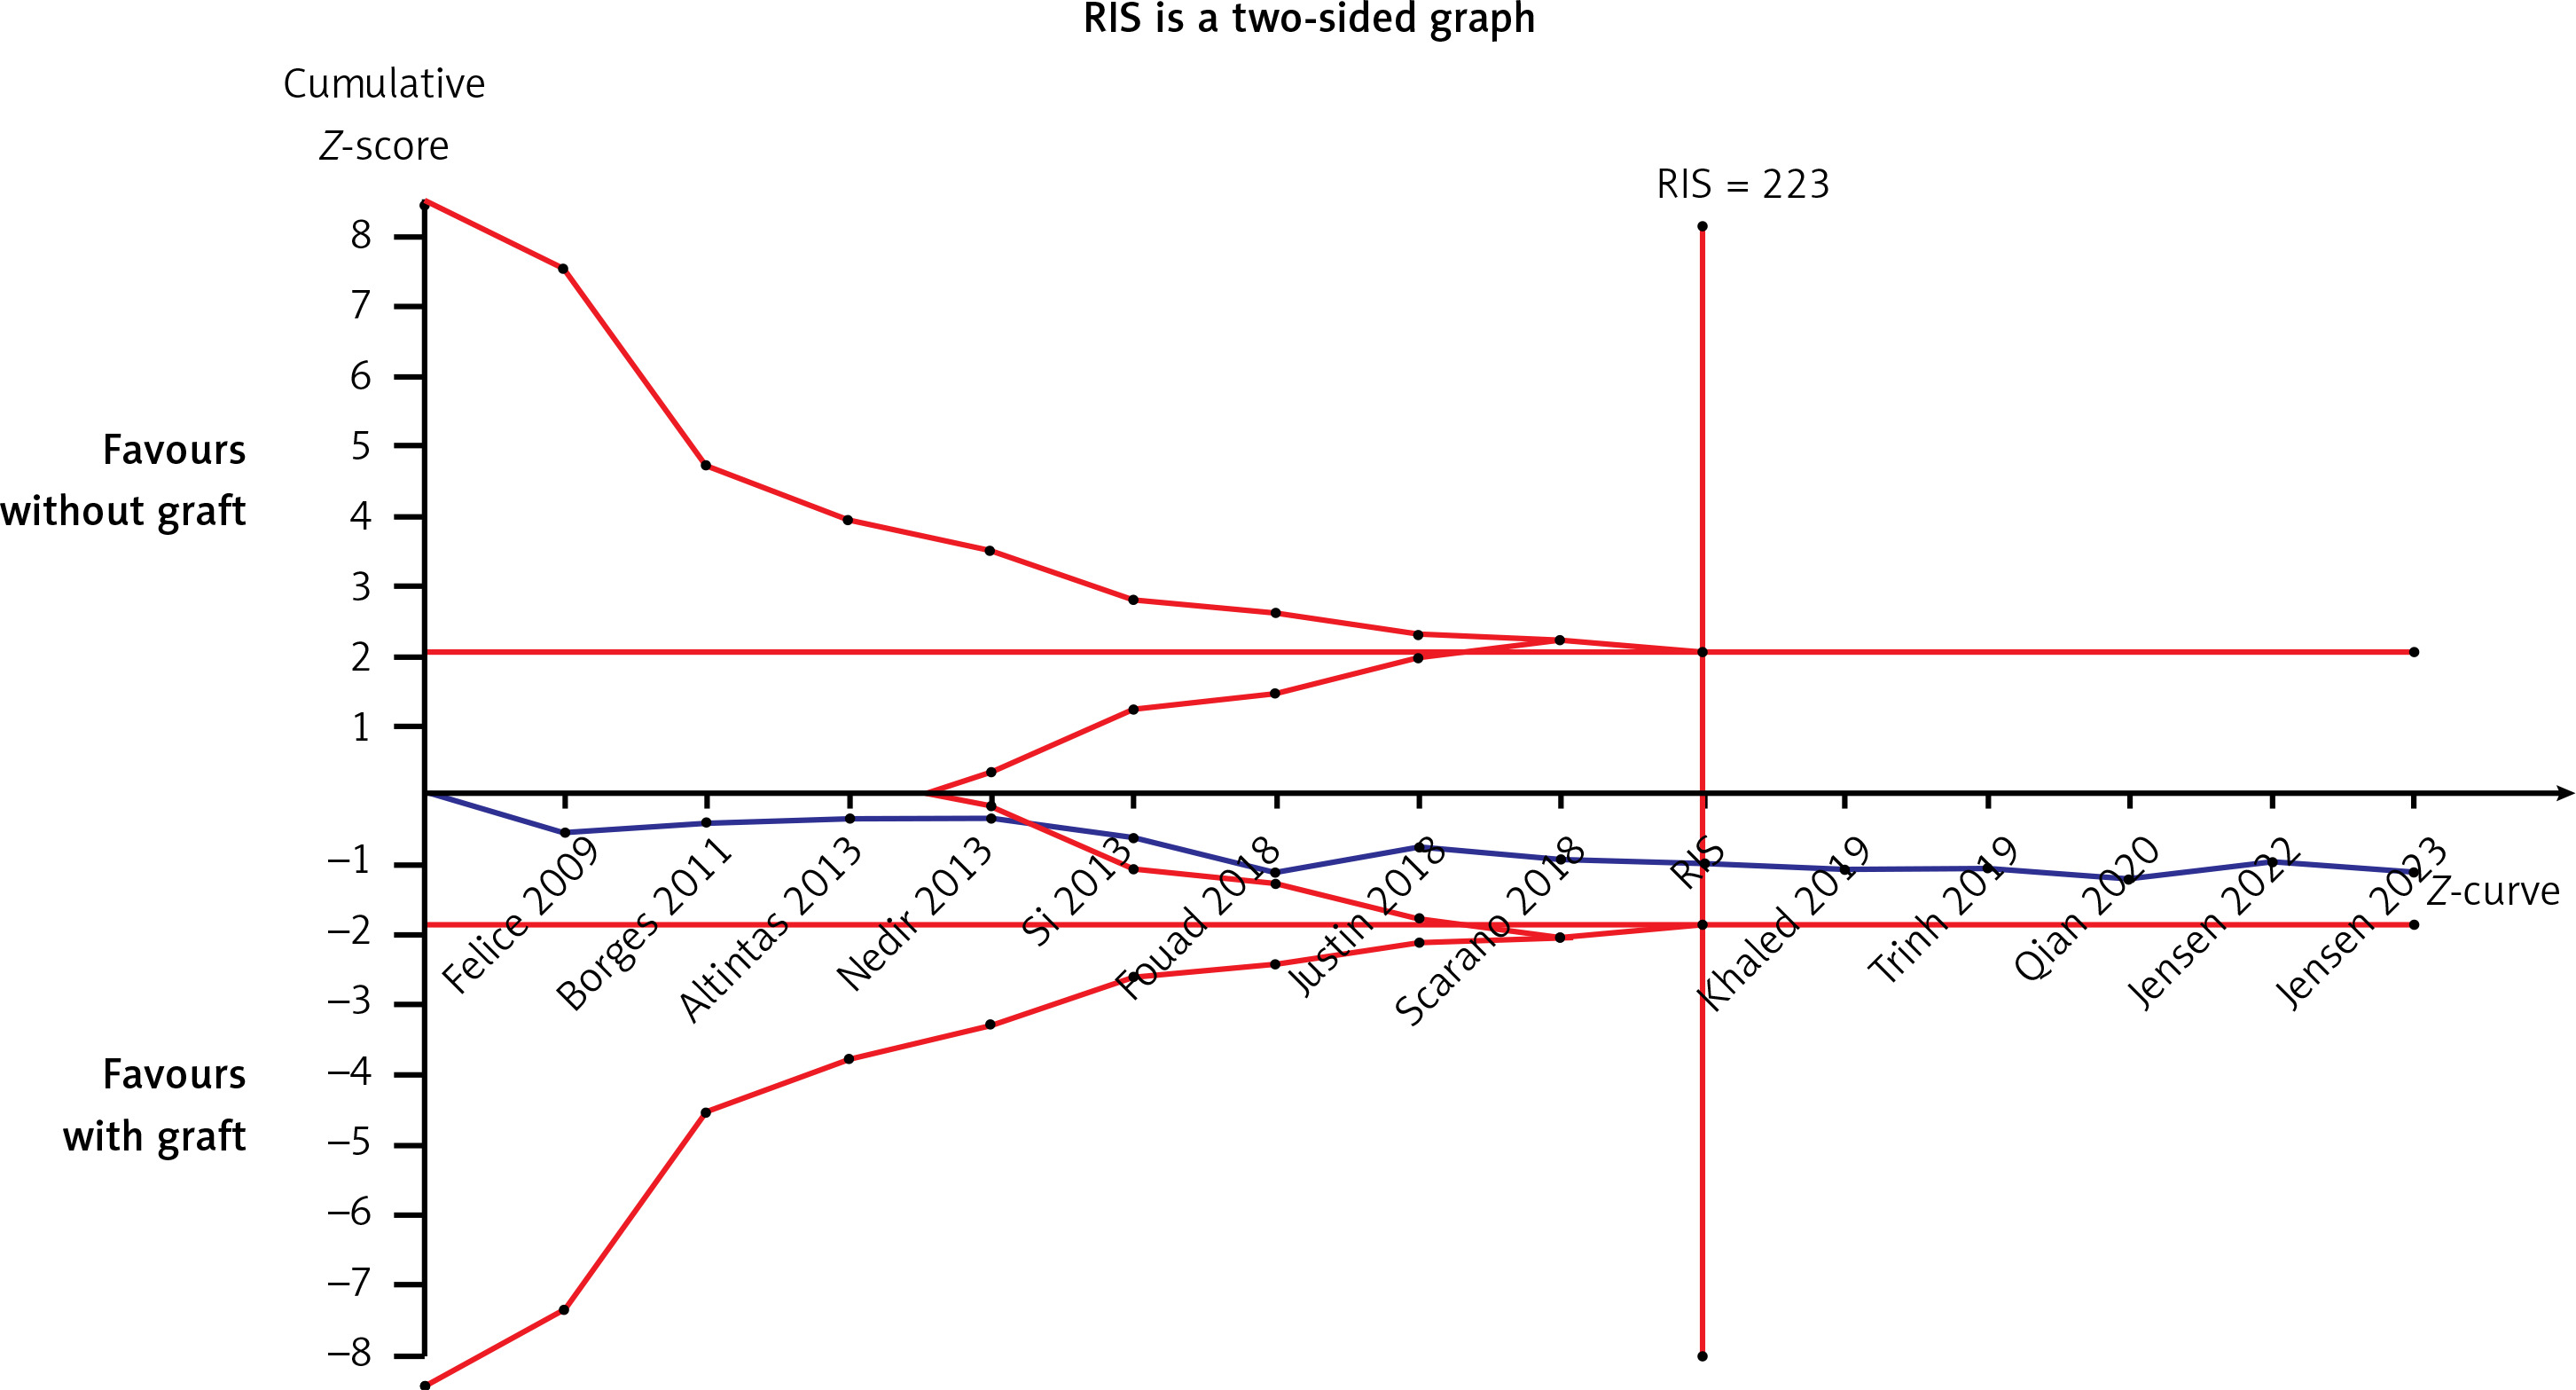
Thirteen articles described membrane perforation complications during membrane elevation [20, 22–28, 30, 32–35]. A fixed-effects model was applied because there was no evidence of heterogeneity (p = 0.99, I2 = 0%). The pooled outcome showed no statistical difference in perforation between the non-grafted and grafted group (Figure 8): RD = 0.03 (95% CI: –0.02–0.09). The pooled outcomes from the articles were robust in the sensitivity analysis (Figure 9). Funnel plots suggested that no publication bias was present in this meta-analysis (Figure 10). Quantitative analysis of publication bias indicated no small-study effects (p = 0.306). The TSA showed firm evidence supporting the lack of difference in perforation between the two methods for MSFE. The Z-curve successfully crossed the futility boundary for perforation, and reached an RIS of 223, demonstrating adequate evidence to draw a firm conclusion from the current study (Figure 11).
ESBG
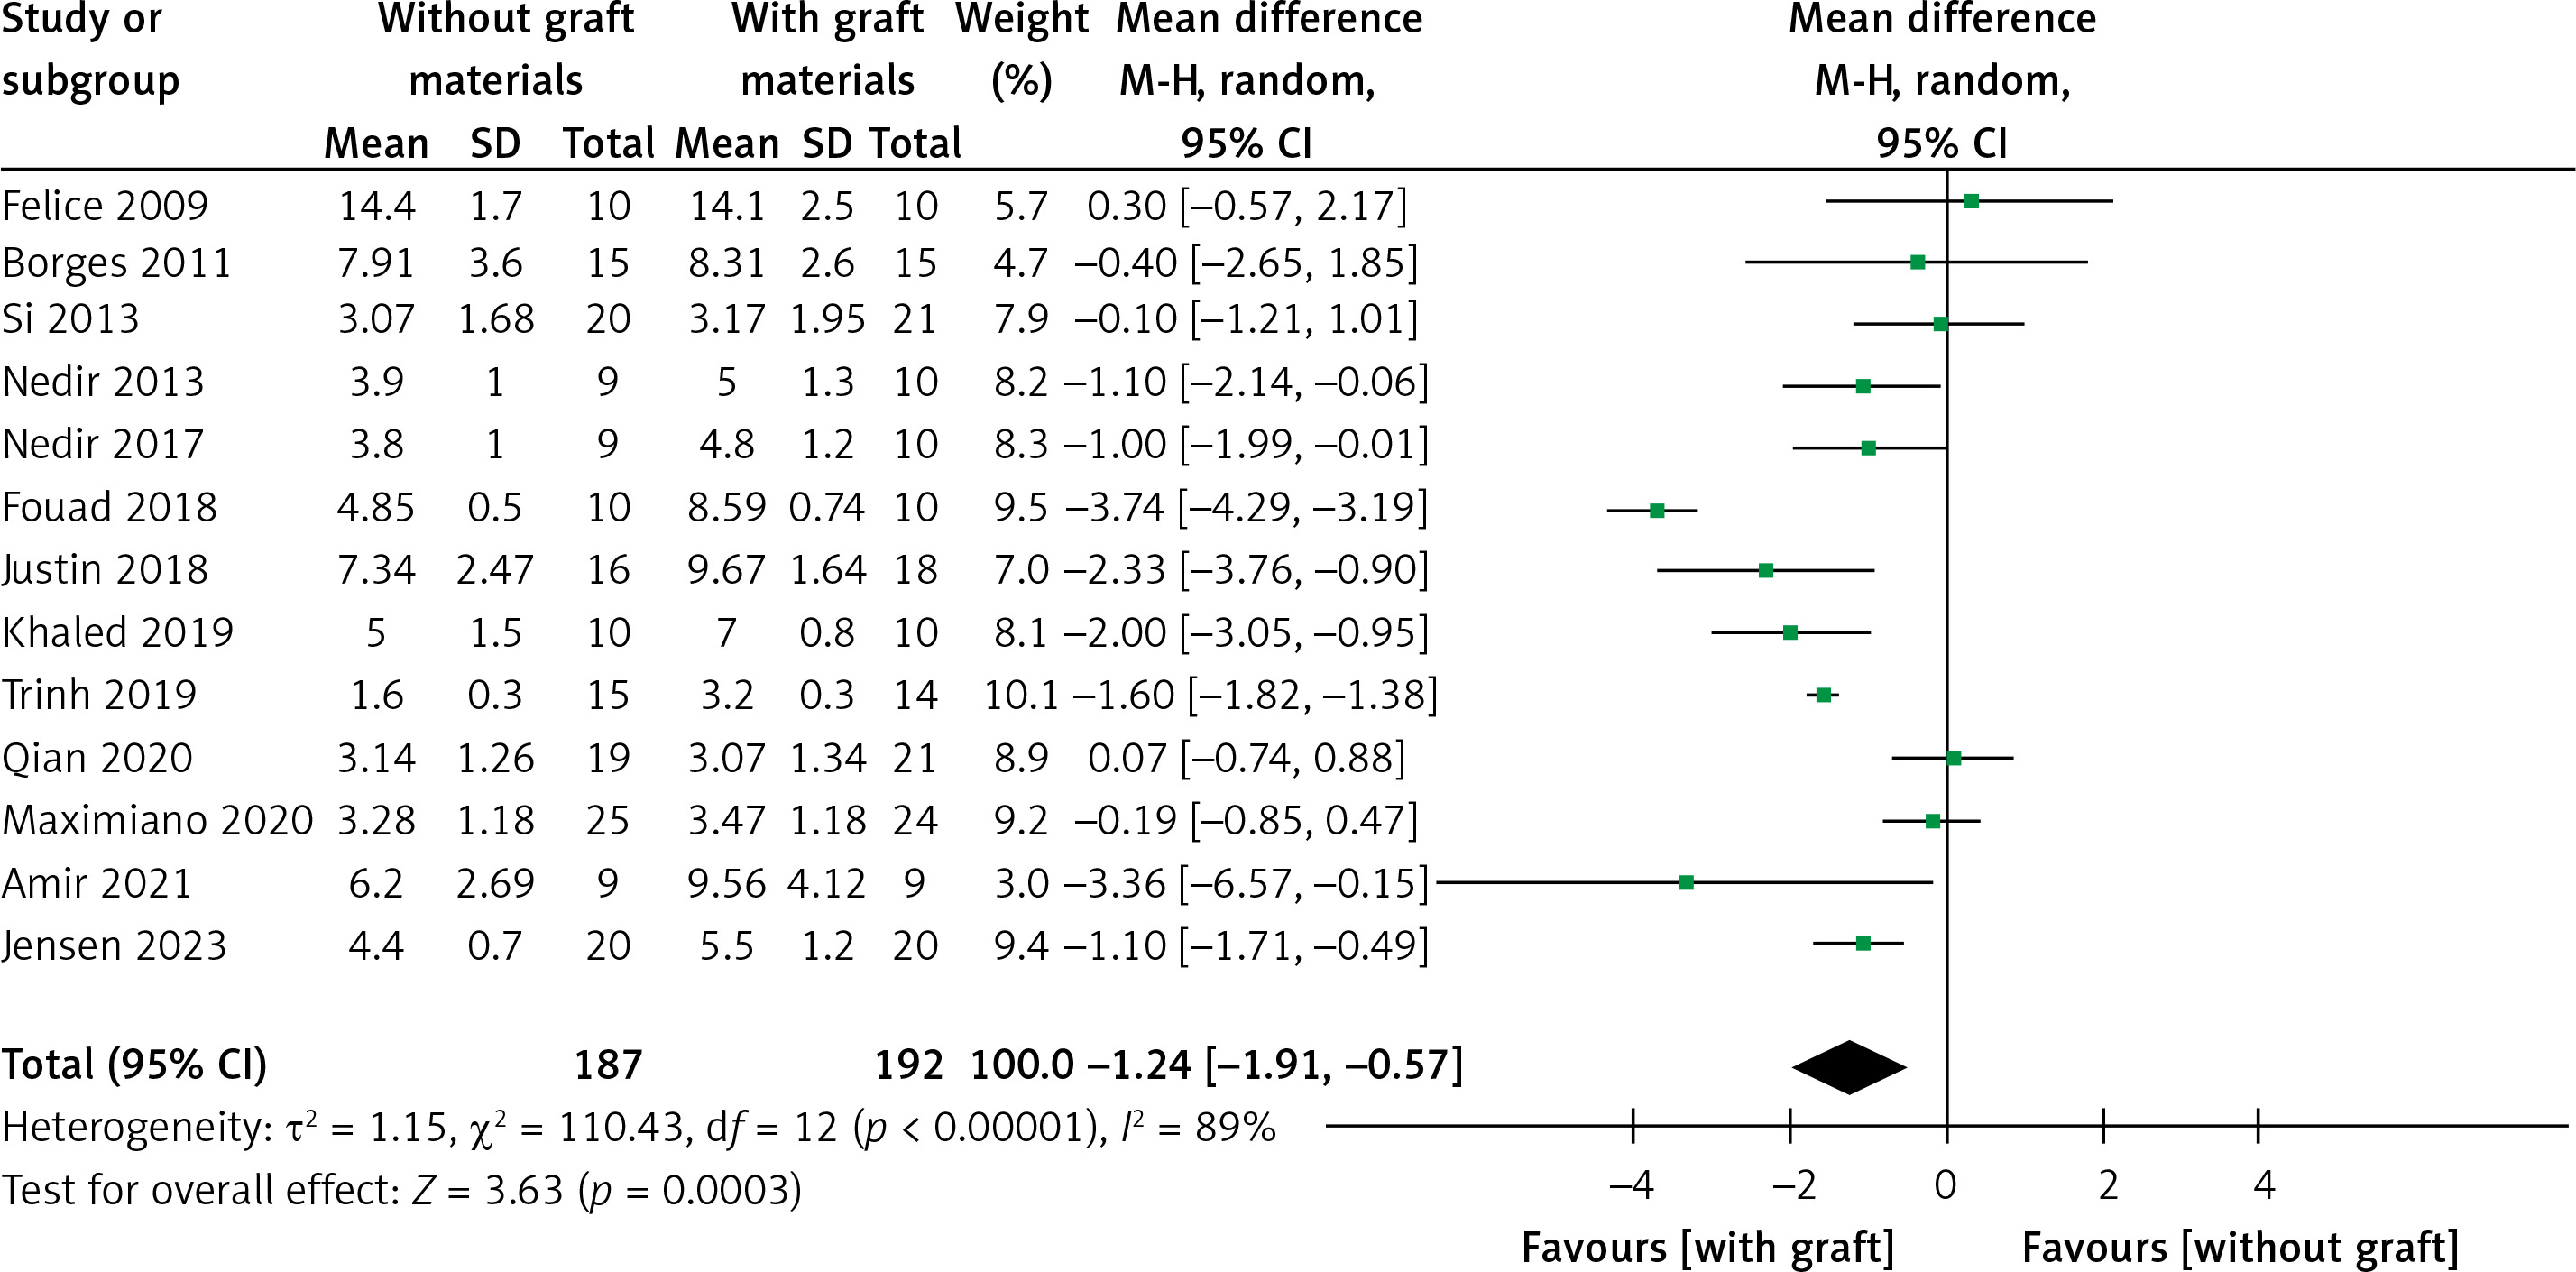
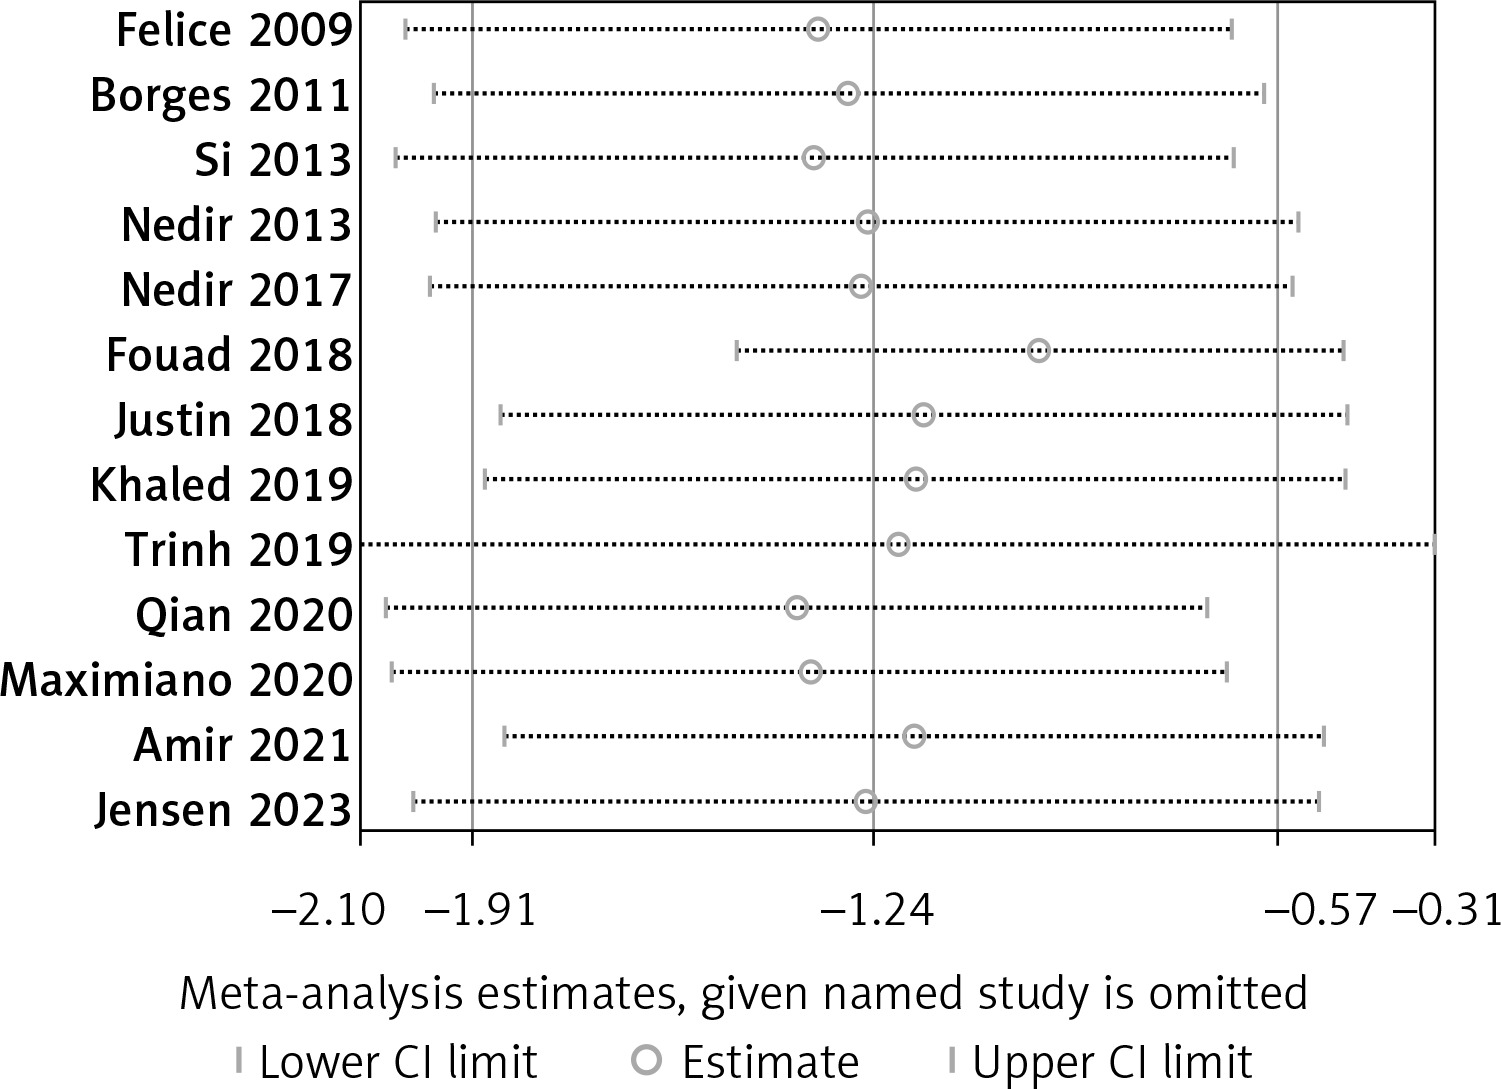
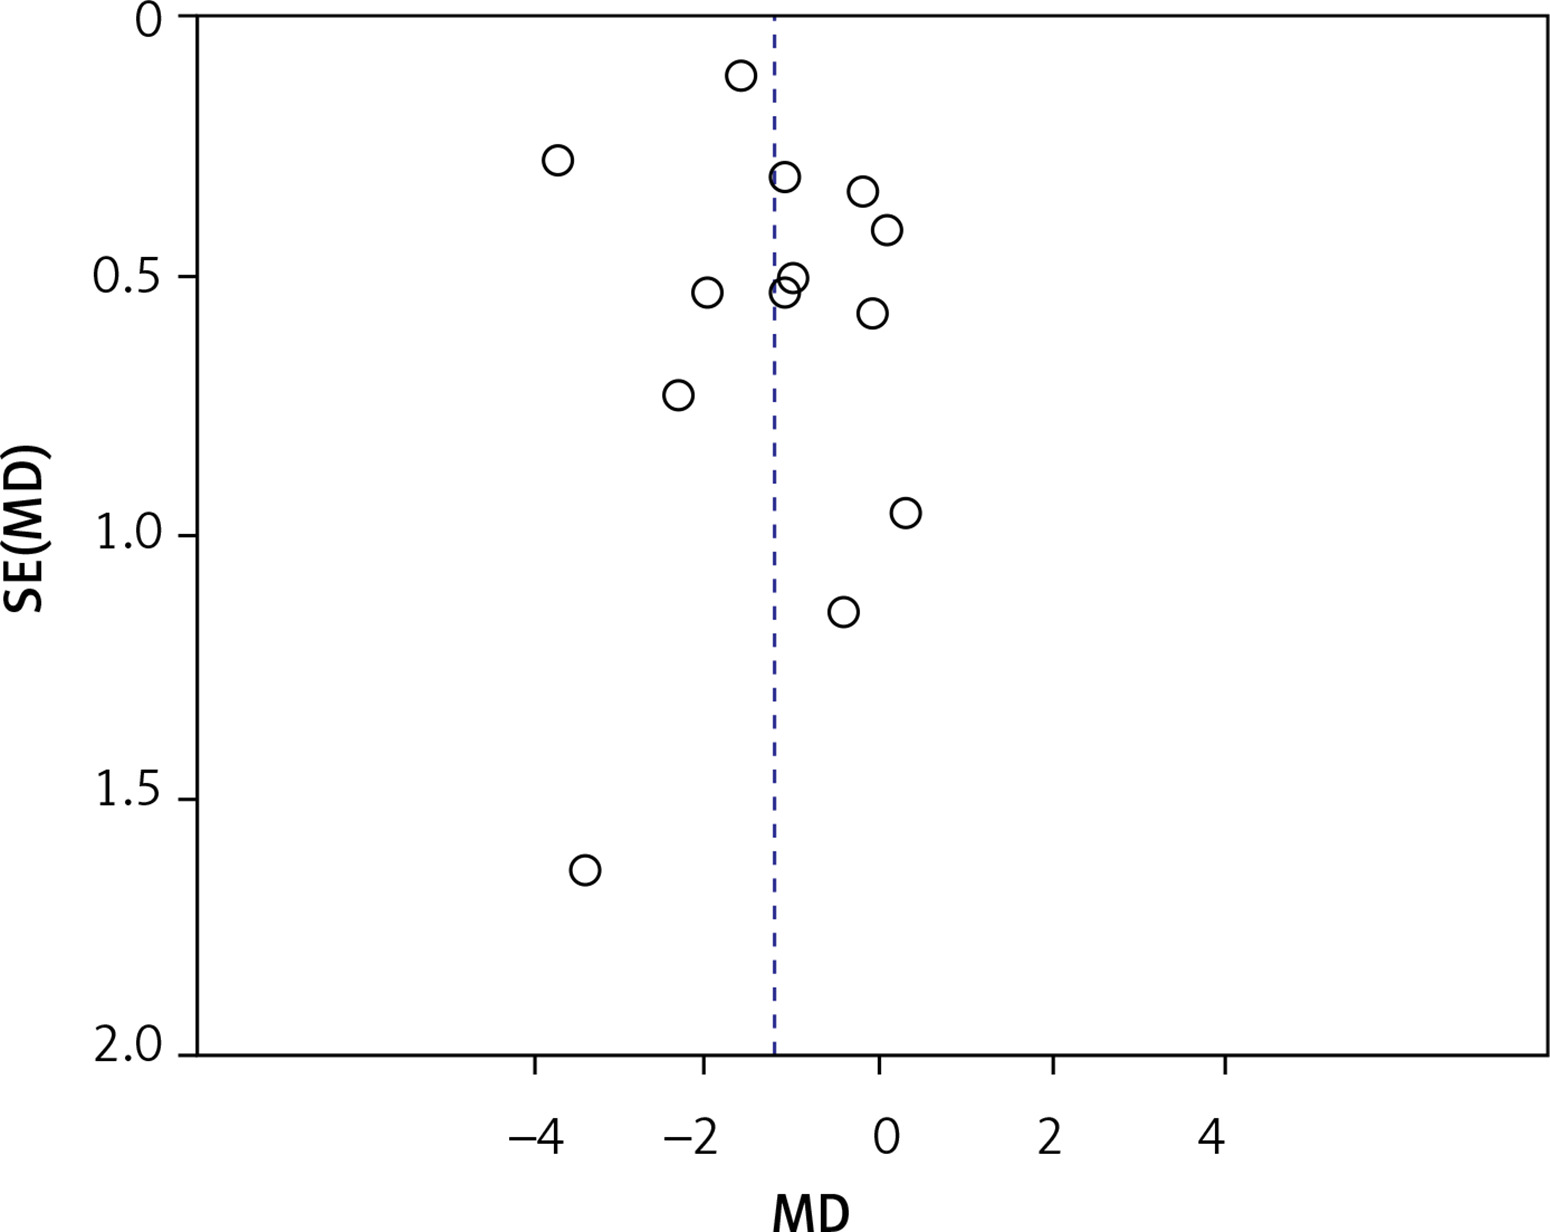
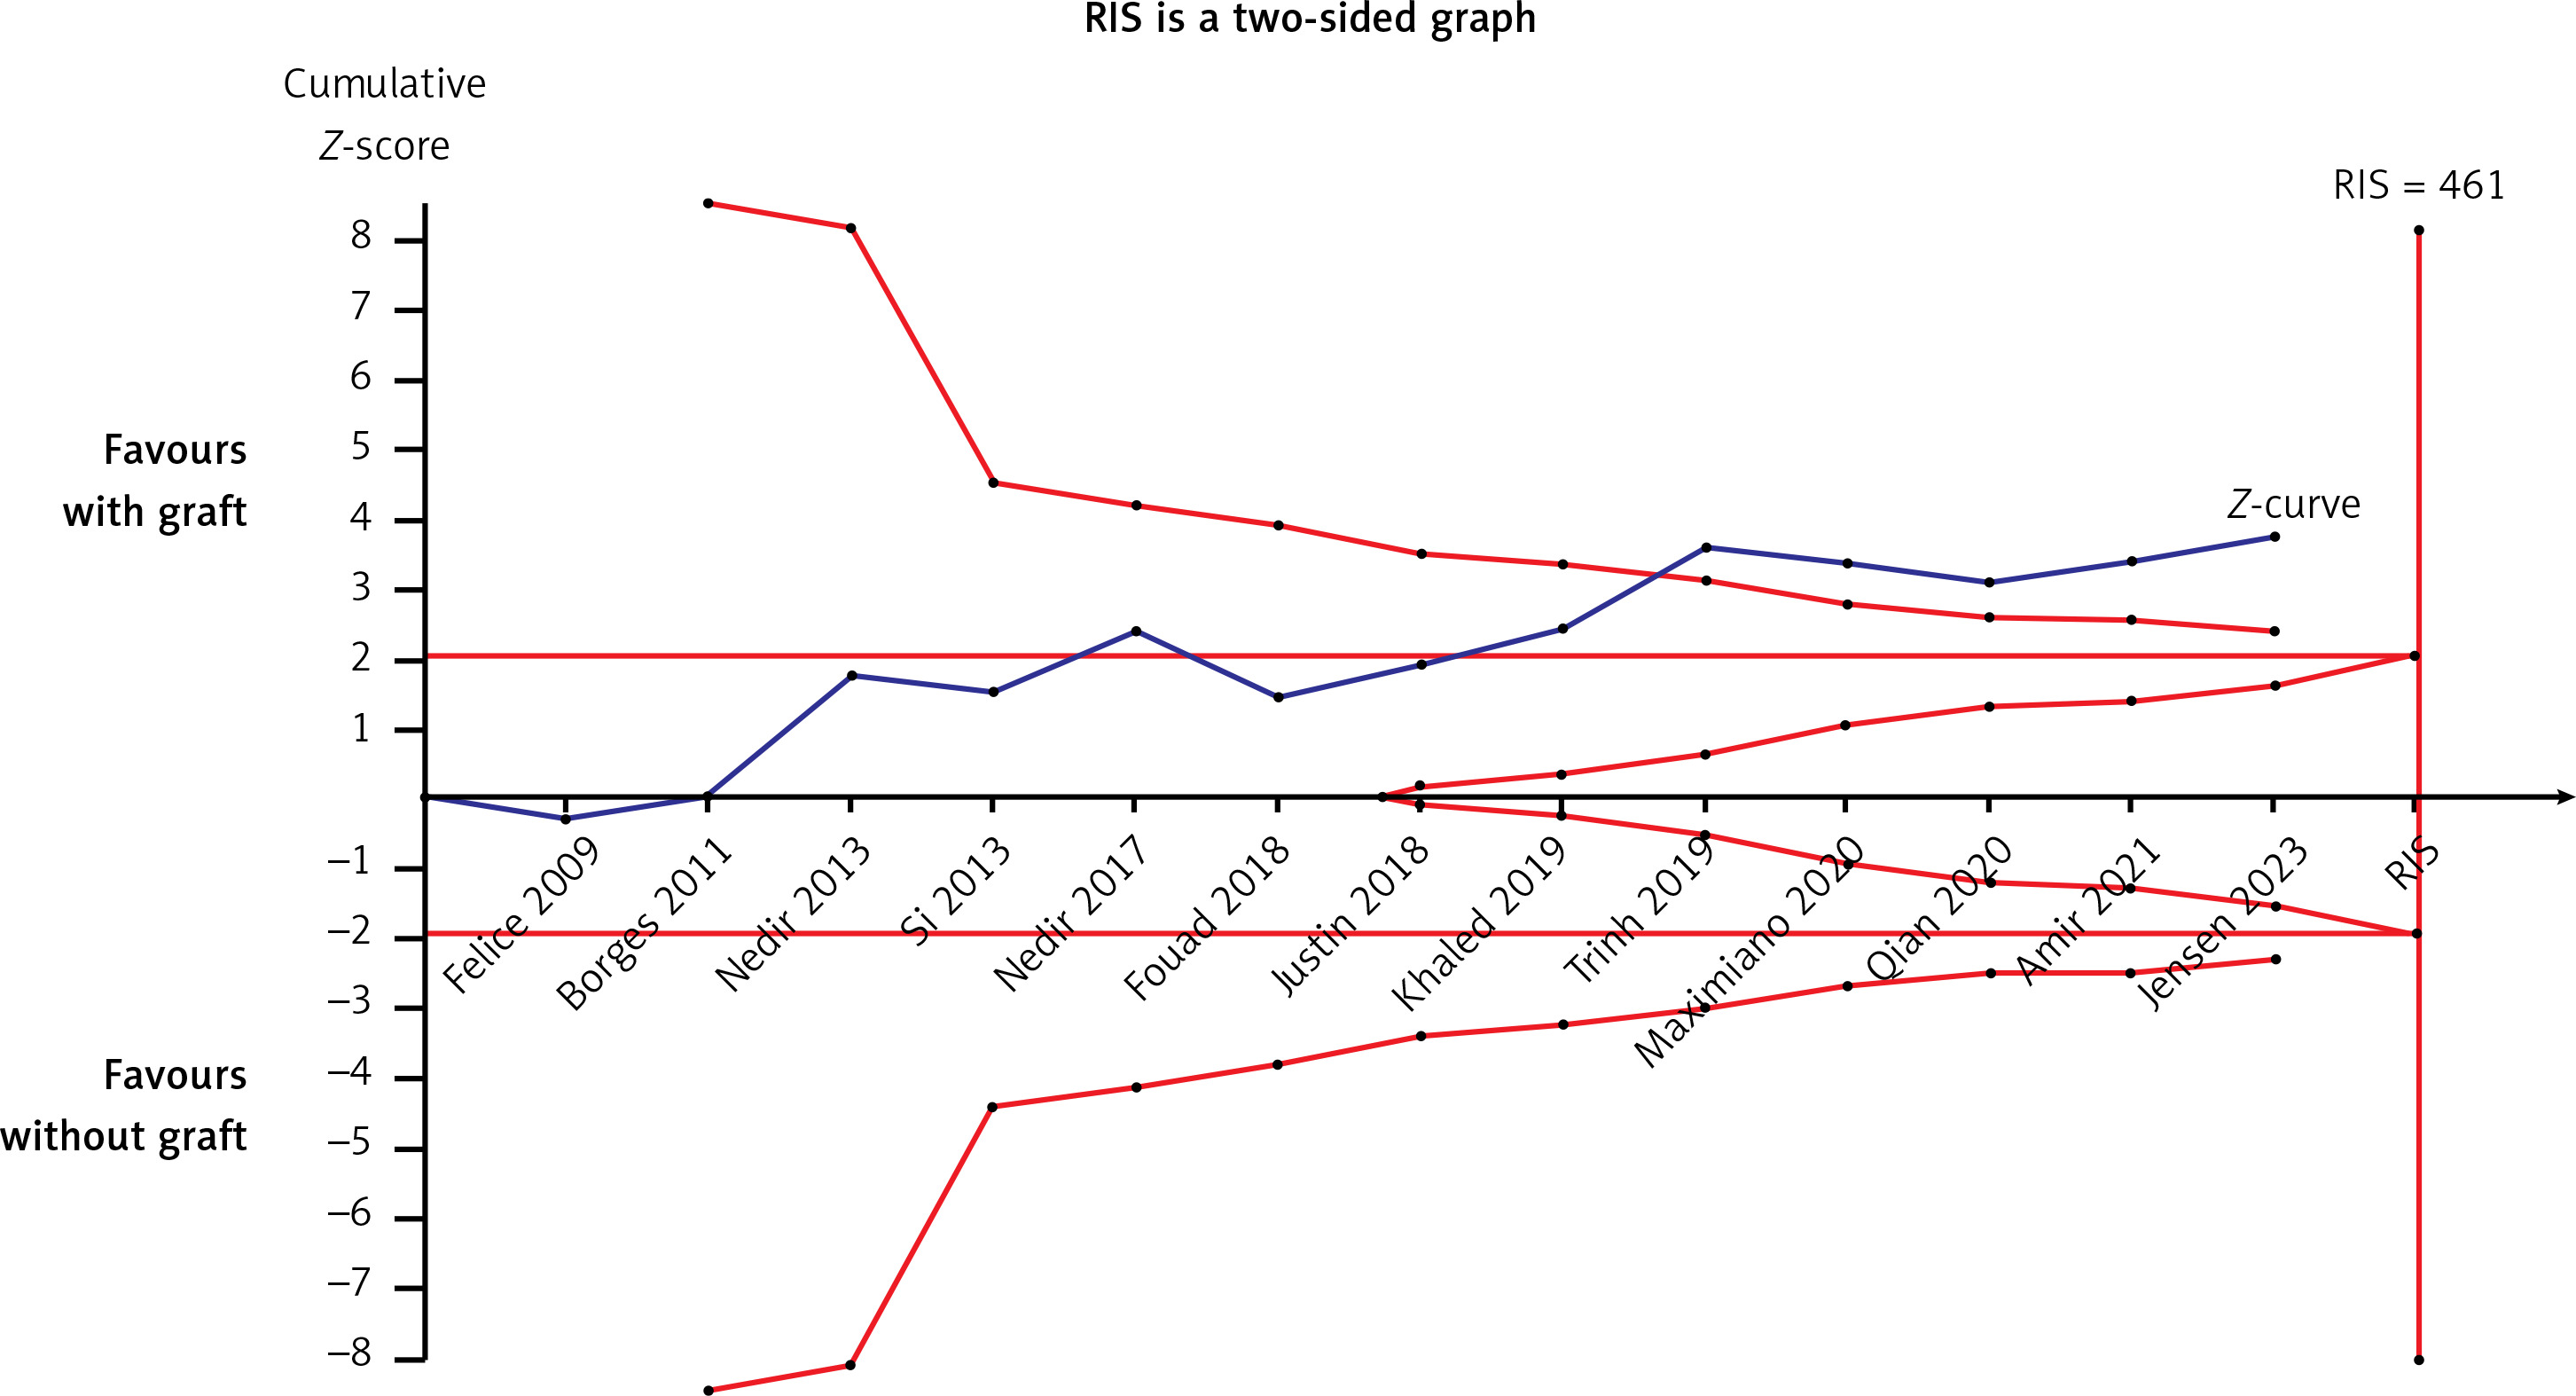
ESBG was measured after at least 6 months in thirteen studies [21–24, 26–32, 34, 35]. A meta-analysis was performed using a random-effects model owing to the high heterogeneity (I2 = 89%). ESBG was significantly higher in the grafted group, with a WMD of –1.24 (95% CI: –1.91 – –0.57, p = 0.0003) (Figure 12). Meta-regression, used to try to explore high between-trial variation, demonstrated that the following covariates had an effect: approaches for vertical bone augmentation (SE = 0.612, p = 0.044, covariates: external and internal approach), follow-up period (SE = 0.562, p = 0.025, covariates: 6 months and more than 6 months), risk of bias (SE = 0.696, p = 0.288, covariates: a low risk of bias and a moderate risk of bias), year of publication (SE = 0.094, p = 0.309, covariates: year), and bone substitute (SE = 0.774, p = 0.085, covariates: with AB and without AB). Approaches and follow-up periods may account for between-study heterogeneity. The sensitivity analysis showed that the conclusions had strong stability (Figure 13). The symmetry in Figure 14 and Egger’s test (p = 0.485) demonstrated no potential publication bias. As shown in Figure 15, the Z curve crossed the conventional and TSA monitoring boundaries although it failed to achieve the expected sample size. The conclusions drawn from the current study are less likely to be false positives.
Implant stability quotient
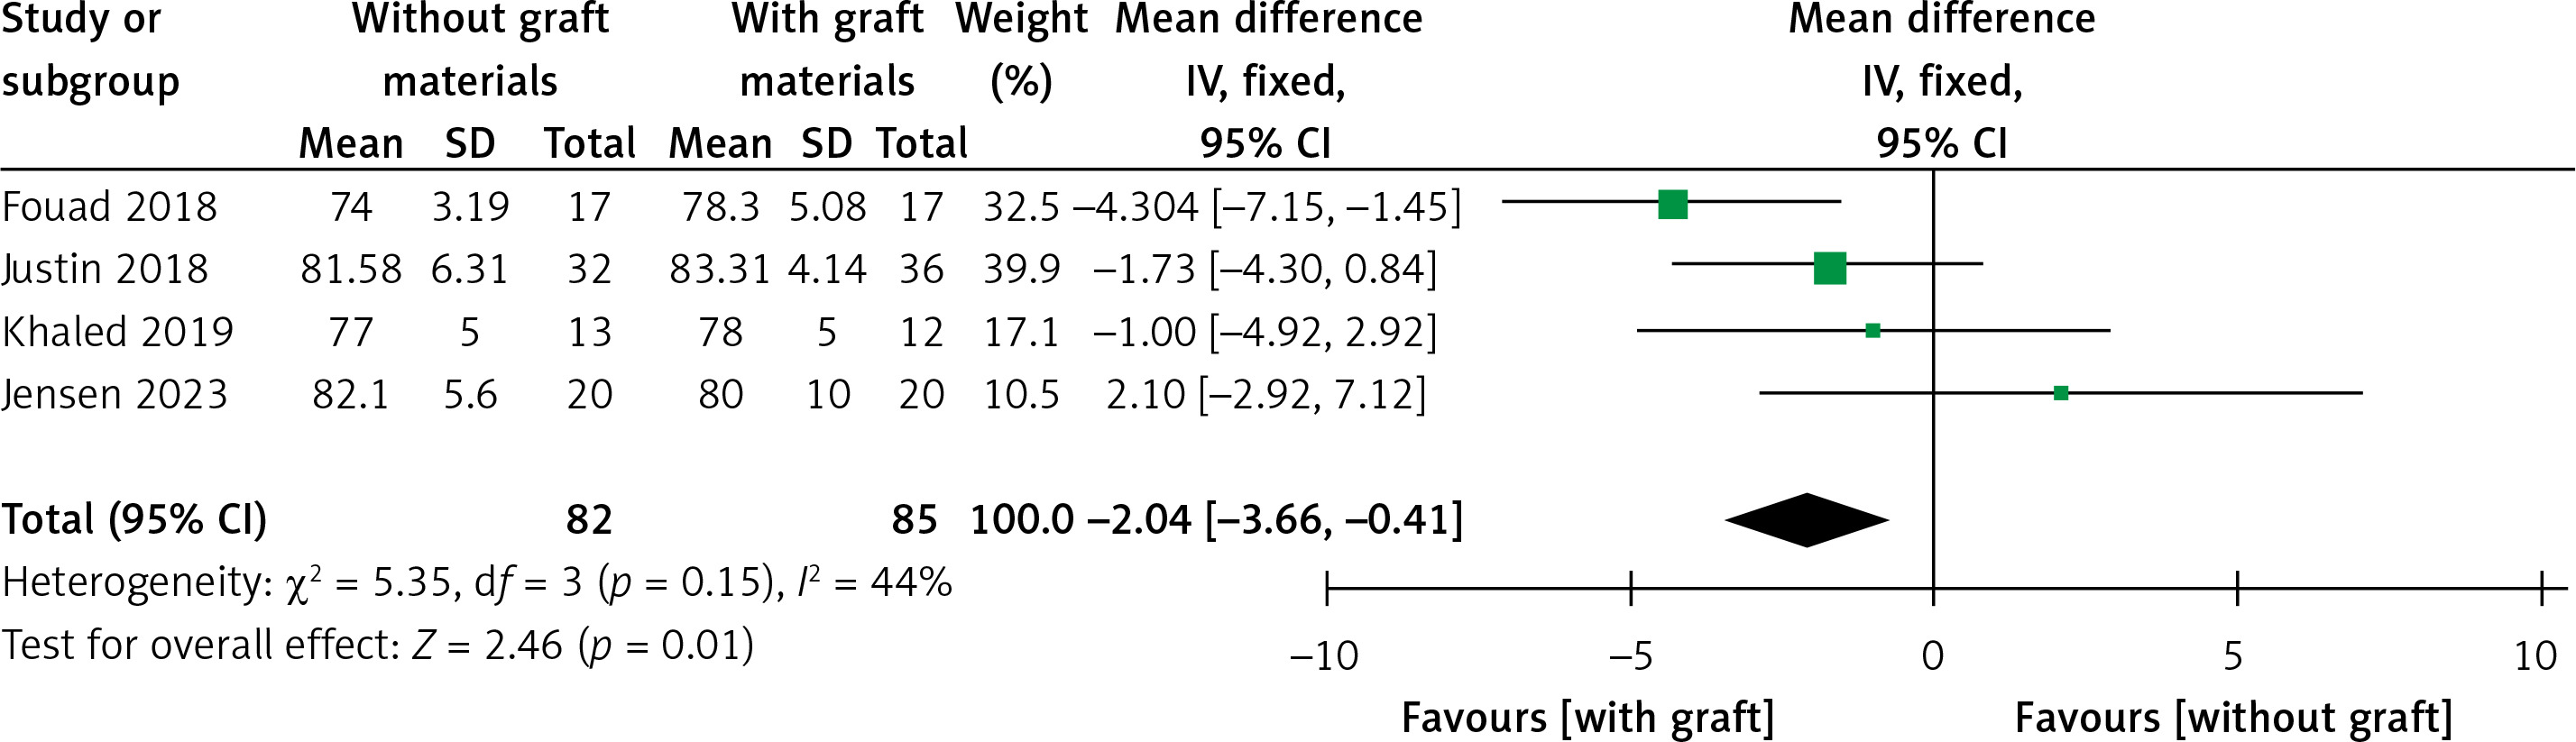
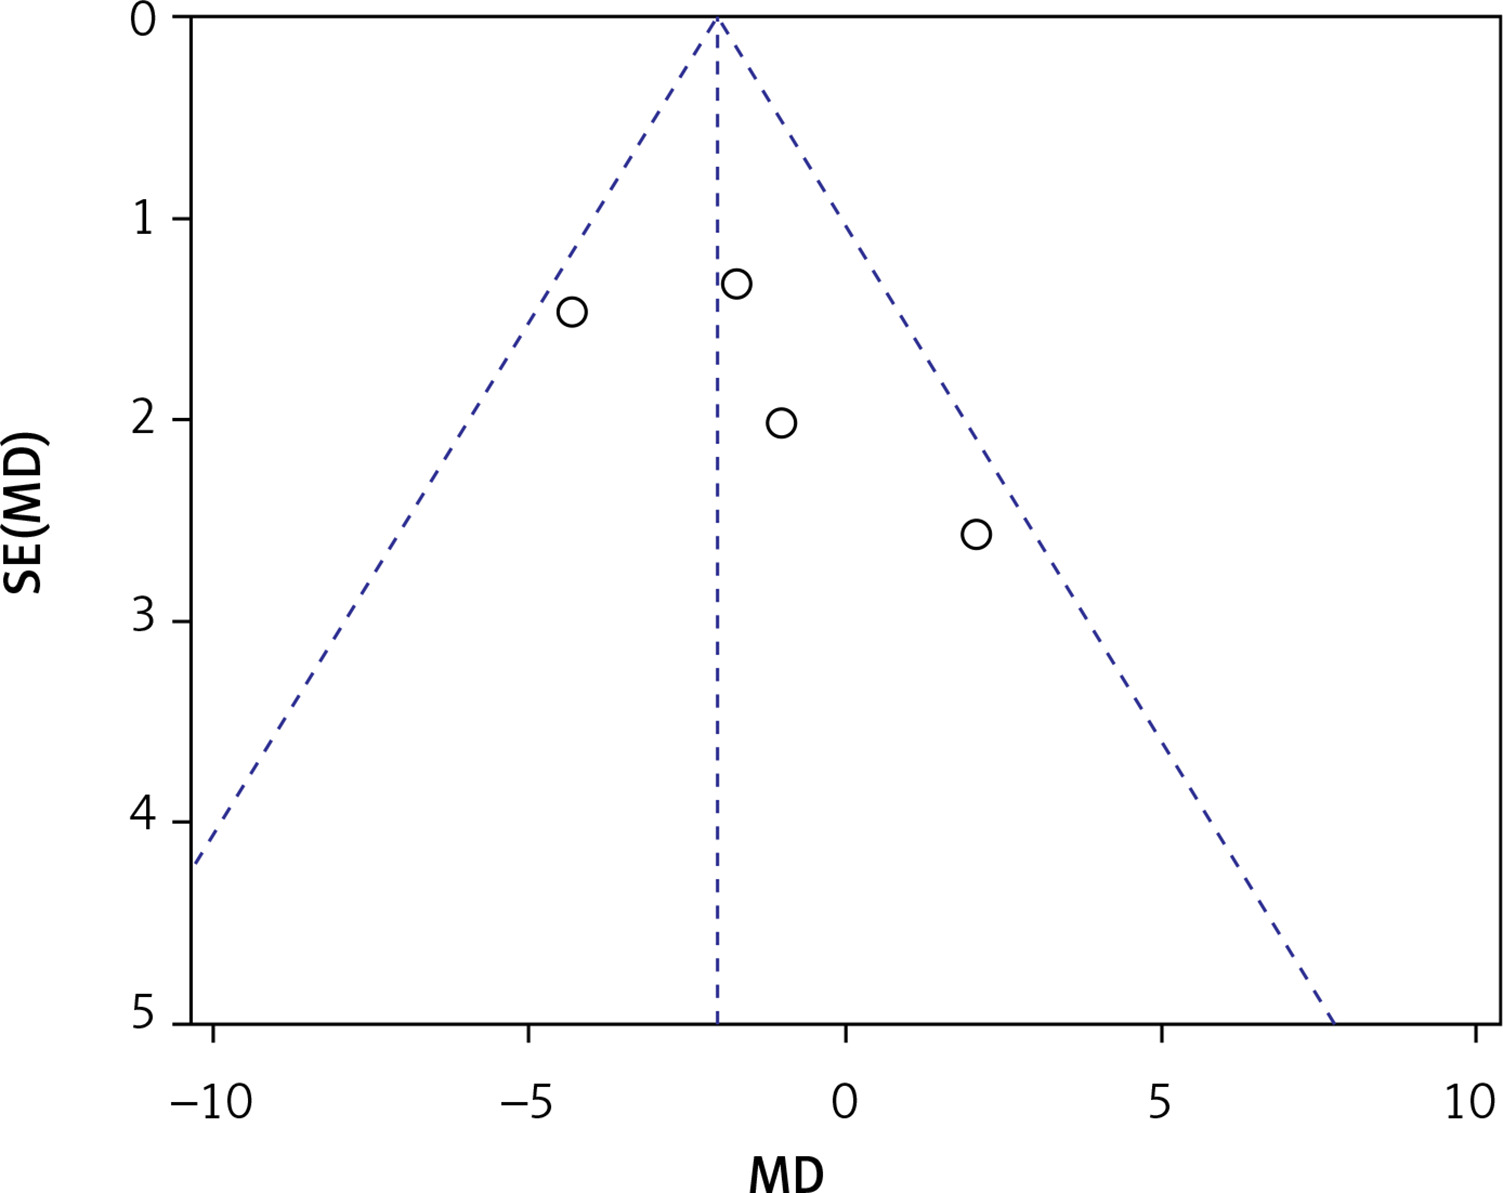
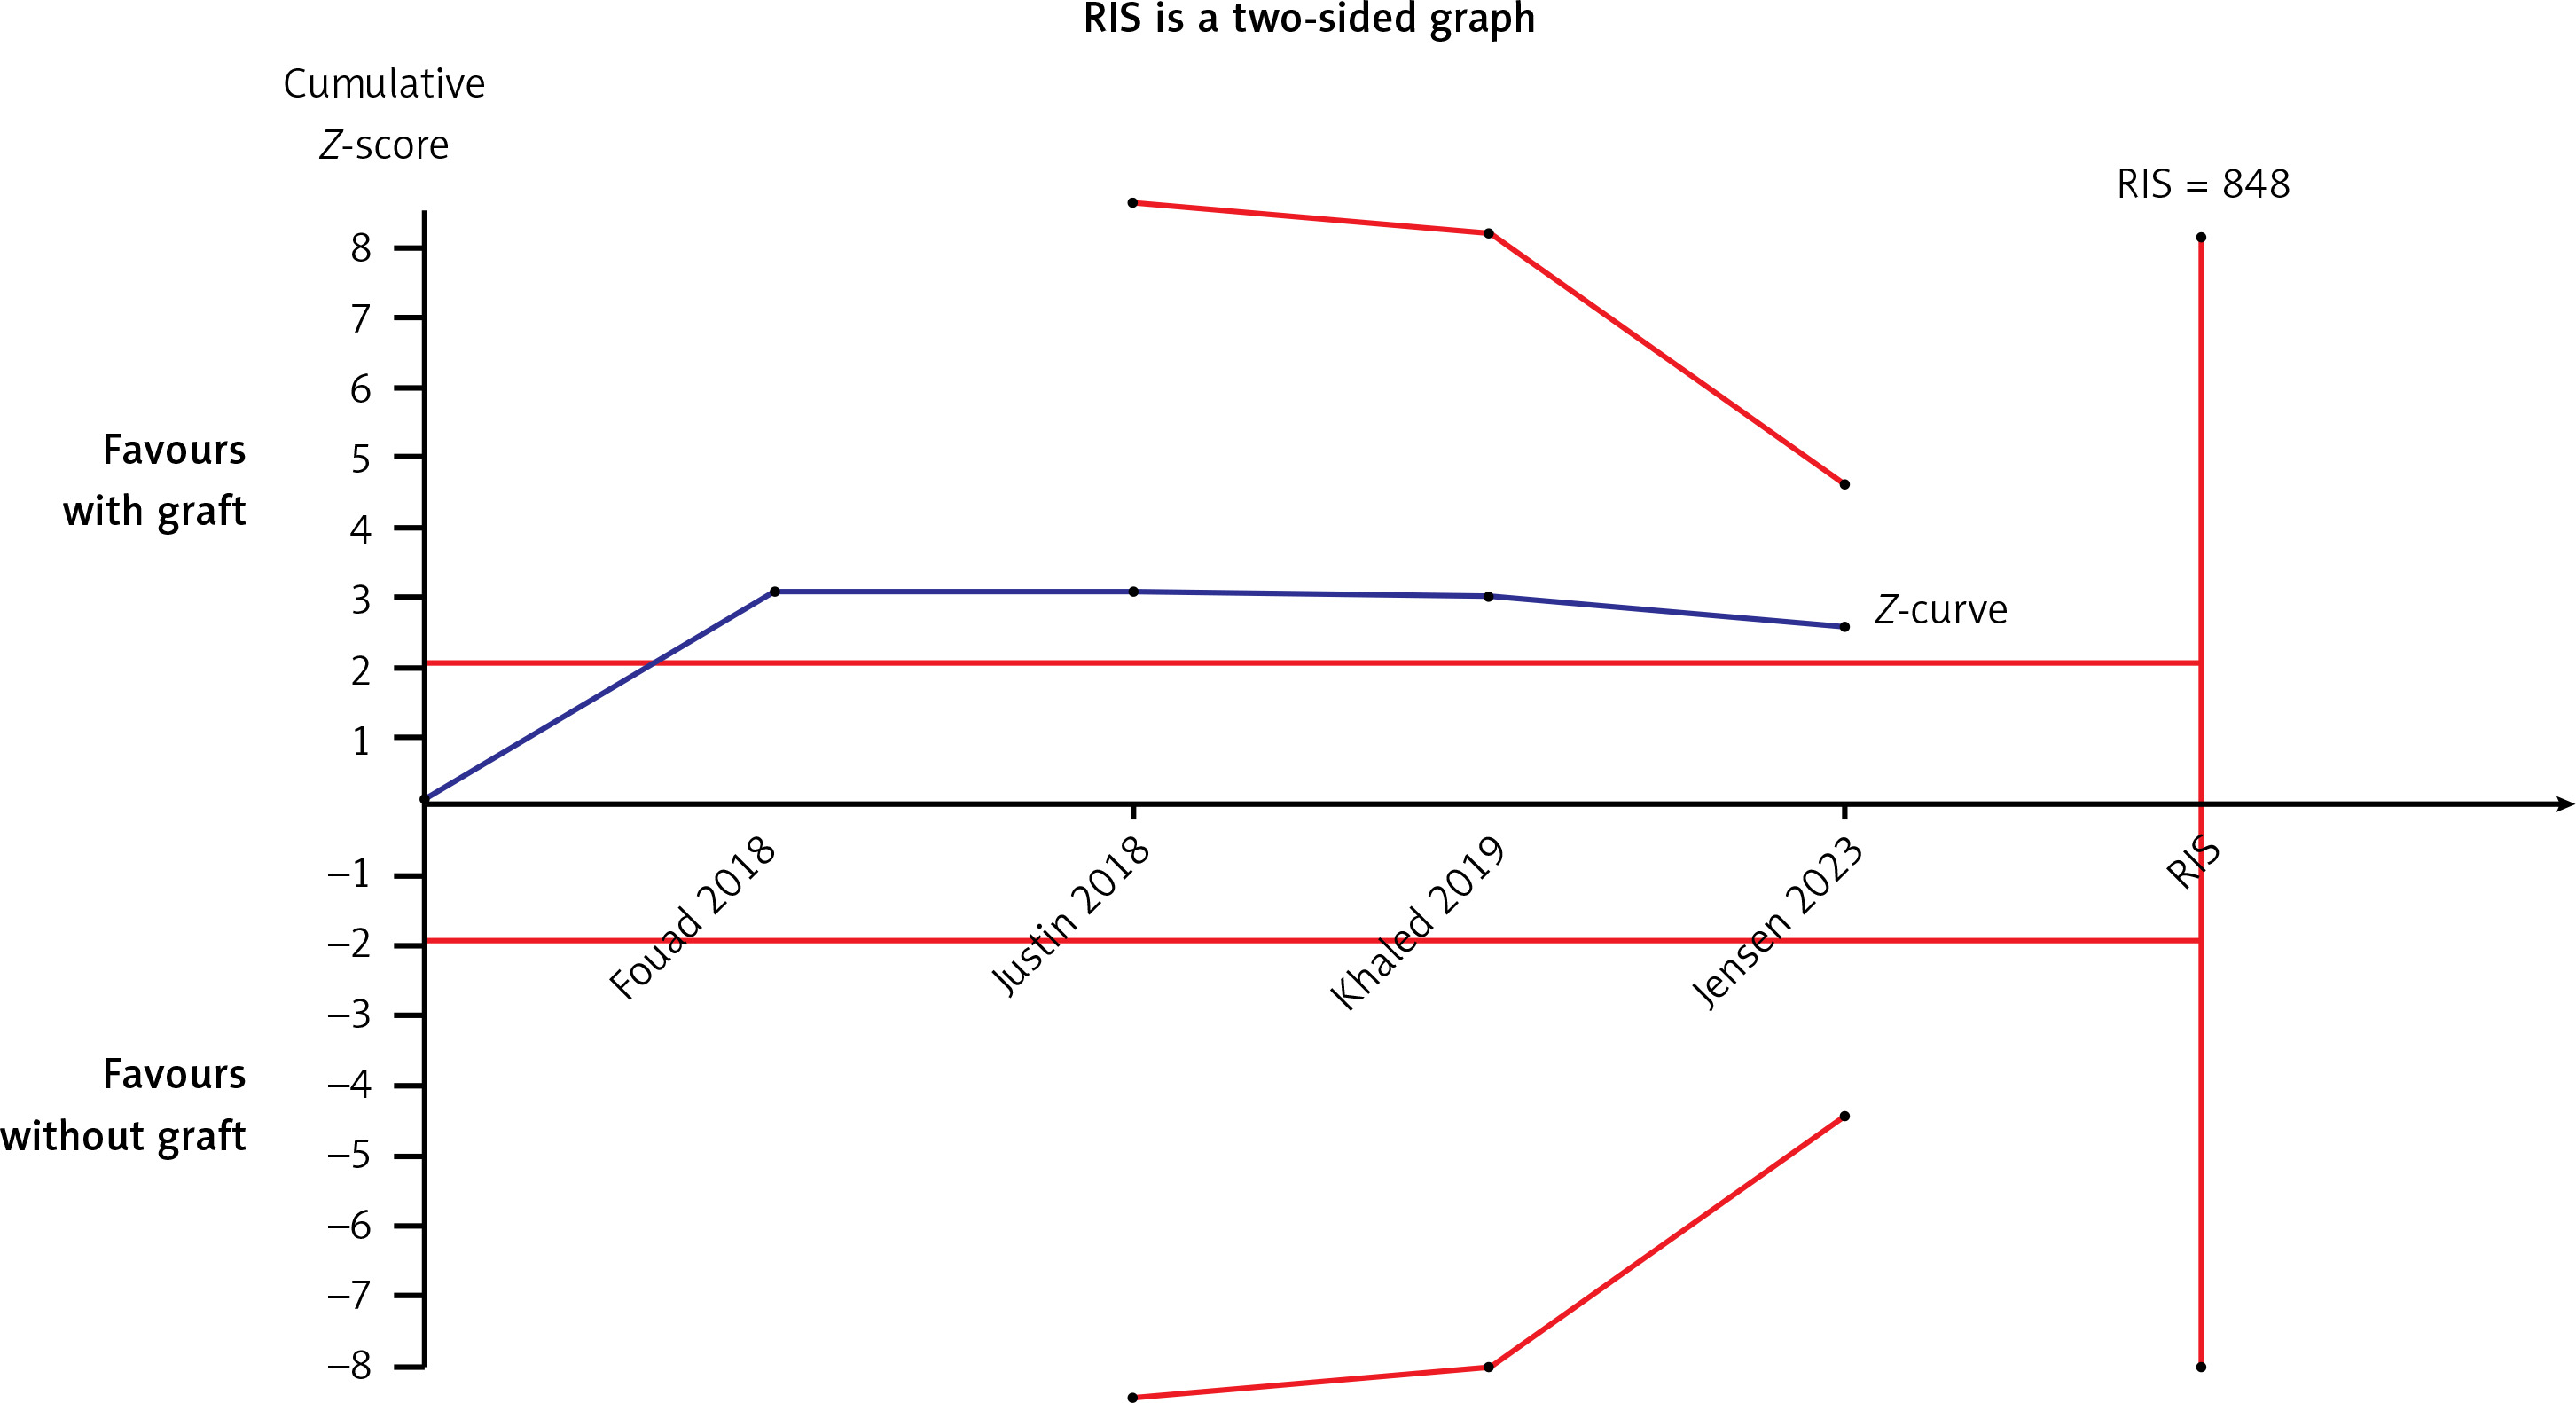
Four articles compared the ISQ [24, 26–28]. A fixed-effects model was applied in this meta-analysis due to its low heterogeneity (I2 = 44%). A significant difference was found in ISQ between test and control groups (WMD = –2.04, 95% CI: –3.66 – –0.41, p = 0.01) (Figure 16). There was no significant difference when Fouad’s study [24] was excluded from this meta-analysis (WMD = –0.95, 95% CI: –2.93–1.03, p = 0.35). The Egger’s test (p = 0.281) and funnel plot indicated no publication bias (Figure 17). The TSA analysis showed that the Z-curve crossed the conventional boundary but failed to cross the TSA monitoring boundary and reached an RIS of 848. The results pooled from the four articles might be due to the presence of false positives, which is consistent with the conclusion from the sensitivity analysis (Figure 18).
BD
The data regarding the association between the test and control groups were pooled from five studies [20–22, 24, 28]. The SMD was used in this meta-analysis because of its ability to measure BD in different units. Because of substantial heterogeneity (I2 = 88%), a random-effects model was applied for data synthesis. A statistically significant difference was found, with an SMD of –1.90 (95% CI: –3.29 – –0.51). A meta-regression analysis was not performed because insufficient studies were included in the meta-analyses. The meta-analysis was abandoned, and a descriptive analysis was used to explore the association between the two groups. Four articles [20, 21, 24, 28] reported a significant difference between the two groups, with higher BD values in the control group, and only one study [22] indicated that no difference was detected in terms of BD measured 6 months after surgery. AB was used as a bone graft in the control group, compared to the tent group in the Borges study [22]. All articles failed to avoid confounding factors and postmenopausal women with low BD were excluded from the RCTs. The aforementioned parameters may account for partial heterogeneity.
MBL
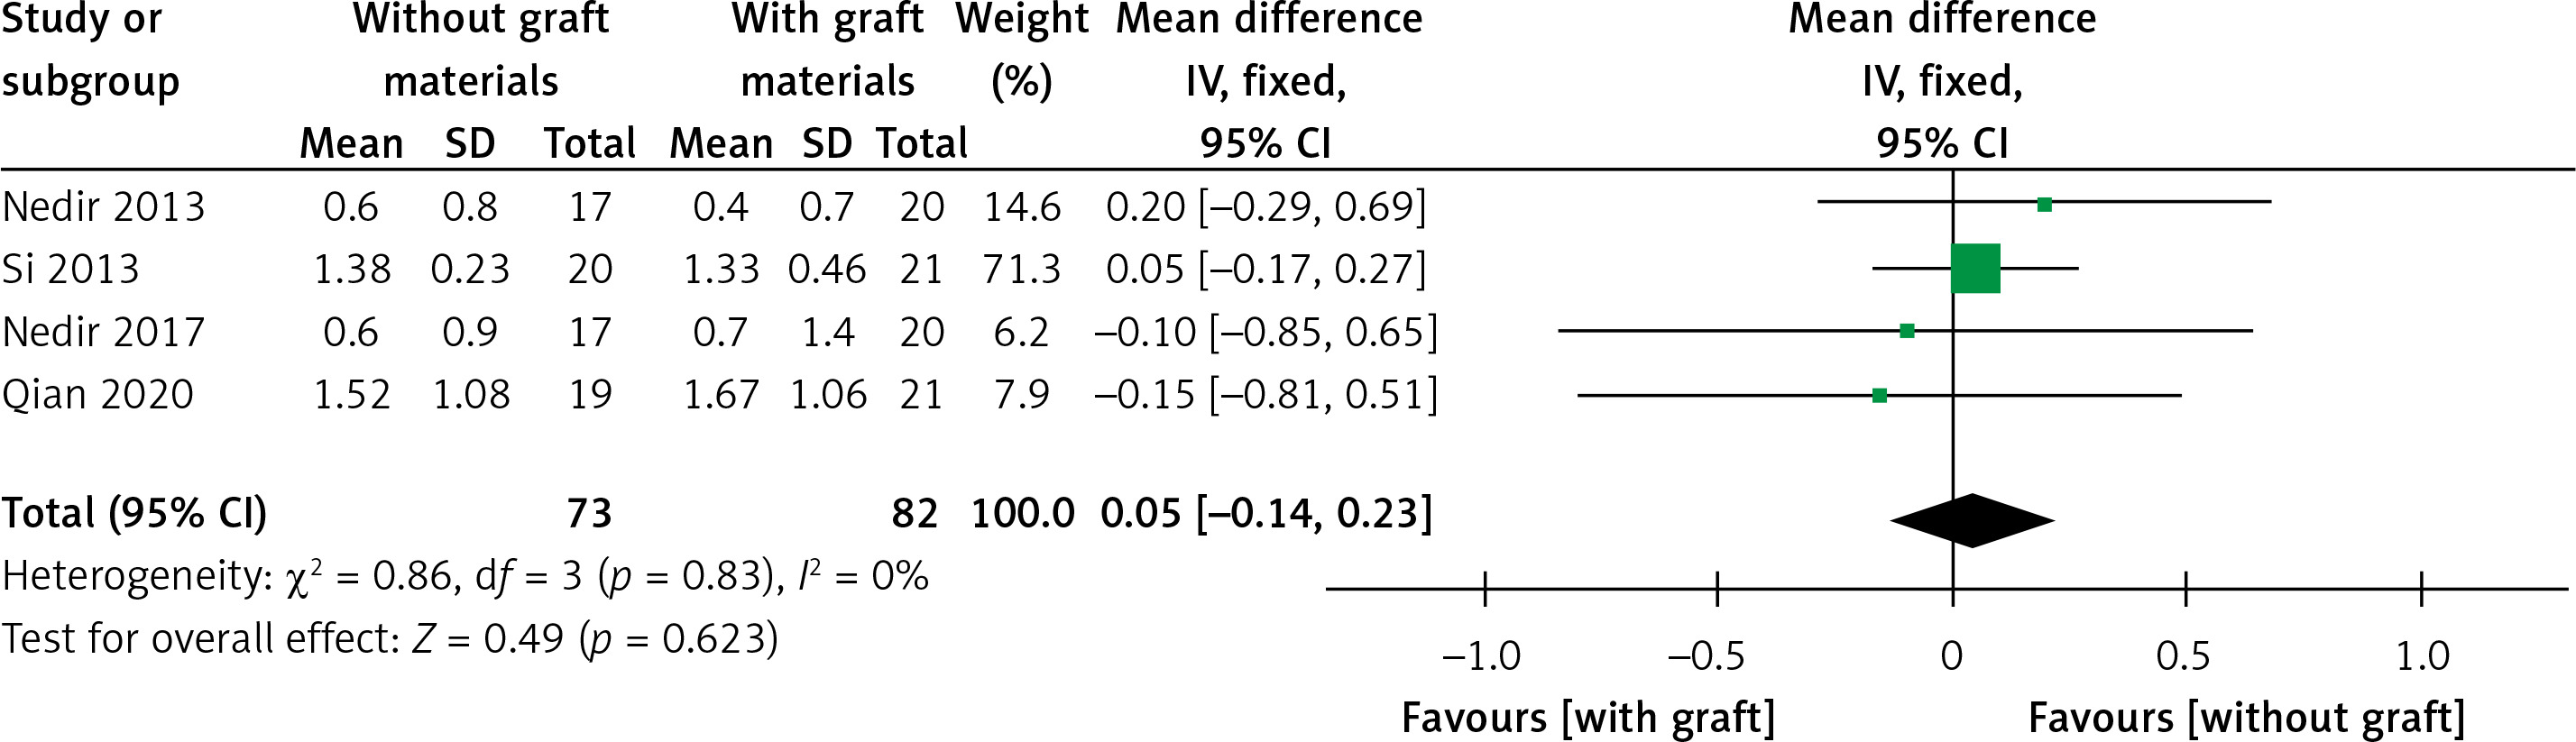
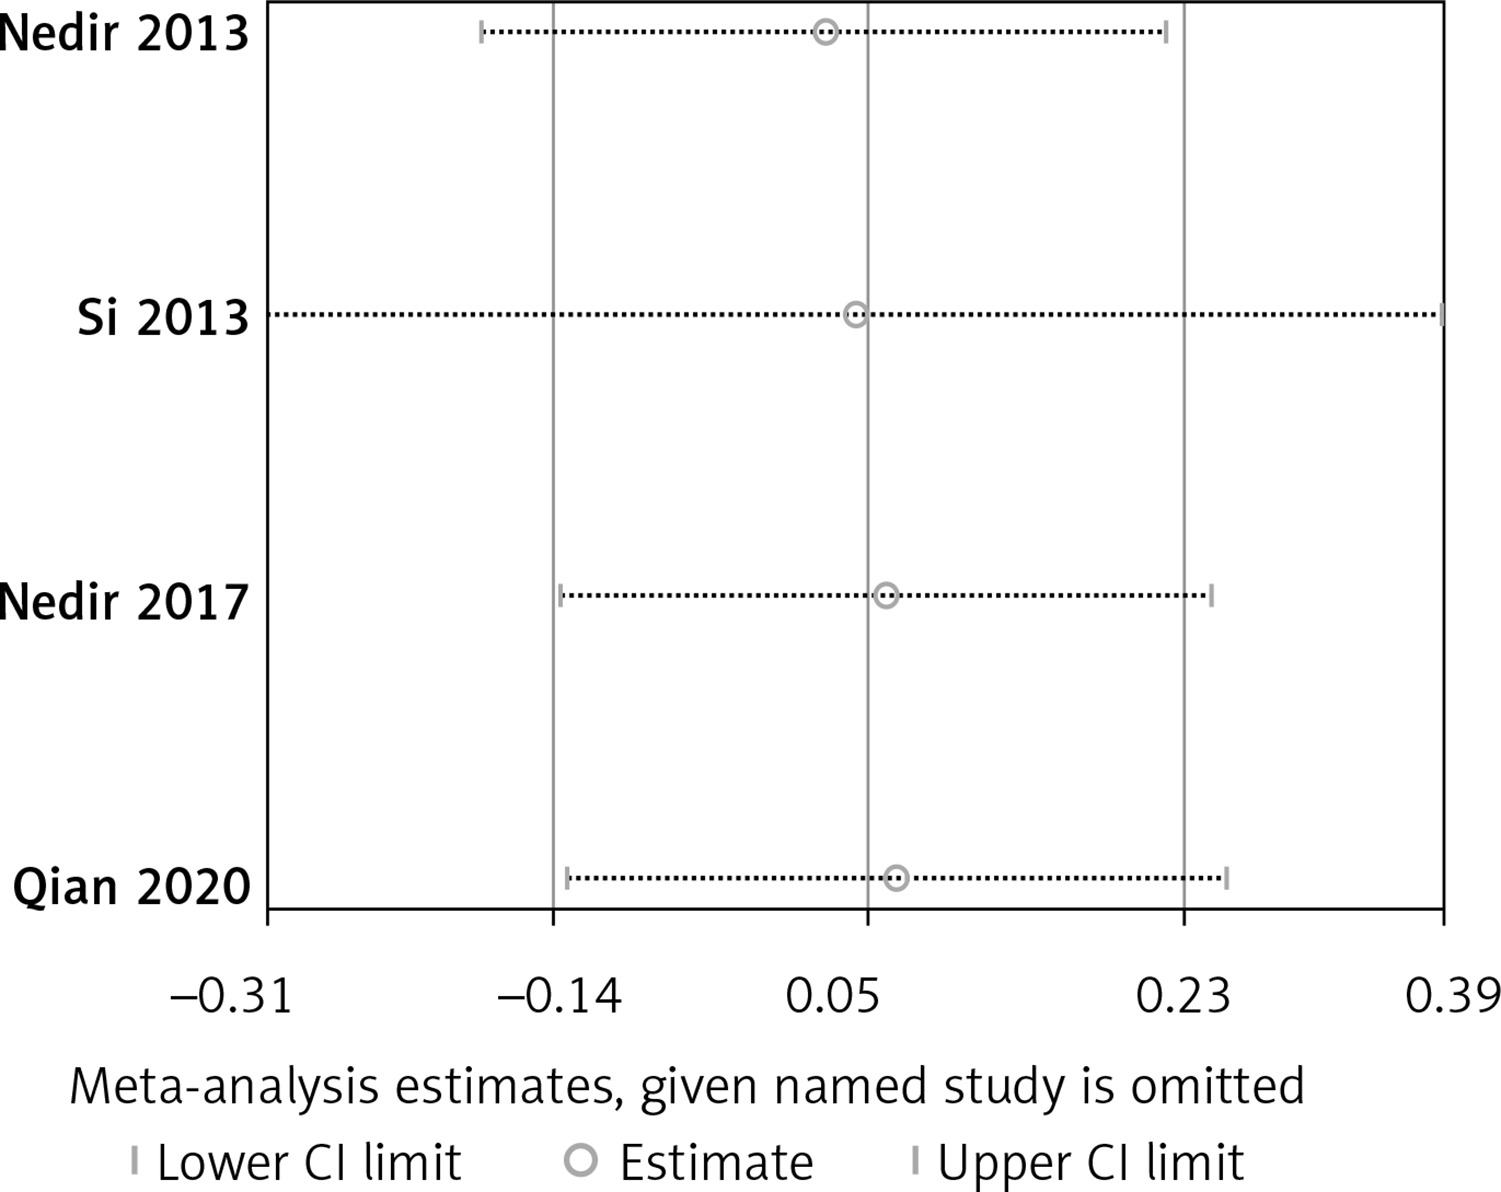
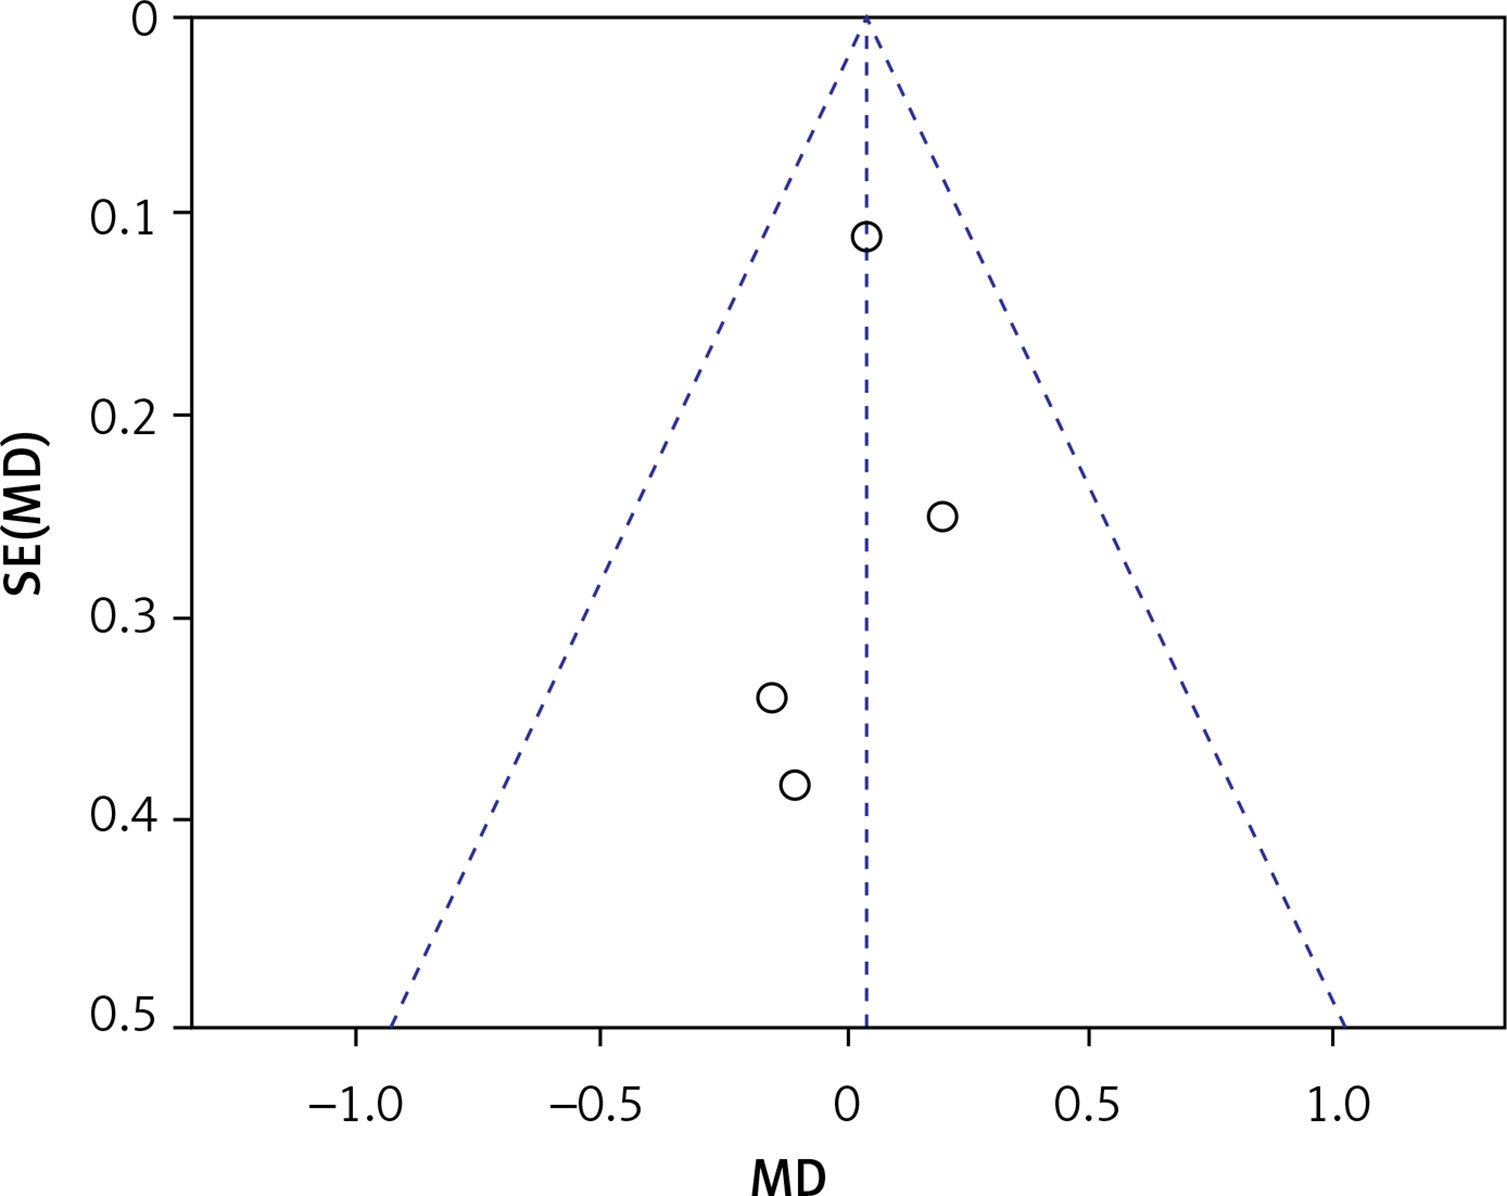
Four trials with 155 implants reported the MBL results, including three articles with a low risk of bias [30–32, 34]. A fixed effect model was used in this meta-analysis (I2 = 0%) and no statistically significant difference could be detected from pooled data (WMD = 0.05, 95% CI: –0.14–0.23, p = 0.62) (Figure 19). All results from the sensitivity analyses were consistent with those of the primary analysis (Figure 20). The publication bias was assessed using a funnel plot compiled from the pooled WMD of the included articles (Figure 21). All studies landed in the triangular area of the funnel plot, which was consistent with Egger’s test (p = 0.638). However, differences were difficult to detect using Egger’s test because of the inadequate number of included trials. The RIS line could not be computed because of insufficient information.
Surgical time
There were three studies that described the surgical time in the test and control groups [23, 33, 36]. A meta-analysis with a random-effects model (I2 = 97) suggested no difference between the two sides (p = 0.80). According to the sensitivity analysis, a statistically significant difference was detected when the study by Scarano et al. [33] was excluded from the primary analyses (p = 0.02). Due to substantial heterogeneity and insufficient trials, the methods for pooling data were abandoned, and the results of three articles are described individually. Scarano et al. found that there was a significant difference in ST required to complete the MSFE procedure: 18.3 (2.1) min for the test group versus 12.5 (3.1) min for the control group. In contrast to Scarano et al., Zhang et al. concluded that the mean ST in the test group was 13.97 (2.42) min, which was significantly shorter than that in the control group [36]. However, Felice reported that there was no difference in the ST required to complete the MSFE procedure. In Felice’s study, a rigid barrier was inserted into the sinus, maintaining the sinus lining in the desired position [23].
VAS
A RCT was designed by Jensen in order to explore patient perceptions of recovery after MSFE with or without bone grafts [25]. In the control group, the autogenous bone grafts were harvested from the buccal antrostomy and mixed with the xenograft granules. In the test group, autogenous blood was injected underneath the raised sinus membrane around implants protruding into the maxillary sinus. The research work revealed that there were fewer days of pain and sick leave in the test group. Therefore, harvesting autogenous bone from other areas appears to affect the perception of recovery. In terms of the VAS assessing eating and speaking abilities, physical appearance, work performance, and sleep impairment, no statistical differences were detected between the two groups.
Treatment costs
Only one article has investigated the cost-effectiveness of the MSFE from the perspective of health economics [36]. It was be proved experimentally that total treatment costs in the test group were 9.99 (0.19) ten-thousand yuan while the control group spent more for MSFE than the test group, at 14.32 (2.21) ten-thousand yuan. It seemed that there were lower costs for bone grafts and collagen membranes in the test group.
Certainty of evidence
The certainty of evidence for clinical outcomes was assessed at moderate or low grade using GRADEpro GDT. Details on the strength of the available evidence are presented in Table IV. The certainty of the evidence was downgraded for the following parameters: risk of bias, inconsistency, and imprecision.
Table IV
Summary of findings and strength of evidence outcomes
Discussion
Regarding the biological principles of MSFE without bone grafts, some scholars have speculated that the Schneiderian membrane has osteogenic potential and contains mesenchymal stem cells. Srouji et al. analysed the ability of Schneiderian membrane cells to undergo osteogenic differentiation using in vitro assays. These results suggest that alkaline phosphatase, bone morphogenic protein-2, osteopontin, osteonectin, and osteocalcin are expressed in Schneiderian membrane cells [37]. However, an increasing number of researchers suggest that the space created through MSFE, which provides a blood clot a stable void, may form new bone underneath the raised membrane, which is similar to the healing process of sockets [38]. Bone marrow stem cells (MSCs) in blood clots contain osteoblast progenitors, which can lead to bone formation on scaffolds in the presence of growth factors [39]. In this meta-analysis, endo-sinus bone formation was detected in two groups, although ESBG in the control group was 1.24 mm higher than that in MSFE without any bone grafts. The results of this review were consistent with Lie’s opinion [12]. An animal study showed that airflow in the maxillary sinus and tension of the Schneider membrane produced pressure in the bone increment area, accelerating the absorption of the graft material. Bone materials under the Schneider membrane provide a more stable space for bone formation [40]. Considering the inadequate number of studies included in previous meta-analyses, meta-regression analyses were conducted in this review to explore the sources of high heterogeneity. This suggests that the approaches for vertical bone augmentation and follow-up period may have an impact on the interpretation of the results. Most studies were reported based on short-term follow-ups. TSA, sensitivity analyses, and assessments for publication bias indicated that short-term results from the meta-analyses were reliable in the context of ESBG.
The meta-analyses demonstrated that a higher ISQ which was evaluated more than 6 months after the sinus augmentation procedure was found in the control group. However, the TSA demonstrated that the current results from the pooled data might be the presence of false positives. There was no difference between the two groups when Fouad’s study was excluded from the sensitivity analysis. However, a potential publication bias might not have been detected because of the inadequate number of articles included in this review. Schwarz discovered that chemically modified titanium surfaces promote bone regeneration [41]. In Fouad’s study, the surface and type of implants used in the MSFE were not reported, in contrast to the remaining three articles. We speculate that the implant surface may influence the necessity of bone materials for MSFE. A review article reported that herbal materials can induce cell differentiation and accelerate bone regeneration, making them potential candidates for surface nanocoating on dental titanium implants [42]. Hence, more RCTs describing implant surfaces can be conducted using the MSFE with or without bone grafts in the future.
Of the five studies that reported BD, only one showed no statistical difference in BD measured after 6 months between the two groups. The other four studies showed a higher BD in the MSFE with bone graft group. None of the studies mentioned the exclusion criteria for postmenopausal women or patients with osteoporosis before performing the trials. Borges et al. measured BD in a control group filled with AB under a raised sinus membrane. Compared to other bone materials, Tosta et al. reported that autogenous bone harvested intraorally showed a higher absorption rate for maxillary sinus grafting in humans [43]. We speculate that bone material and oestrogen levels may affect BD after MSFE, with or without bone grafts. Titanium implants may have an adverse effect on osseointegration in patients with bone metabolism defects such as osteoporosis [44]. An animal study demonstrated that grape seed extract (GSE) improved implant osseointegration in a bone model of oestrogen deficiency [45]. Multilevel factorial randomised controlled trials should be conducted to explore the use of GSE in implant dentistry.
The meta-analysis of survival rates showed no difference between the two groups (0.03, 95% CI: –0.01–0.07, p = 0.17). Both groups had high survival rates > 95% (non-grafted, 97.93%; grafted, 95.21%). Sensitivity analysis showed that the results from the pooled data with low heterogeneity were robust. On one hand, publication bias was not detected in the funnel plot or Egger’s test (p = 0.062). In contrast, the Z-curve of TSA reached the RIS (307) and crossed the futility areas when Maximiano’s study was added to the meta-analysis, which was sufficient to illustrate that there was no statistical difference in the implant survival rates between MSFE without and with bone grafts. Based on the bone engineering tissue, the bone defect area can exhibit bone formation in the presence of seed cells, scaffold materials, and the microenvironment (MSCs as seed cells, bone materials/implant as scaffold, and blood clots as microenvironment). Although a higher ESBG level was detected in the grafted group (p = 0.0003), it did not seem to be the pivotal factor affecting the survival rate of implants after MSFE, with or without bone grafts. Another systematic review assessed the effects of the MSFE without bone materials [12]. Lie et al. also reported a high survival rate for dental implants after MSFE with and without augmentation materials (98.73% and 97.92%, respectively). However, that review only evaluated MSFE using the lateral window approach for implantation and failed to estimate the sample size for the meta-analysis. We concluded that the difference between the two groups was not significant for lateral window osteotomy or transalveolar maxillary sinus floor elevation. We speculated that RBH (RBH in conventional MSFE ≤ 5 mm, RBH in non-graft MSFE > 5 mm) was not a factor influencing survival rate. It should be noted that some studies were limited to 6 months. More studies with longer follow-up durations are required to evaluate the long-term survival rates of implants.
As a common complication, perforation of the Schneiderian membrane occurs in 12–44% of cases, according to a previous study [46]. Our review tried to perform a perforation analysis of MSFE with and without bone materials. Our data suggest that MSFE with or without bone materials did not have an impact on perforation of the sinus membrane (p = 0.25). This conclusion was confirmed by TSA, funnel plot analysis, Egger’s test, and sensitivity analysis. For instance, in a study by Borges et al., sinus mucosal perforations (< 2 mm) were left without a membrane or suture. Felice seals the perforation at the Bio-Oss site with an ion barrier. Hence, if perforations are appropriately handled during the MSFE procedure, there is no difference in the survival rates for implants placed in the maxillary sinus. Our conclusion is similar to Benedicta’s opinion that perforations do not have a negative impact on survival rate or long-term new bone stability [47].
MBL has a significant impact on the long-term survival rate of implants. Within the first year of functioning after implant placement, the resorption of the alveolar bone around the implants did not exceed 2 mm. The mean annual absorption of the peri-implant alveolar bone after 1 year should be less than 0.2 mm. Meeting both these criteria can be considered a successful implantation [48]. In terms of the MBL in the MSFE, the results revealed no significant difference between the two groups (p = 0.62). The MBL in both groups met the criteria for successful implantation. Nonetheless, the inadequate sample size of the current trials may have affected the detection of potential publication bias. As TSA was not performed, the current conclusion regarding MBL has the possibility of false negatives. MBL is inevitable whether bone materials are used for MSFE or not. MBL is associated with the smoking status, occlusal load, oral hygiene, and alveolar bone quality.
Only one study compared the VAS scores for postoperative sensation between the two groups. No difference was detected between the non-grafted and grafted sides. However, the non-graft group reported fewer days of pain and sick leave than the graft group. An autogenous bone graft was used in the graft group, which may have caused swelling and pain in the donor area. Other bone materials (xenografts, allografts, and nanoparticles) have not been reported. Whether the use of these materials can achieve similar recovery as the group without bone grafts requires further investigation. One of the factors affecting postoperative recovery is operation time. Based on available evidence, there is still no clear conclusion between the two groups. We considered that the skill level of the surgeons would have an important effect on the surgical time.
Only one article analysed the surgical costs of the two groups from the perspective of health economics. One thing is certain: that if both groups can achieve the same long-term success rate for implants, it can reduce the cost of bone graft materials for patients. Patients will pay an additional fee if a 3D barrier guide is used as a tent in non-graft MSFE. However, the various biomaterials used for MSFE vary in cost and performance depending on patient preference. On the other hand, price is not the only measurement of dental implant services. From the patient’s perspective, the cost to patients depends on multiple factors. For instance, many patients from towns are unwilling to seek medication in county hospitals. They prefer driving to get medical treatments in municipal hospitals. Patients fail to take accommodation cost, time cost, and travel cost into consideration. The cost of dental implants in county hospitals is much cheaper than that in municipal hospitals at the same technical level. Consequently, the hierarchical medical system is of benefits for patients, doctors and the government. From the perspective of accounting, economics and management decision makers, the price of a medical service consists of direct and indirect costs. The direct cost is the sum of personnel wages and the consumption of sanitary materials. A dentist’s salary is related to his market value. The market value of an experienced expert and a less experienced doctor must be different. The indirect cost refers to the consumption for production. For example, hospital administration, logistics managers, and medical and technical departments share the costs of the department. We plan to conduct further studies on various graft materials in MSFE. Cost-effectiveness analyses of biomaterials in MSFE can be performed in the future.
The limitations of this review are as follows. (1) The strength of evidence outcomes is low and moderate, and conclusions are likely to change in the future. (2) Most studies draw conclusions based on short-term follow-ups. (3) Some RCTs included in this review failed to control for confounding factors. (4) All results from meta-analyses need to be interpreted with caution. As a clinical dentist, personal experience, medical evidence, and individual differences should be combined to serve patients.
In conclusion, this systematic review revealed that both non-graft and grafted MSFE had high implant survival rates. Although the grafted MSFE had a higher ESBG, this did not seem to be a determining factor for implant survival. According to the available evidence, there was no significant difference in the MBL and perforation rates between the two groups.